Cryptocurrency Expert: 9.11 Bitcoin (BTC) Don’t Mistake the Correction for a Peak, Deep Analysis of K-Line Structure? Latest Market Analysis and Trading Suggestions
The current price of Bitcoin is 77100, is it a normal correction? Or has the upward trend ended? Many people previously held long positions and made significant profits, but now watching the price drop makes them anxious, unsure whether to hold or exit; those who missed the opportunity are waiting for a deep correction to enter, but are afraid of catching the bottom too late. The market is always a game between bulls and bears, and there is no absolute standard answer, but we can use cycle charts to clearly see the current support and resistance levels, and manage our positions and risk.
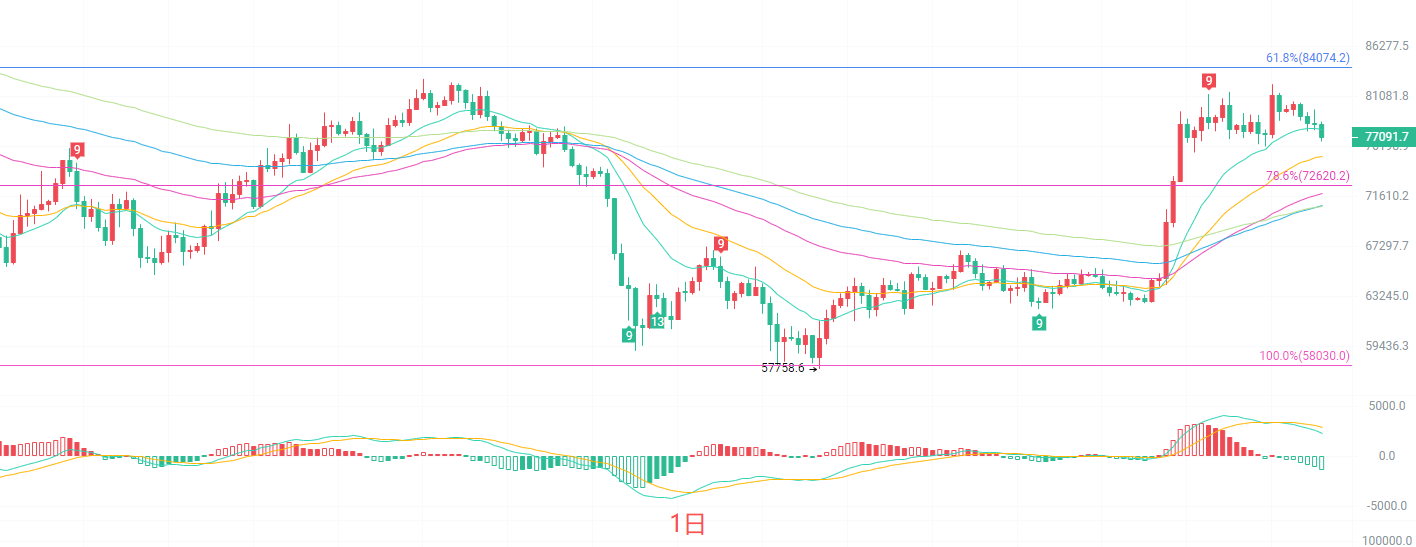
On the daily K-line chart, the short-term EMA15 has already turned downwards, and the price has fallen to test support near the EMA30 moving average. The MACD indicator shows a continuous contraction of the red bars, and the DIF has signs of crossing below the DEA forming a death cross. The middle line of the Bollinger Bands at 76337 is the critical defense line below. On the daily chart, the overall trend is still upward and has not been completely broken, but bullish momentum is clearly weakening, and the market has shifted from a unilateral rise to a high-level correction phase. If this daily candle closes below the middle line of the Bollinger Bands, the correction space will further open up; if it holds above the middle line, it is likely to enter a wide-ranging consolidation phase.
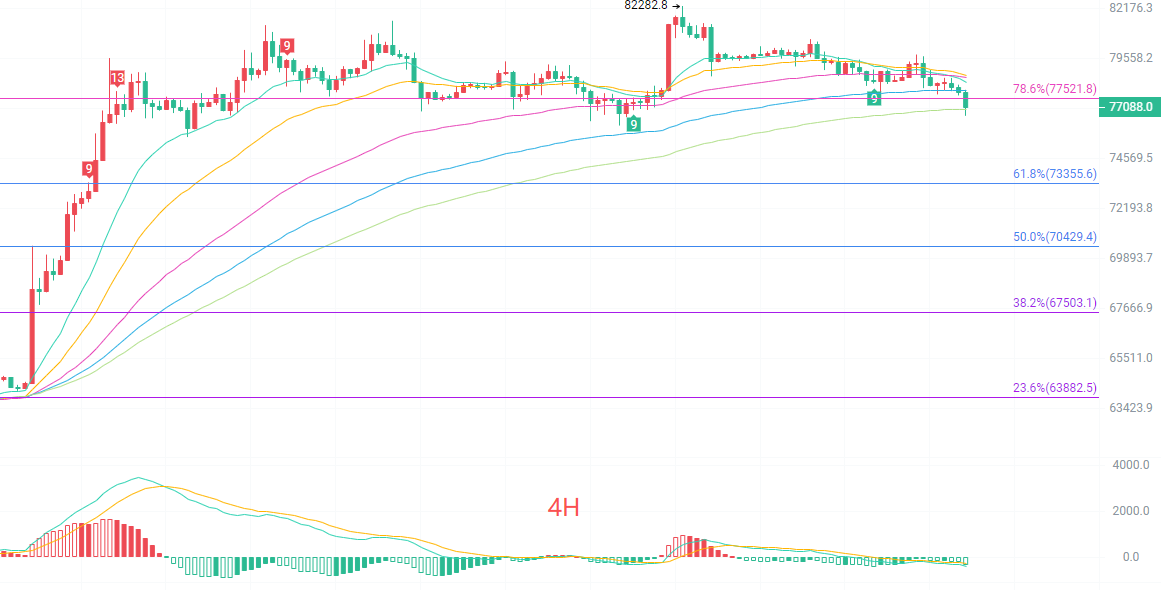
The short-term moving averages on the four-hour K-line have all turned into a suppressive stance. The MACD is continuously operating below the zero axis, with green bars maintained, and bearish forces are gradually being released. The Bollinger Bands are beginning to contract, with the upper band at 79676 forming resistance above, and the lower band near 77463 is currently undergoing testing. The four-hour level has shown a shape where the highs are progressively lowering, which is a typical correction structure. Short-term rebounds mostly belong to technical corrections, and rebounds to the moving average resistance levels are likely to face renewed downward pressure; do not mistake short-term rebounds as the start of a new upward movement, as the risk of chasing longs is high.
Short-term Reference
Support from 76500 to 76000, stop loss 500 points, target 77500 to 78500
Resistance from 78500 to 79000, stop loss 500 points, target 78000 to 77000
Specific operations should be based on real-time market data. For more information, details can be consulted with the author; the publication of this article may have delays, and it is recommended for reference only, with risks taken on by the reader.

Warm Reminder: The above content is created only by the author's public account, and the advertisements at the end of the article and in the comment section are unrelated to the author. Please discern carefully, thank you for reading.
免责声明:本文章仅代表作者个人观点,不代表本平台的立场和观点。本文章仅供信息分享,不构成对任何人的任何投资建议。用户与作者之间的任何争议,与本平台无关。如网页中刊载的文章或图片涉及侵权,请提供相关的权利证明和身份证明发送邮件到support@aicoin.com,本平台相关工作人员将会进行核查。