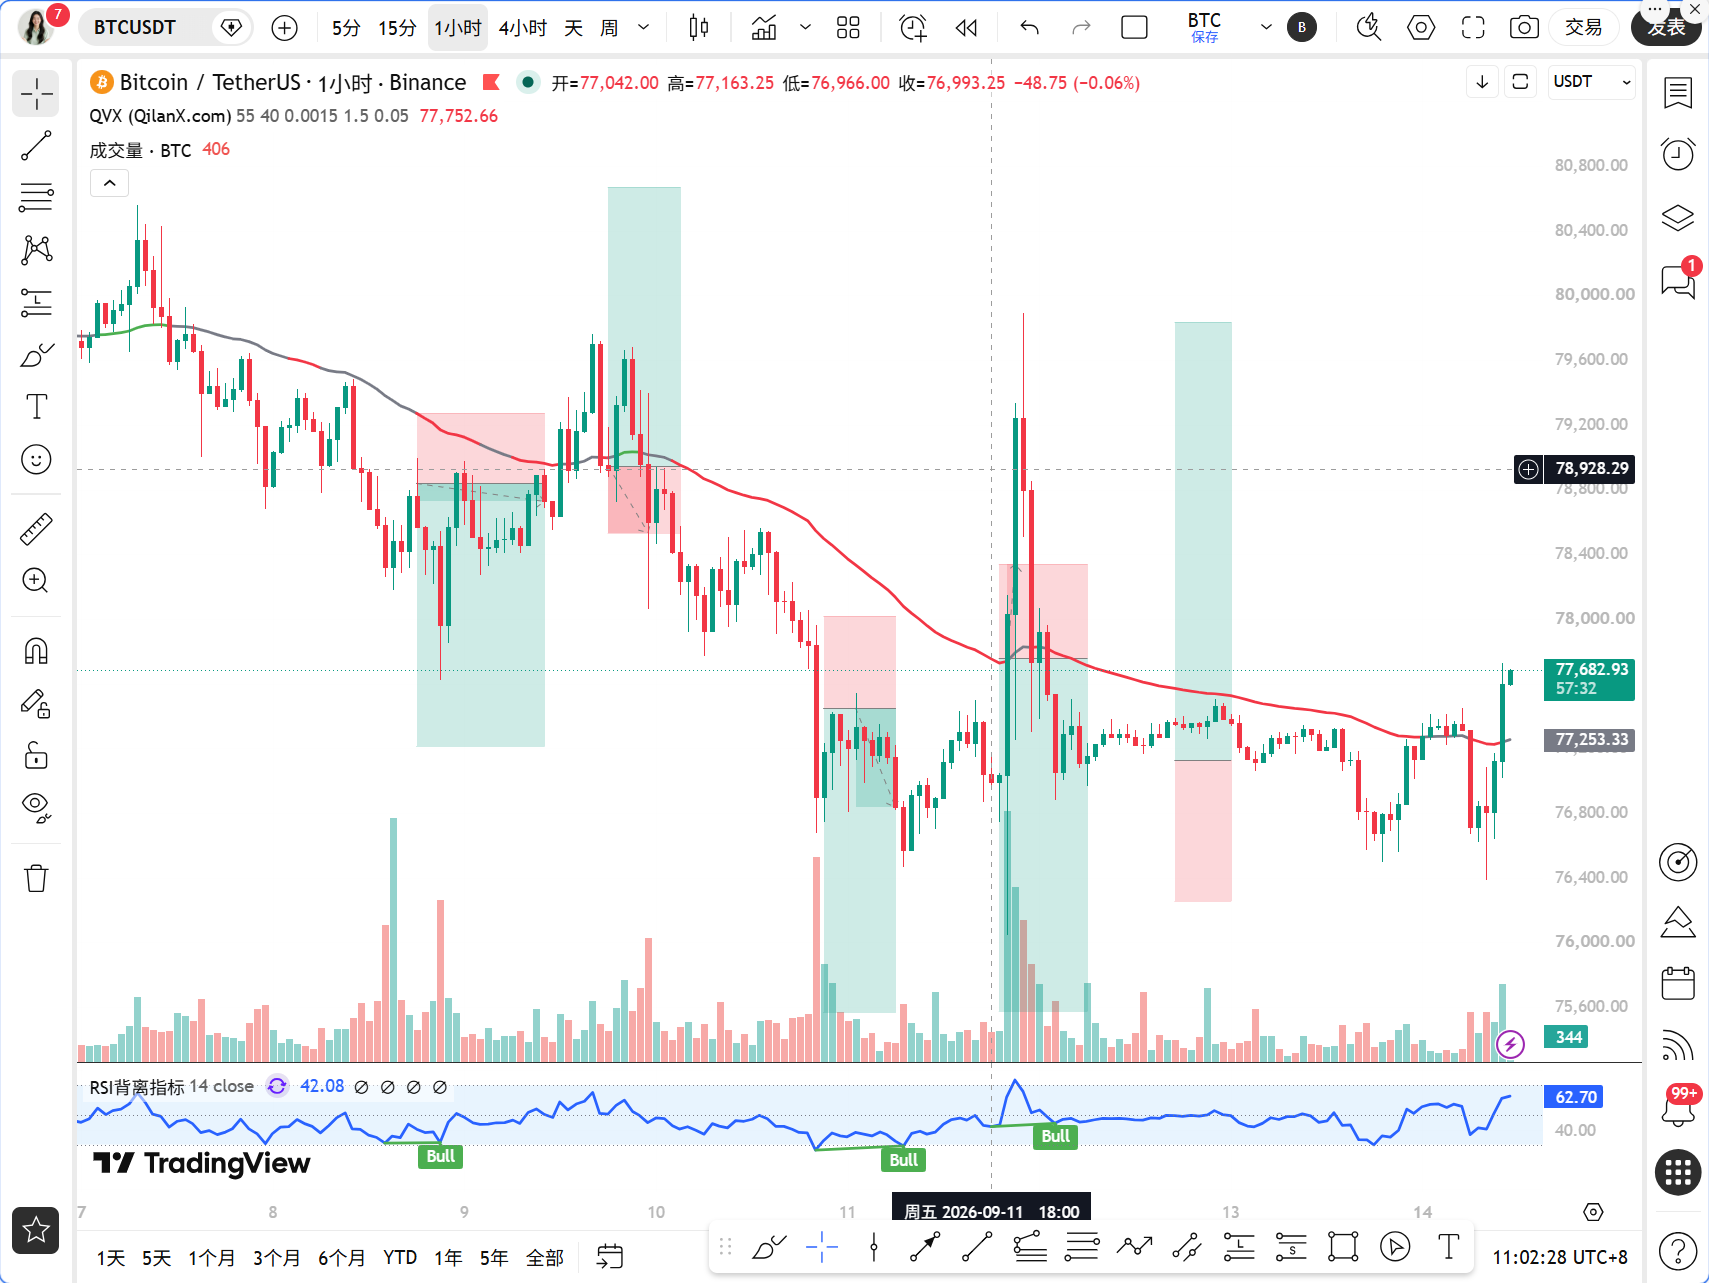
Tom Lee's latest statement indicates that the cryptocurrency market looks very bullish for the next 12 months, with the bottom of the four-year cycle possibly appearing next month. This assessment aligns with Morgan Stanley's recent acquisition of 203 BTC, indicating that institutions are indeed continuously sending positive signals. On the other hand, the 10-year US Treasury yield nearing 5% creates significant pressure on risk assets, and the probability of the CLARITY Act passing in 2026 is priced at only 20%, cooling regulatory expectations. With the interplay of bullish and bearish factors, BTC is currently priced at 77655 USDT, in a very delicate game position.
Today is September 14th, 11:01, with BTC priced at 77655 USDT. The price change over the past 24 hours is only 0.41%, appearing calm on the surface, but contract positions have sharply decreased by 1 billion dollars in 24 hours, indicating that the leverage cleansing triggered by CPI data has just been completed, and the market structure is being reshaped. The Fear and Greed Index is at 57, in the greed zone but not overheating, with BTC's market share at 58.92%, showing that funds are still concentrating on Bitcoin. This decrease in volume often signals a potential trend change; next week, the Federal Reserve's interest rate decision and the Senate's deliberation on the CLARITY Act will come at the same time, likely amplifying volatility.
First, let's examine the multi-timeframe status. On the daily level, MA5=77114, MA10=78161, MA30=76471, with the price at 77655 above MA5 and MA30 but suppressed by MA10. The MACD histogram value is -730.81, still negative, with DIF=1471 above DEA=2201, not yet forming a golden cross. RSI=46.49 is neutral and slightly weak, with the daily level overall in a stage of correction. On the 4-hour level, MA5=77141, MA10=77180, MA30=77536, with the price at 77655 above MA5 and MA10 but still below MA30. The MACD histogram value is 83.44, positive, with DIF=-254 above DEA=-337, indicating that short-term momentum is slightly bullish. RSI=56.41 is neutral and slightly strong, with a weak rebound structure on the 4-hour chart. On the 1-hour level, MA5=77204, MA10=77202, MA30=77135, with all three lines closely packed. The price at 77655 is clearly above all three moving averages, with the MACD histogram value at 55.46 positive and DIF=42.60 above DEA=-12.85. RSI=66.64 is strong but not yet in the overbought zone, indicating a bullish structure on the 1-hour chart. On the 15-minute level, MA5=77533, MA10=77202, MA30=77088, with the price at 77655 above all moving averages. The MACD histogram value is 107.72 positive, with DIF=119.62 significantly higher than DEA=11.90, and RSI=71.40 entering the overbought zone, showing short-term signs of overheating.
Now let's use the TPV system for signal validation. The 1-hour EMA55=77198.53, and the current price of 77655 is about 456 points above EMA55, a margin of 0.59%. According to the TPV system rules, in the past 8 1-hour candlesticks, the closing price was above EMA55 4 times and crossed it 2 times, with the absolute margin of price to EMA55 at 0.59% exceeding the 0.3% threshold. However, the number of closing instances at 4 falls within the oscillation range of 3 to 5, and the crossing instances at 2 also satisfy the criteria for oscillation judgment. This indicates that the current 1-hour level is in a state of oscillation, and the TPV system clearly indicates not to actively go long or short, only providing the range. This point is crucial; many traders rush to chase longs when seeing the price above EMA55, but the system tells you this is not a trending market. Patience in waiting for signal confirmation is the correct approach.
In terms of patterns and momentum, the 15-minute RSI has reached 71.40, entering the overbought zone, suggesting short-term retracement pressure. The 1-hour RSI=66.64 is slightly strong but still has space before reaching the 70 overbought threshold. The MACD histogram value of 55.46 remains positive, with the gap between DIF and DEA widening, indicating that bullish momentum on the 1-hour level is still ongoing. The 4-hour MACD histogram value is 83.44, positive, with DIF approaching DEA from below. If DIF crosses above DEA to form a golden cross next, it will confirm enhanced bullish momentum on the 4-hour level. The daily MACD histogram value remains at -730.81, which is the biggest concern, as the bearish momentum on the daily level has not been fully released, meaning there could be selling pressure at any time during the rebound.
From an on-chain and funding perspective, the Fear and Greed Index at 57 is in the greed zone, suggesting that market sentiment is not pessimistic. Morgan Stanley's recent purchase of 203 BTC, bringing their total holdings above 7855 BTC, indicates that institutions are still accumulating at this level, providing substantial support below. The BTC market share of 58.92% shows that funds are concentrating on Bitcoin rather than flowing into altcoins, which is typically one of the features of a mid-term market bottom. However, Polymarket data shows a 68.5% chance for BTC to drop to 75,000 in September and a 64% chance to touch 80,000, indicating that the market is pricing in greater downside risks than upside risks, creating a certain expectation gap with institutional accumulation.
Regarding key support and resistance levels, the first resistance above is around 78161, which is where daily MA10 is located, also the lower edge of a previous concentrated trading area. A stronger resistance is at 81700, as the news clearly states that BTC must break above 81700 USD to confirm a bull market; this position is a watershed for mid-term bullish and bearish sentiment. The first support below is at 77198, which is 1-hour EMA55, marking the boundary for bullish and bearish on the TPV system, and is also the most important defensive level in the short term. A stronger support is at 76471, which is daily MA30; if this position breaks, the adjustment at the daily level will deepen. The current price of 77655 is exactly in the middle of the range from 77198 to 78161, with space both above and below.
Trading ideas. Directional Judgment: The current 1-hour level is in a state of oscillation, and the TPV system does not recommend actively going long or short, but the 4-hour and 1-hour structures lean towards the bullish side, and the daily level is still repairing, overall categorizing as oscillatory bullish. Conditions for going long: wait for the price to retrace near 1-hour EMA55 at 77198, forming support stabilizing patterns such as long lower shadows or bottom formations, while MACD histograms shorten for 2 consecutive periods or RSI rises from a lower position; once all three criteria are met, you can enter a light long position. Entry reference is from 77200 to 77300, with a stop loss set below 76800, and first target at 78160, second target at 79000. Conditions for going short: if the price shows long upper shadows or top formations near 78160 and the 1-hour MACD histogram shortens for 2 consecutive periods or RSI drops from above 70, a light short position may be considered, entering reference from 78000 to 78160, with a stop loss set above 78500, and targets at 77200. It is crucial to emphasize that under the current oscillatory pattern, position management is more important than directional judgment, and it is advised not to exceed 5% of total funds per position; consider increasing position size only after the Federal Reserve's decision and the voting results on the CLARITY Act next week are settled.
Risk Warning: The US Treasury yield nearing 5% may trigger a collective correction in risk assets, and the 20% probability of the CLARITY Act passing indicates high regulatory uncertainty; please strictly follow stop-loss discipline.
Follow Qinglan Crypto Class to seize more trading opportunities! Welcome to visit the official website www.qinglan.org
📊 Qinglan TPV Trading Strategy Backtest Reference
🕒 Last Backtest Time 09-14 07:00:02
Total Analysis: 3999 Backtest: 3988 Accuracy Rate: 78.5% (3130/3988)
免责声明:本文章仅代表作者个人观点,不代表本平台的立场和观点。本文章仅供信息分享,不构成对任何人的任何投资建议。用户与作者之间的任何争议,与本平台无关。如网页中刊载的文章或图片涉及侵权,请提供相关的权利证明和身份证明发送邮件到support@aicoin.com,本平台相关工作人员将会进行核查。