Written by: Rita
The yield on the 30-year U.S. Treasury bond has risen to 5.3%, marking the highest level in nearly 20 years. The yield on the 10-year Treasury bond reached nearly 5% this week, a new high since October 2023. Goldman Sachs noted in its weekly outlook report on the U.S. published on September 11, 2026, that rising interest rates pressure stock valuations, with earnings being the most important driver of stocks. The forward price-to-earnings ratio of the S&P 500 has declined from 22 times at the beginning of the year to 19 times, while the index remains within 2% of historical highs.
Goldman Sachs economists expect the Federal Reserve to raise interest rates by 25 basis points next week. Recent communications with corporate and portfolio managers focused on the impact of high interest rates on stocks. Goldman analyst Ben Snider listed seven key conclusions in the report, covering valuation, the interest rate hike cycle, interest rate sensitivity, balance sheets, and sector differentiation.
Declining P/E Ratios But Relative Valuation Against Bonds Remains Unchanged
The forward price-to-earnings ratio of the S&P 500 has fallen from 22 times at the start of the year to 19 times, with uncertainties related to AI and concerns over earnings sustainability being some of the multiple pressures, along with rising interest rates. The earnings yield of the S&P 500 is 5.2%, while the real yield on 10-year U.S. Treasuries is 2.6%, resulting in a gap of 270 basis points. Goldman noted that this yield gap has remained roughly stable over the past two years, with the market's implied equity risk premium also stable at 3%.
The equity risk premium reflects the extra return required by investors for holding stocks instead of bonds. Goldman believes that regardless of interest rate levels, increasing interest rate volatility will also pose challenges to stocks.
Stocks Under Pressure at the Start of the Rate Hike Cycle, Subsequent Returns Appreciable
Goldman analyzed seven interest rate hike cycles over the past few decades, finding that the average return of the S&P 500 three months after the first hike is a negative 2%. In the same set of cycles, the average return 12 months after the first hike is a positive 9%, showing positive returns in each instance except for 2022. In 1997, the S&P 500 dropped 10% during a 25-basis-point tightening cycle by the Federal Reserve, and when the market stopped pricing in further tightening, stocks bottomed out and reached new highs within three months.
The current interest rate market has priced in more than three 25-basis-point hikes through mid-2027. Goldman believes this raises the threshold for policy to exceed hawkish expectations. The medium-term impact of Fed tightening on stocks depends on how tightening affects earnings growth.
Stocks More Sensitive to Long-Term Rates
Goldman's dividend discount model indicates that about 75% of the S&P 500's present value reflects cash flows beyond ten years. The correlation between stock returns and interest rate changes is strongest for long-term bonds. Inflation will push up the nominal value of future cash flows, making stock valuations more sensitive to rising real interest rates.
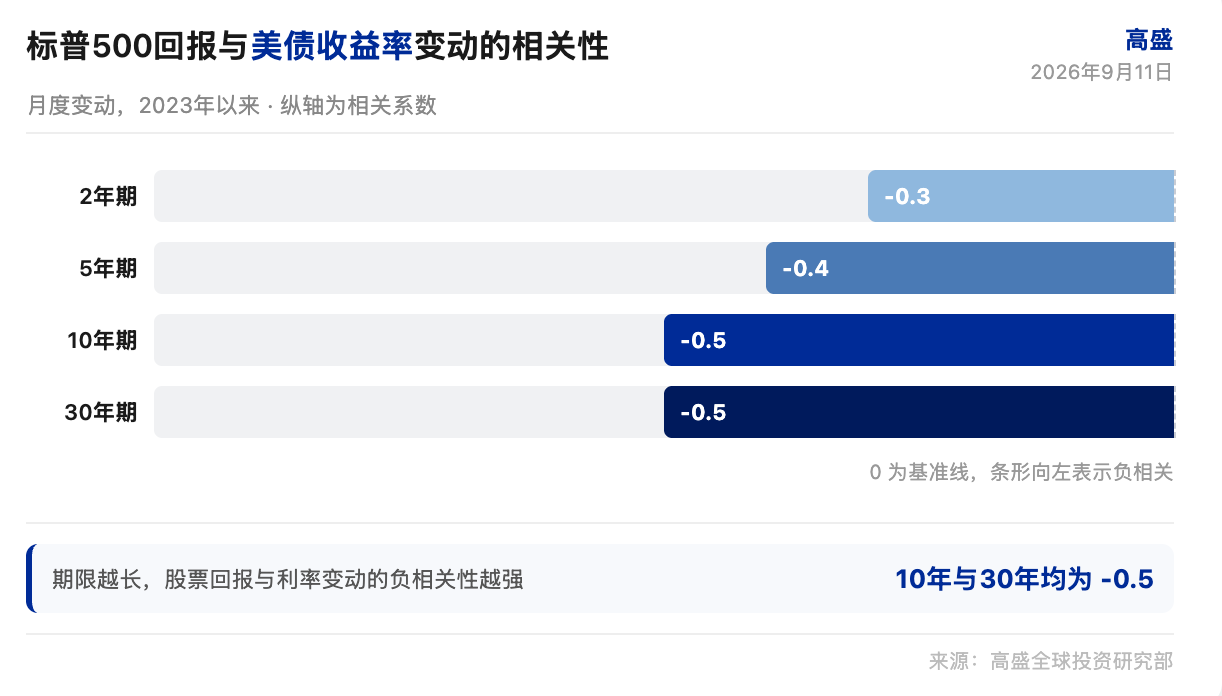
Interest rate volatility is equally important. Over the past few decades, unless interest rates rise at a rate exceeding 2 standard deviations, stocks typically still achieve positive returns during periods of rising interest rates. The current monthly change of the 10-year Treasury yield at 2 standard deviations is about 50 basis points, and around 30 basis points over two weeks. The rapid interest rate movements in recent weeks explain the difficulties that stocks face in digesting these changes.
Corporate Balance Sheet Risk Is Limited
The cost of borrowing for the S&P 500 has moderately increased in recent years, with most companies' debts being fixed-rate and longer-term, so interest expenses relative to robust profits remain small.
The overall and median interest coverage ratios for the S&P 500 are in the 99th and 68th percentiles, respectively, over the past 20 years. Smaller companies have weaker balance sheets, with a higher proportion of floating-rate debt, making them more vulnerable to shocks.
Significant Differences in Sector Sensitivity to Interest Rates
Real estate and construction stocks are among the most sensitive to long-term rates in the equity market. Since June, homebuilder stocks have underperformed the equally weighted S&P 500 by 16 percentage points. Financial stocks typically perform better during periods of rising interest rates. AI stocks have a mild negative correlation with real yields.
Goldman points out that companies can maintain valuations by either lowering risk premiums or increasing growth rates. To fully offset the impact of a 1-percentage-point increase in equity costs, companies need to increase their expected long-term growth rate by 2 percentage points. Capital expenditures and R&D investments are one pathway to enhance growth, while mergers and acquisitions along with spinoffs are alternative paths. Mergers and acquisitions announced in the U.S. so far this year have reached $1.4 trillion, a 36% year-over-year increase in global deal volume.
Regarding S&P 500 earnings forecasts, Goldman expects earnings per share of $340 in 2026, a 24% year-on-year increase, and $385 in 2027, a 13% increase year-on-year. The year-end target price is 8000 points, with a 12-month target price of 8300 points.
Disclaimer
This article is a整理与解读 of a third-party brokerage research report (Goldman Sachs Group, September 11, 2026) by潮向研究, combined with publicly available market information. The ratings, target prices, earnings forecasts, and related judgments quoted in this article reflect the views of the analysts from that brokerage, representing only their institution's position, and do not reflect the views of潮向研究 nor constitute any investment advice.
Markets have risks, and decisions should be made independently. This article should not be taken as a basis for buying or selling any securities.
免责声明:本文章仅代表作者个人观点,不代表本平台的立场和观点。本文章仅供信息分享,不构成对任何人的任何投资建议。用户与作者之间的任何争议,与本平台无关。如网页中刊载的文章或图片涉及侵权,请提供相关的权利证明和身份证明发送邮件到support@aicoin.com,本平台相关工作人员将会进行核查。


