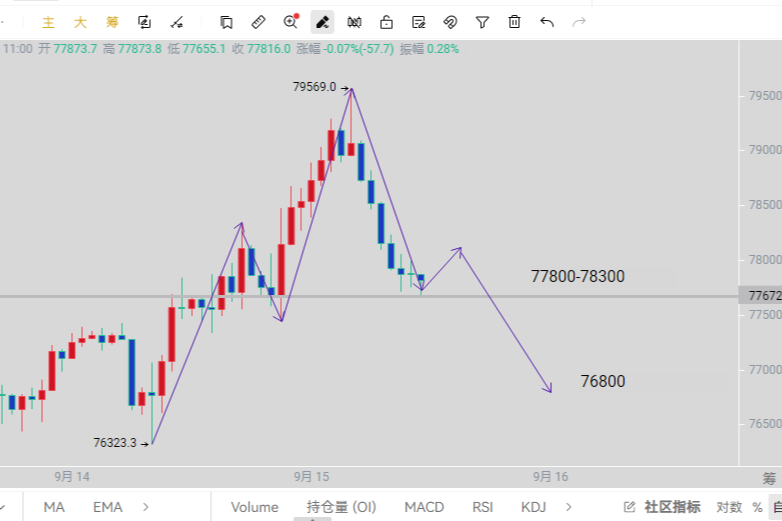
Dear teammates, the biggest shock in the market today comes from the macro perspective. August CPI exceeded expectations, pushing the probability of a Federal Reserve rate hike in September to 78%. JPMorgan has even raised its forecast for rate hikes in 2026 to two times, and the yield on US Treasury bonds has surged to 5%. Meanwhile, Trump's concession has increased the probability of the CLARITY Act passing to 33%, and expectations for regulatory clarity are warming up. On one side, there is the bearish sentiment from tightening liquidity, and on the other side, the bullish sentiment from regulatory easing; these two forces are strongly counterbalancing each other in the BTC market. It is also worth noting that post-00s trader 0xRay518 has increased his short positions in PONS and SNDK while reducing his BTC position to lock in profits, indicating that smart money is choosing caution at the current price levels. BTC has already fallen below $77,000, and Jiang Zuoer has also stated that if it drops below $76,500, it will accelerate its drop. These signals combined make today’s 1-hour EMA55 line the battleground between bulls and bears.
Current Price and Time
The current time is September 15, 11:31, with the latest BTC quote at 77,804 USDT. The 24-hour price change is -0.13%, nearly flat, but the internal gaming of the market is far more intense than this figure suggests. The fear and greed index reports 69, still in the greed zone, indicating that market sentiment has not yet entered panic, and bottom-fishing funds are still on the sidelines rather than fleeing. BTC's market dominance is at 58.41%, and there is no significant capital flow towards altcoins, demonstrating that the market is in a defensive posture.
Multi-cycle Status Overview
First, look at the daily level. The daily MA5 is at 77,467.87, MA10 is at 78,012.42, and MA30 is at 76,985.83. The current price of 77,804 is between MA5 and MA10, in a volatile pattern trapped by moving averages. The daily MACD candlestick is -648.89, DIF is at 1,400.88, and DEA is at 2,049.77. The fast and slow lines are still in a dead cross state, but the histogram has not further expanded, indicating that the downside momentum at the daily level is waning. The daily RSI is at 51.41, exactly near the middle line, with neither bulls nor bears holding an absolute advantage at the daily level.
Next, look at the 4-hour level. The 4-hour MA5 is at 78,265.79, MA10 is at 77,807.84, and MA30 is at 77,439.78. The current price of 77,804 is just touching MA10, while MA5 is above the price, forming short-term resistance. The 4-hour MACD candlestick is at 162.87, DIF is at 96.75, and DEA is at -66.13. The fast and slow lines are golden-crossed, and the histogram is positive, providing the most bullish signal across all time frames. The 4-hour RSI is at 56.71, in a neutral to strong area, with no overbought pressure.
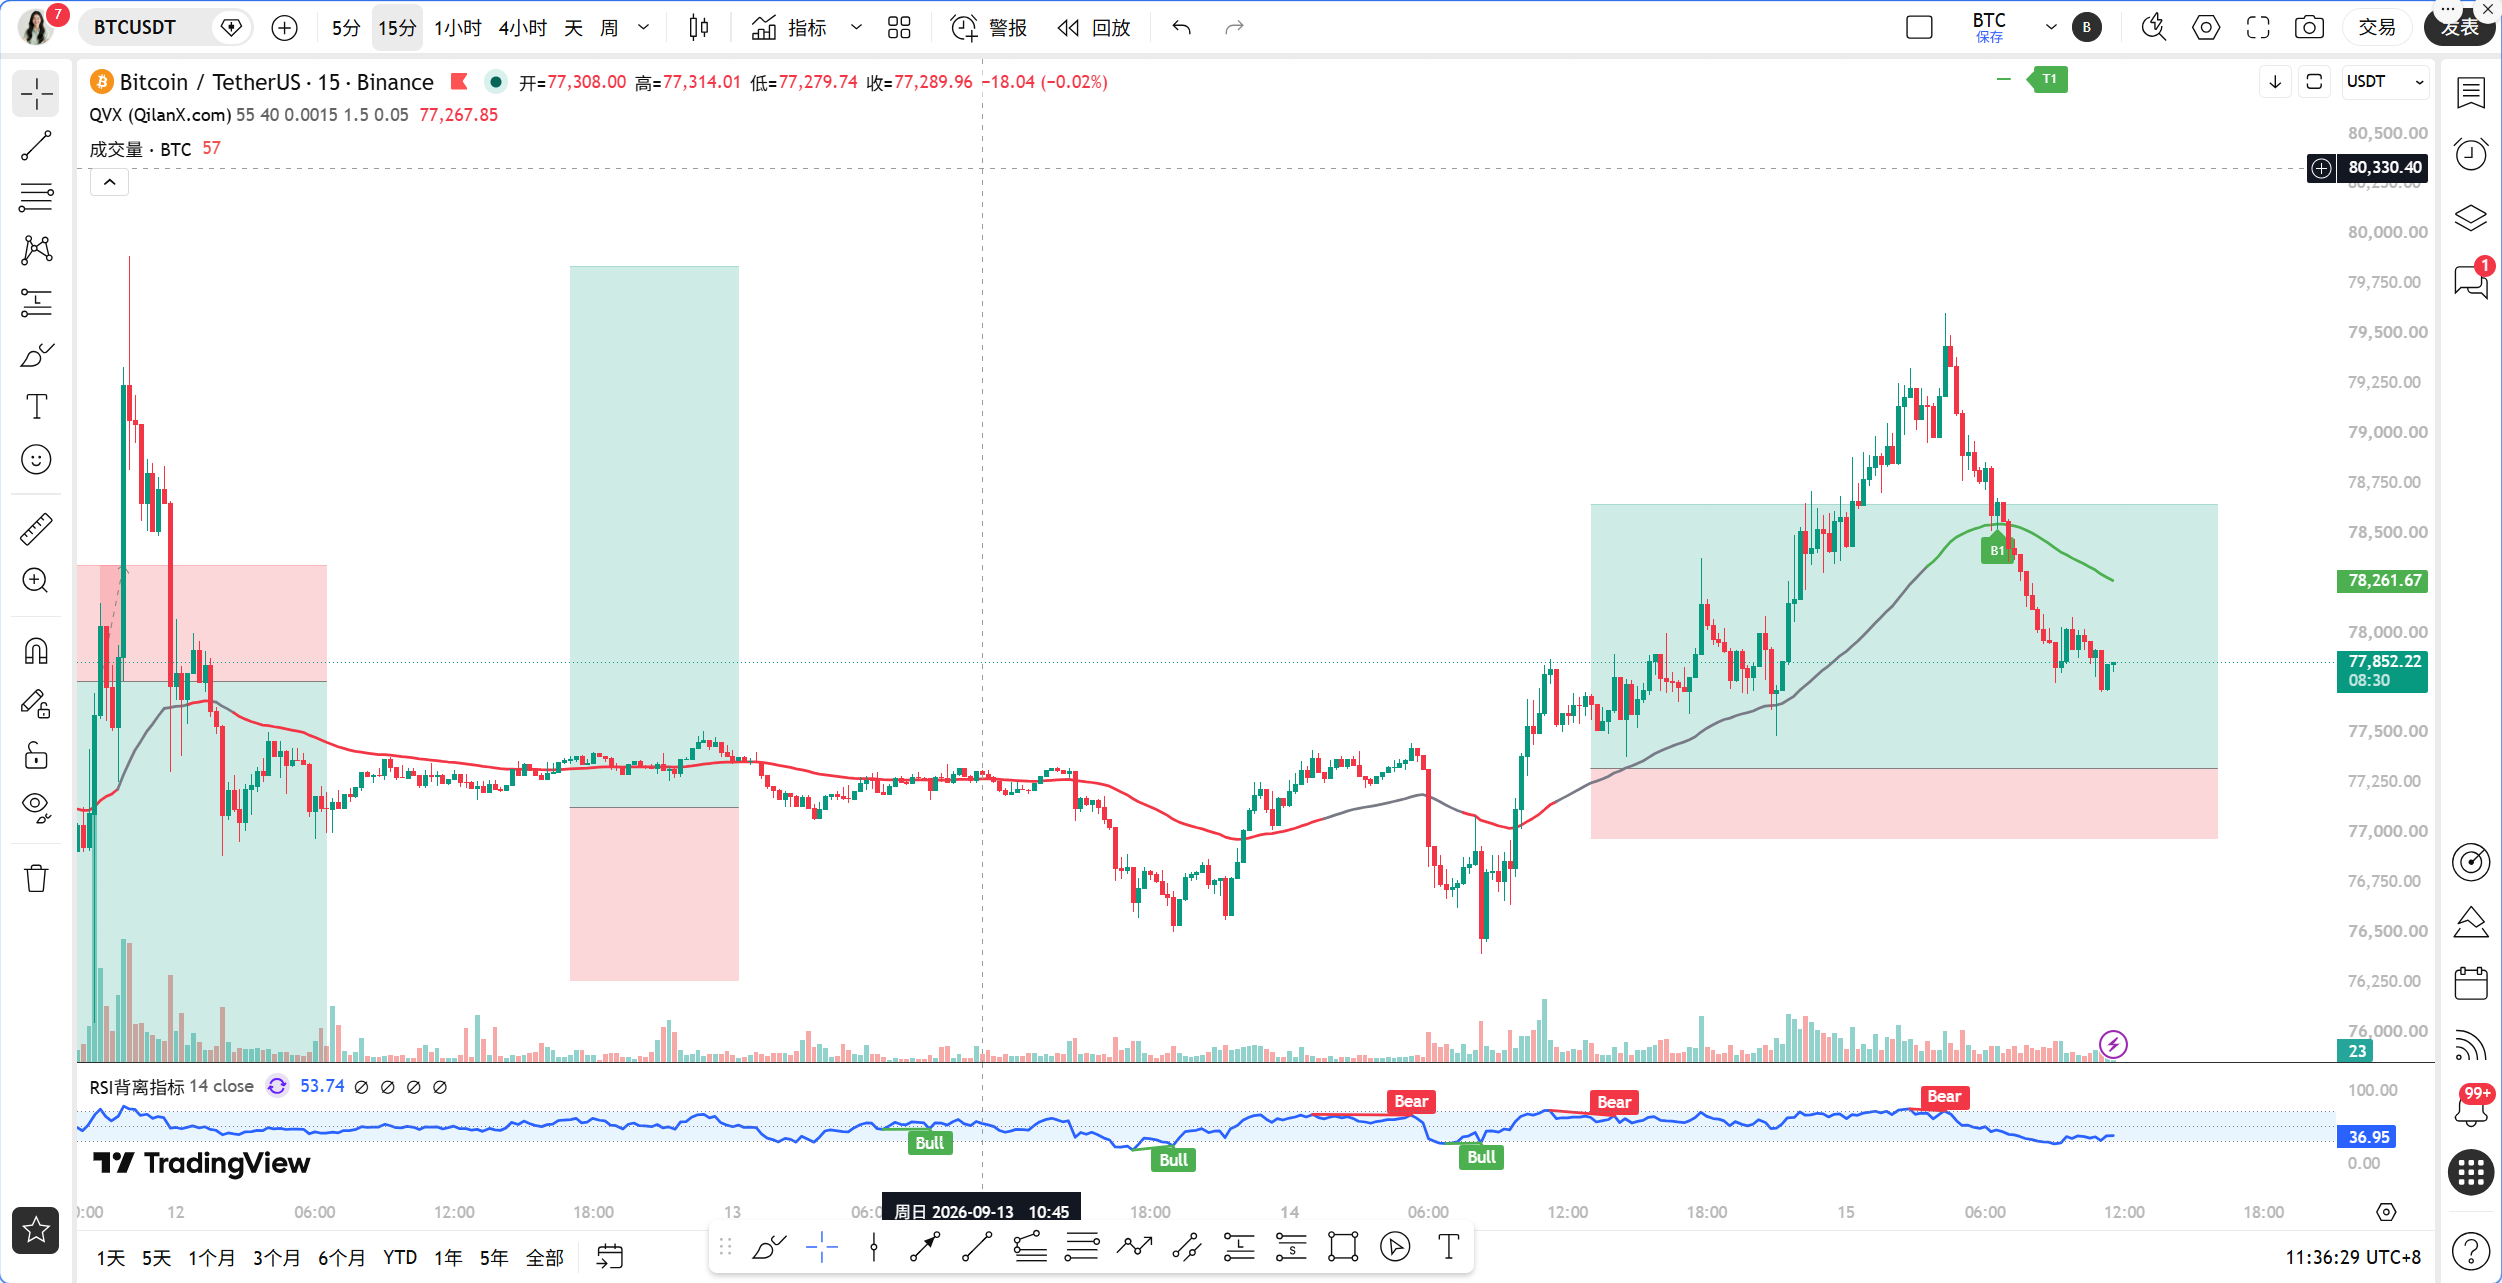
The 1-hour level is the core of today’s analysis. The 1-hour MA5 is at 77,955.49, MA10 is at 78,440.13, and MA30 is at 78,002. All three moving averages are above the current price, forming a bearish arrangement. The 1-hour MACD candlestick is at -145.57, DIF is at 110.92, and DEA is at 256.49. The fast and slow lines are in a dead cross state, and the histogram is negative, with downward momentum still being released. The 1-hour RSI is at 43.29, weak but not yet oversold. The critical point is that the 1-hour EMA55 is at 77,817.16, and the current price of 77,804 is just below EMA55, with a difference of only about 13 points, an absolute magnitude of 0.02%.
At the 15-minute level. The 15-minute MA5 is at 77,831.77, MA10 is at 77,889.36, and MA30 is at 78,332.57, with the moving averages arranged bearishly. The 15-minute MACD candlestick is at -1.38, DIF is at -213.56, and DEA is at -212.18, and the fast and slow lines are clinging below the zero axis, with a very small histogram, indicating that short-term momentum is in a vacuum state. The 15-minute RSI is at 36.19, close to oversold but has not yet triggered a rebound signal.
TPV Signal Verification
According to the core rules of the Qinglan TPV system, we will verify each point.
First, EMA55 Condition. The current price is 77,804, and the 1-hour EMA55 is at 77,817.16. The price is below EMA55, with a difference of only 0.02%. In the past 8 1-hour K-lines, the closing price was above EMA55 for 7 out of 8, with one crossing occurrence. This data is crucial, indicating that for the majority of the past 8 hours, the price has been operating above EMA55, and only in the most recent K-line did it dip below. According to TPV rules, to short, it requires two consecutive 1-hour K-lines to close below EMA55; currently, it only meets one condition and does not satisfy the short condition. To go long, it requires two consecutive 1-hour K-lines to close above EMA55; at present, this is also not satisfied. Therefore, from the trend positioning perspective, it is at a critical point of switching between bulls and bears, with direction still unconfirmed.
Second, Shape Condition. The current price is fluctuating near the line, with no long lower shadow support stabilization patterns appearing, nor any long upper shadow resistance patterns. Neither bottom or top divergence formations have occurred. This means that the shape dimension does not support any proactive entry direction.
Third, Momentum Condition. The 1-hour MACD candlestick is -145.57, the previous value is negative, but it needs to be observed whether it shortens continuously for 2 periods. From the data, both DIF and DEA are above the zero axis, but the histogram is negative, indicating that short-term momentum is skewed to the downside. The RSI is at 43.29, having rebounded from earlier lows but not entering the oversold area. The 15-minute RSI is at 36.19, close to oversold but not yet triggered. The overall momentum dimension shows that downward momentum is being released, but the exhaustion signal is unclear.
In summary, the TPV system currently provides the signal that: trend positioning is at a critical switching point, shape conditions are not satisfied, and momentum conditions are not satisfied. At the same time, the oscillation auxiliary data shows that the price is less than 0.3% from EMA55, belonging to near-line fluctuations, resulting in increased oscillation probability. However, the past 8 K-lines have a closing price above EMA55 for 7 out of 8, which does not align with typical oscillation thresholds. This is a typical near-line gaming pattern; the system recommends not actively going long or short but only giving a range.
On-chain and Capital Front
The fear and greed index is 69, in the greed zone. This position requires vigilance, as greed sentiment often corresponds to short-term peak areas. BTC's market dominance is at 58.41%, at a relatively high position, indicating that capital is concentrating on BTC, putting pressure on altcoins. This week, large unlocks of ARB, ZRO, and STRK have increased the supply pressure in the market. Oil prices surged 3% due to an attack on the oil pipeline, further reinforcing inflation expectations and forming pressure on risk assets. The panic selling in AI stocks may spread to the cryptocurrency market; the market panic triggered by Amodei's blog cannot be ignored. On the capital front, short-term short power is dominant, but the greed index has not yet turned to panic, indicating that the market has not yet reached an extremely pessimistic bottom-fishing moment.
Key Attack and Defense Positions
The first pressure level is at the 1-hour EMA55 of 77,817. This is the first threshold for the bull-bear division today. If the price can close above 77,817 for two consecutive 1-hour K-lines, the bullish trend will be re-established, with an upper target at the 1-hour MA10 of 78,440 and the 4-hour MA5 of 78,265. The first support level below is at the daily MA5 of 77,467, which is key recent support at the daily level. If it breaks below 77,467, the next support is at the daily MA30 of 76,985, and further down is the acceleration drop trigger point mentioned by Jiang Zuoer at 76,500. The current price of 77,804 is just trapped in the narrow range between EMA55 and the daily MA5, with limited space both above and below, but once a breakthrough occurs, momentum will be released rapidly.
Trading Thoughts
Direction: Currently at the critical point of near-line gaming, the TPV system does not meet any entry conditions for either direction, suggesting to watch and wait for signal confirmation. However, based on the 4-hour MACD golden cross and the background of the daily RSI midline, I personally lean towards waiting for confirmation of a long signal before entering, as the bullish structure at the 4-hour level has not been broken.
Entry Conditions: Going long requires meeting three conditions simultaneously. First, two consecutive closing prices of 1-hour K-lines stand above EMA55, i.e., above 77,817. Second, a support stabilization shape appears, such as a long lower shadow or bottom divergence. Third, the MACD histogram shortens for two consecutive periods or the RSI rebounds from the oversold zone. All three conditions are indispensable. To short, two consecutive closing prices of 1-hour K-lines need to be below EMA55, along with a long upper shadow or top divergence, and the MACD histogram should continuously expand.
Stop Loss: If entering long, the stop loss should be placed just below the daily MA5 around 77,400; if it breaks, exit. If entering short, the stop loss should be placed just above the 1-hour EMA55 around 77,900.
Target: The first target for a long position is 78,440 at the 1-hour MA10, and the second target is the 78,265 area at the 4-hour MA5. The first target for a short position is 77,467 at the daily MA5, and the second target is 76,985 at the daily MA30.
Risk Warning
The probability of a Federal Reserve rate hike has risen to 90%. In the context of tightening macro liquidity, any technical signal may be disrupted by sudden news. Strict stop loss is the only discipline.
Follow Qinglan's cryptocurrency classroom to seize more trading opportunities together! Welcome to visit the official website www.qinglan.org
📊 Qinglan TPV Trading Strategy Backtest Reference
🕒 Last Backtest Time 09-15 07:00:02
Total Analysis: 4020 Backtests: 4015 Accuracy Rate: 78.5% (3152/4015)
免责声明:本文章仅代表作者个人观点,不代表本平台的立场和观点。本文章仅供信息分享,不构成对任何人的任何投资建议。用户与作者之间的任何争议,与本平台无关。如网页中刊载的文章或图片涉及侵权,请提供相关的权利证明和身份证明发送邮件到support@aicoin.com,本平台相关工作人员将会进行核查。