Author: Alea Research
Translation: Shenchao TechFlow
Shenchao's Introduction: While the election prediction market is stagnant, large funds are repricing on the Federal Reserve interest rate contracts. This weekly report dissects two completely different trading ecosystems on Kalshi: one is the speculative short-term trading, and the other is the settled positions betting on the mid-term elections. For professionals interested in the data quality of prediction markets, there lies a key question: who is behind the "consensus probability" that you see.
Kalshi just experienced its second-largest trading week ever, with a transaction volume of $2.94 billion, eleven times that of the same period last year. However, this has hardly changed anyone's view. The contract for the Republicans winning the House closed at 16%, fluctuating within a five percentage point range since July. The Senate closed at 53%. Texas closed at 51%. One contract moved ten points within five days, and it was the only contract that settled in September.
$2.94 billion in transactions makes it the second-largest week in Kalshi's 271-week history. Only the week of July 2 exceeded it, reaching $3.07 billion.
On September 16, the Federal Reserve contracts crossed. The probability of a 25 basis point rate hike increased from 45% to 55%, reaching 81% on September 11 after two energy-driven inflation data releases.
The House contract has only covered a five-point fluctuation since July. The Federal Reserve contract covered fifty-five points.
Election-related trading volume decreased by 32.8% compared to the previous week, whereas the overall exchange grew by 12.3%. Positions actually increased.
Traders added 147 million open positions. 88% came from a series of combination contracts, rather than weekend parlay bets.
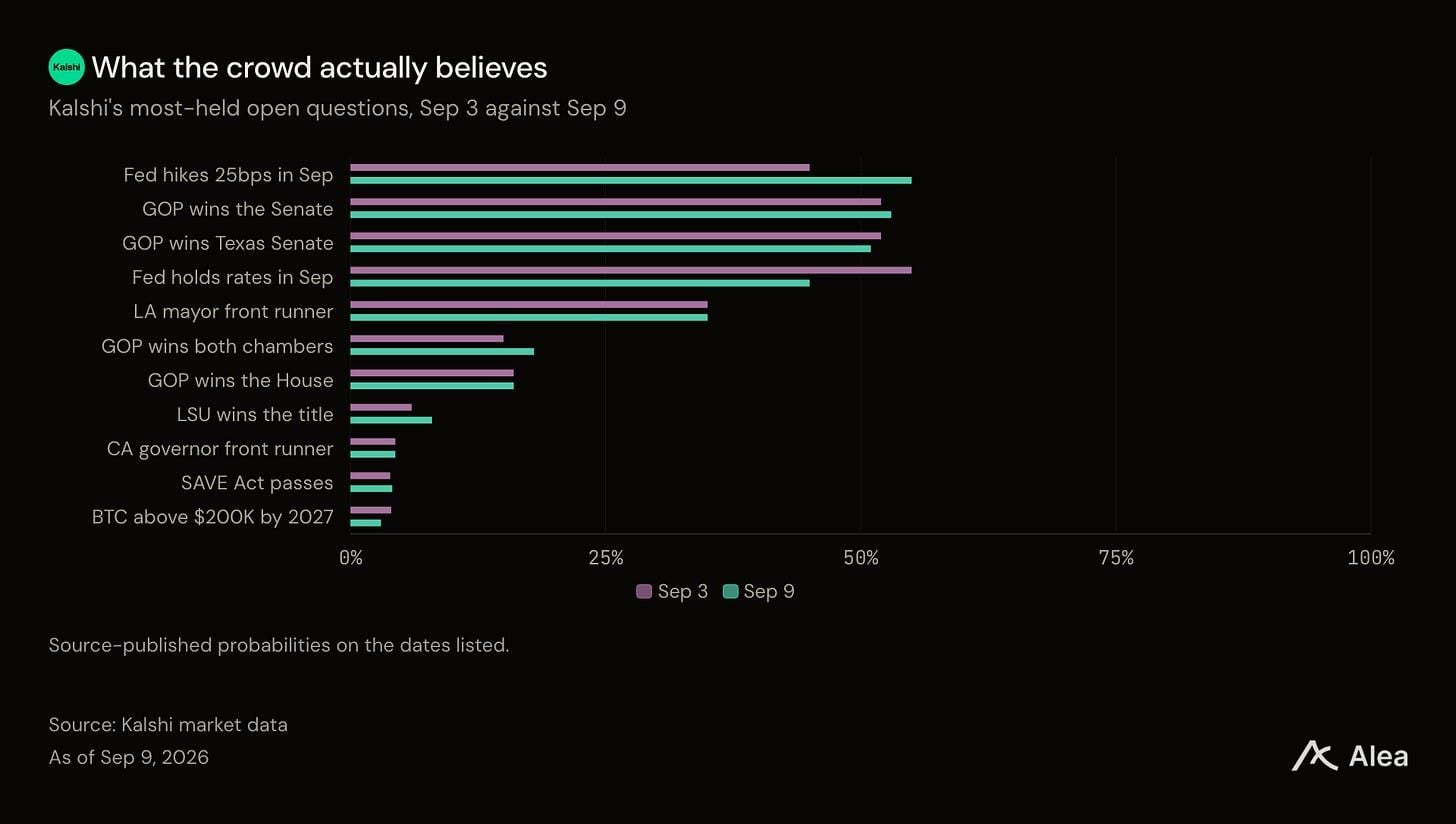
Figure: The 11 highest volume contracts on Kalshi and their corresponding probabilities (paired bar chart).
The Crowd Moved to Where the News Was
The election contracts were completely stagnant. The House contract closed at 16%, having stayed within a range of 14 to 17 throughout August. The Senate closed at 53%, and Texas at 51%. Both remained close to their opening positions, much like a month ago. These contracts do not settle until November 2026. No date-related news touched them, so nothing moved.
There is one contract coming up next week with a date. The Federal Reserve's decision is set for September 16, and Kalshi's contract on this decision opened this week at 45% and closed at 55%. The probability of keeping rates unchanged dropped from 55% to 45%. The two crossed paths during this time.
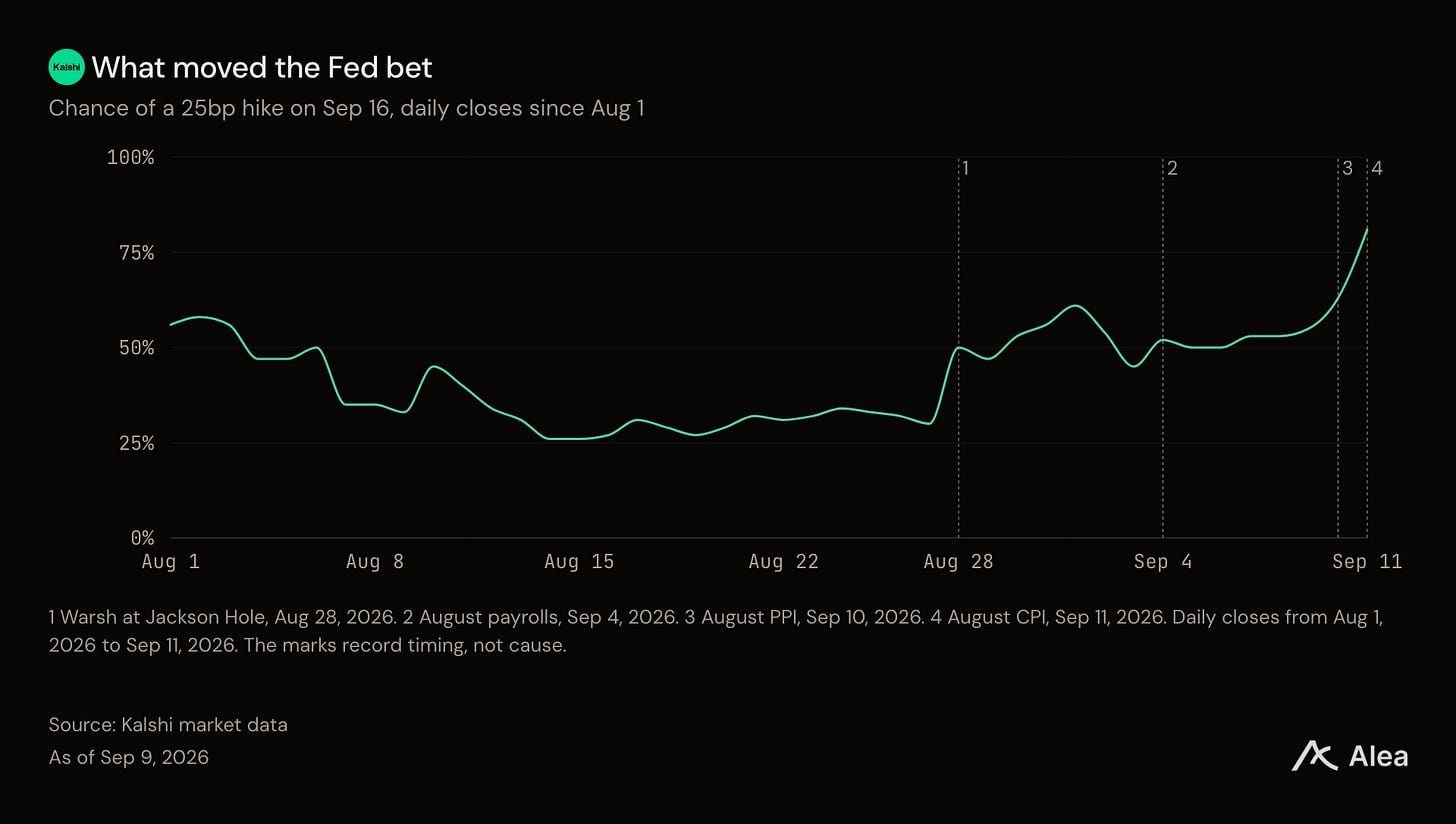
Figure: Daily closing trends for the probability of a 25 basis point rate hike on Kalshi for September 16 (line chart).
It did not remain idle at the weekend close. The producer price index was released on September 10, with the rate hike contracts closing that day at 63%. The consumer price index was released on September 11, with buyers reporting 81% and sellers reporting 82%.
Both data points were energy-driven. The Bureau of Labor Statistics noted that diesel prices rose by 24.1% in August, attributing it to over a third of the increase in producer prices. Gasoline rose by 3.9%, cited as over a third of the monthly consumer increase. Behind all this was crude oil: WTI jumped from $70.56 on June 30 to $97.26 on September 9. Another competitive and simpler explanation is older. Chair Warsh stated during the Jackson Hole meeting on August 28 that the better inflation readings this summer "did not tell me that the underlying trend has materially improved." The contract jumped from 30% to 50% within a single day before this data even existed.
The Election Went Quiet, but the Exchange Became Busier
The exchange's transaction volume increased by 12.3% compared to the previous week. This growth was not evenly distributed.
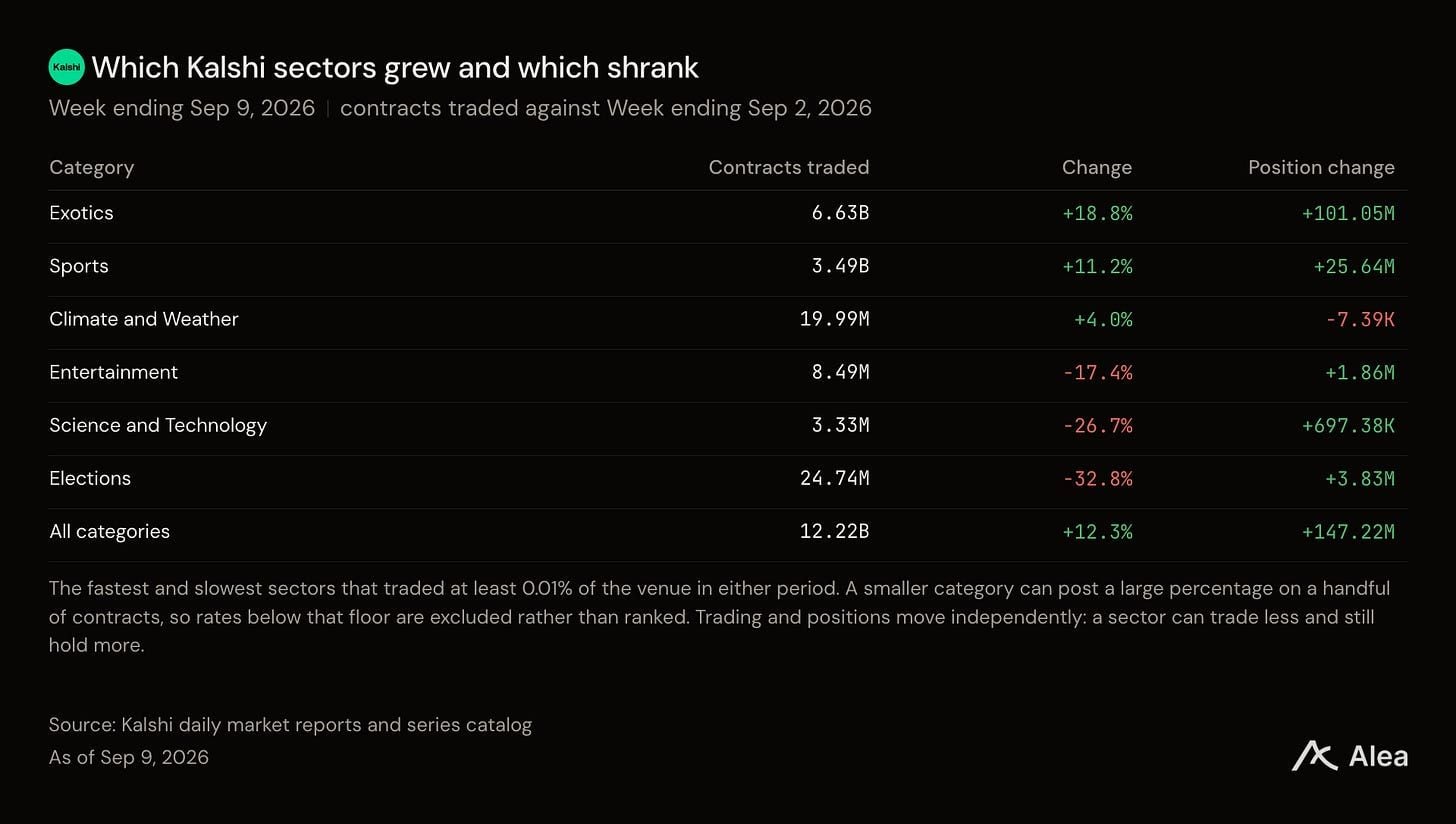
Figure: Kalshi ranked by week-over-week changes in trading volumes across categories (table).
Parlay bets grew by 18.8%, and sports increased by 11.2%, together accounting for 83% of the exchange. Election trading volume decreased by 32.8%. Economic trades fell by 8.8%, yet increased by 8.73 million contracts. The categories bearing predictions became quieter and heavier at the same time, which is how accumulation appears.
One Name, Two Exchanges
There exists a fast Kalshi and a slow Kalshi; every number you read is a sum of the two. The fast one comprises parlay betting and fifteen-minute cryptocurrencies. Here, a parlay is a ticket that bundles different outcomes together, which pays out only if every leg hits. It sells the same thing as sports betting but is listed as event contracts.
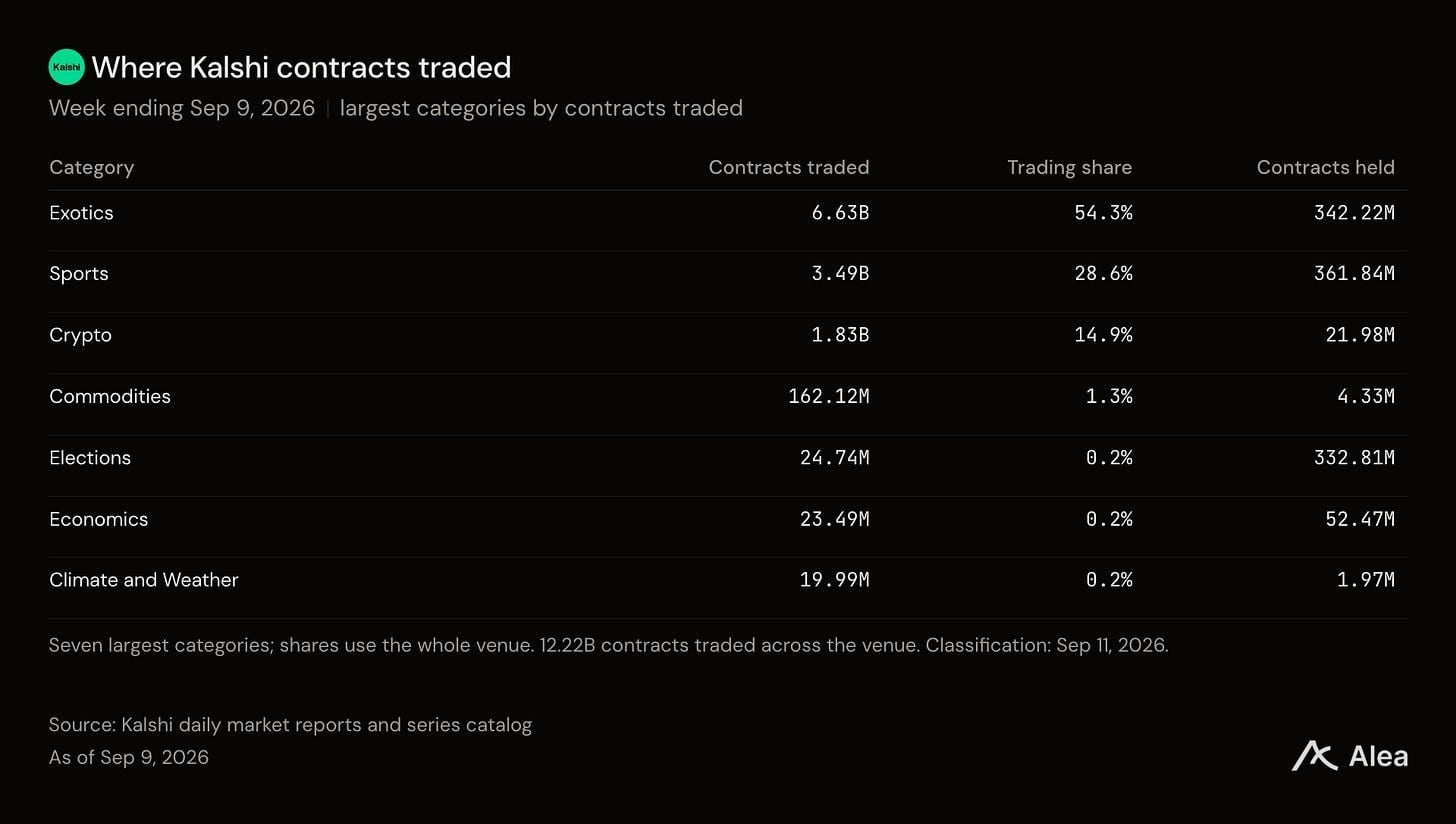
Figure: Kalshi's largest categories ranked by transaction volume (table).
Combination contracts are not simply the product of each leg. The contract for Republicans winning the House trades at 16%, and the contract for Republicans winning the Senate trades at 53%. Multiplying those gives 8.5%. Meanwhile, the contract betting on both trades at 18%, more than double the former, as the market prices both elections as a single bet on the same wave of national sentiment.
Kalshi categorizes parlay betting under Exotics, which accounted for 54.3% of all transaction volume last week. The fifteen-minute Bitcoin market accounted for another 11%. These contracts are born and die within a day. The slower counterpart is the election and economic categories, which accounted for 0.4% of the total transaction volume, yet represented 31% of all open positions at the weekend close.
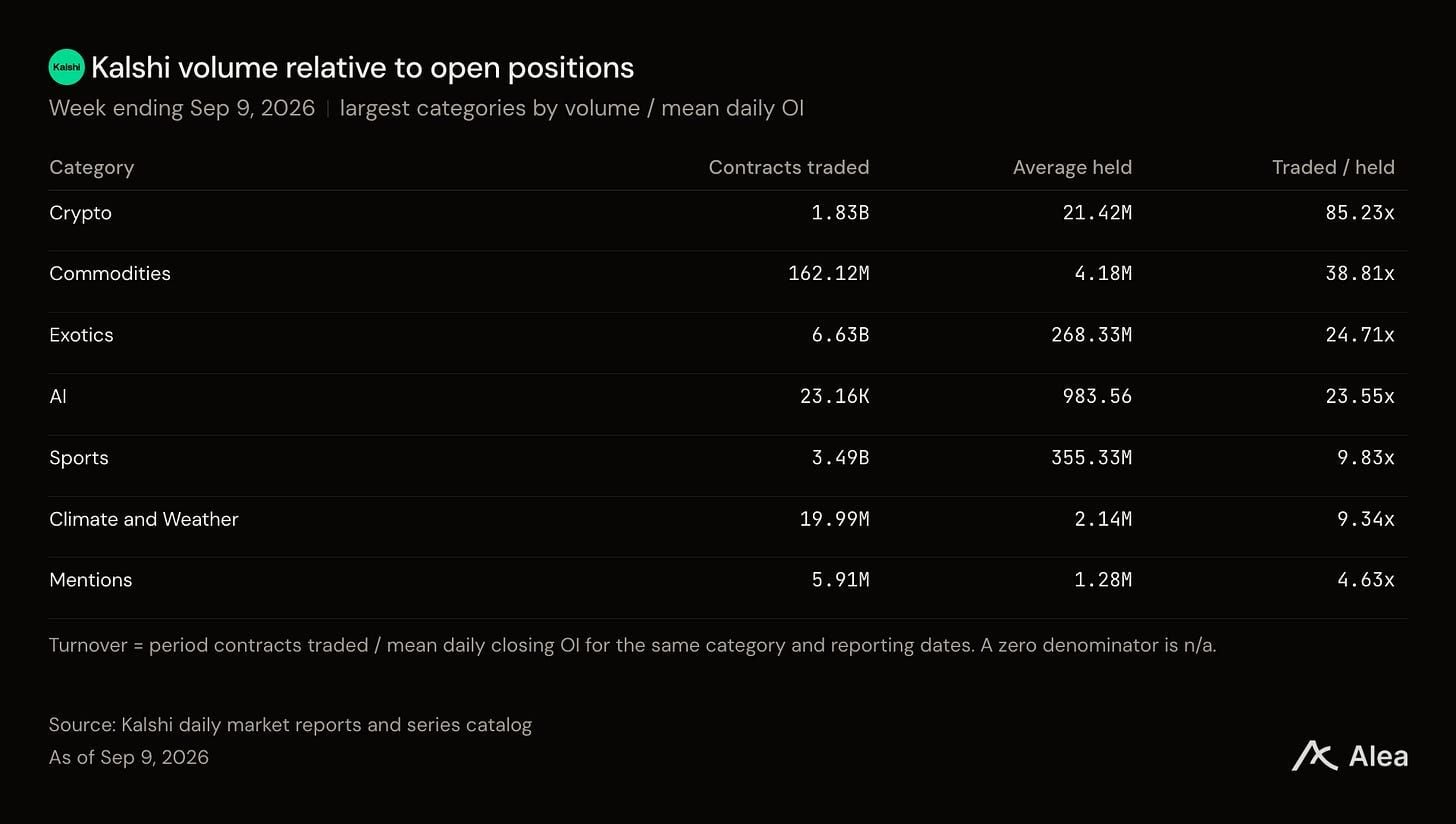
Figure: Kalshi's categories "transaction volume ÷ average open positions" turnover multiples (table).
By dividing transaction volume by open positions, the cryptocurrency turns over 85 times weekly. Parlay betting is 25 times. Elections are 0.1 times. At this rate, the entire election market only turns over about once every ten weeks. People buy into a view on the mid-term elections and then leave it be.
Record-Breaking Open Positions Were Not Driven by Weekend Parlays
Traders added 147 million open positions last week, marking the fourth-largest single-week build in Kalshi's history. The obvious explanation would be the weekend parlay crowd, but that is incorrect.
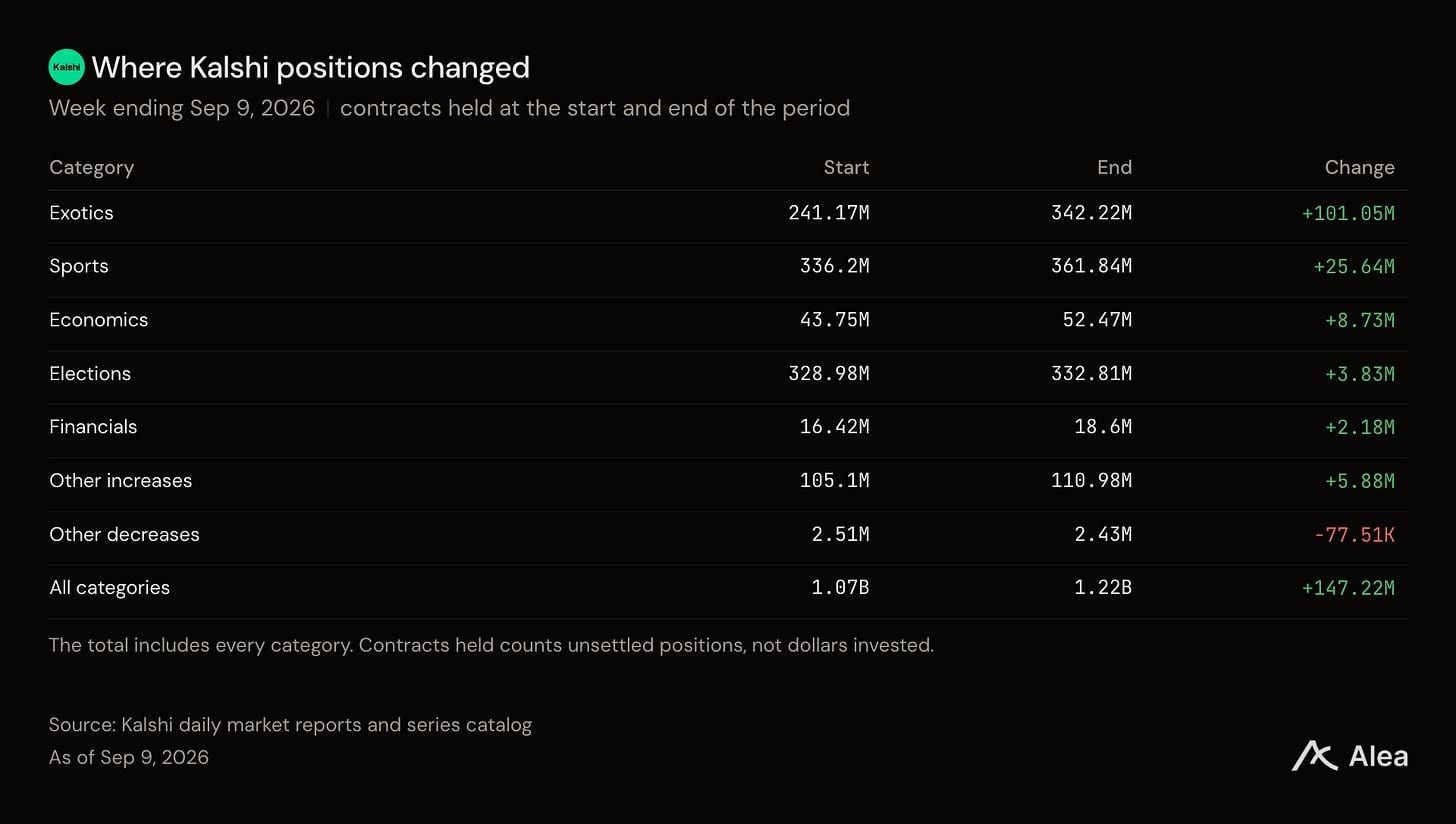
Figure: Comparison of open positions at Kalshi early in the week versus the weekend (table).
Exotics, which is the category where parlay betting is found, added 101 million. Digging a layer deeper, this number splits in half.
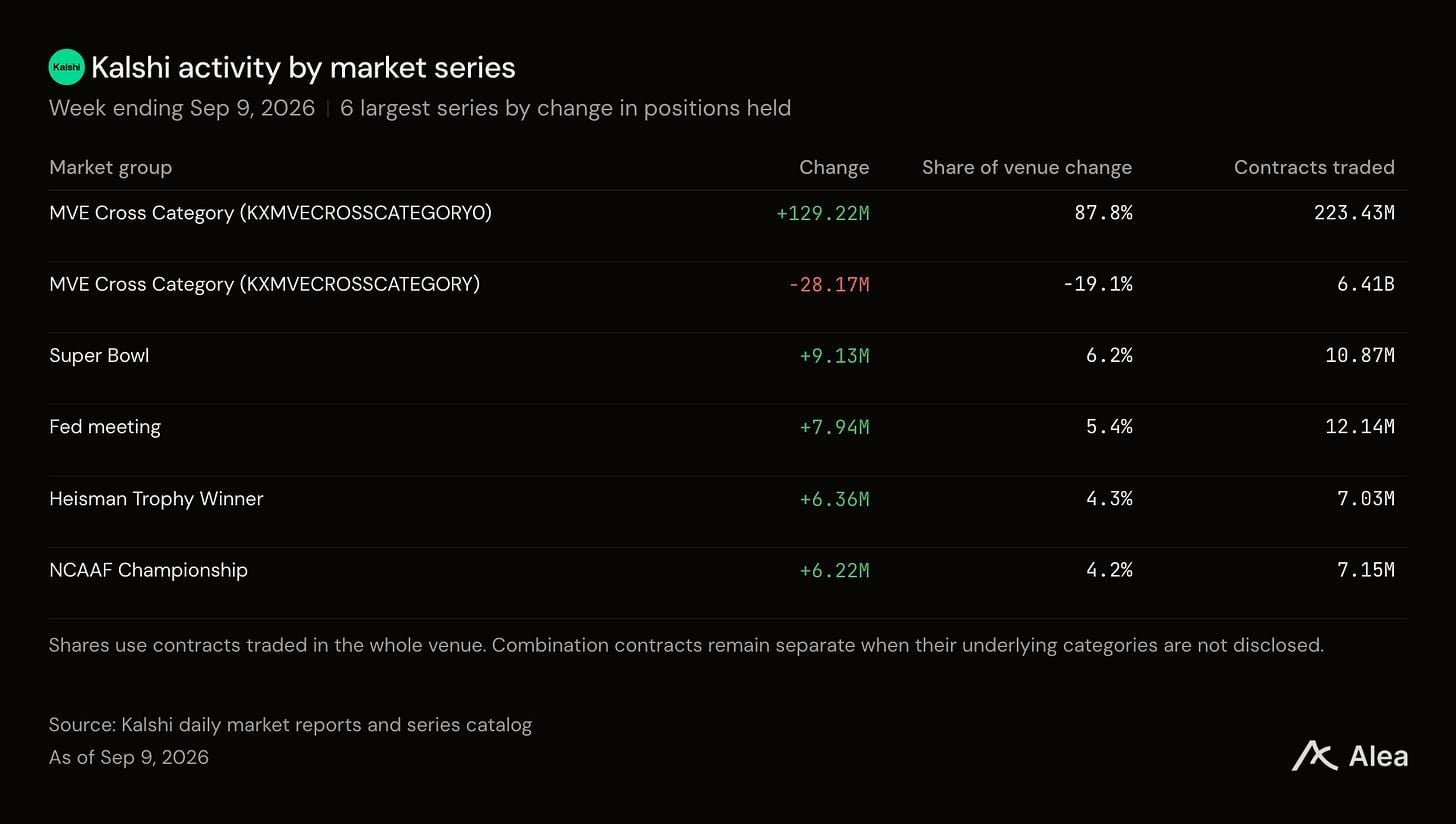
Figure: Market series ranked by changes in open positions on Kalshi (table).
A series of combination contracts traded 6.41 billion contracts, over half of the entire exchange, but closed with 28 million fewer positions than it opened. Another series of combination contracts traded 223 million contracts, which is one twenty-ninth of the first series, yet added 129 million open positions. This second series alone accounted for 88% of the exchange's build last week.
Thus, this record-breaking open position count was not due to a crowd of weekend gamblers. It was a slow product that people bought and held. The majority of the rest came from sports schedules: Super Bowl +9.13 million, Heisman Trophy +6.36 million, College Football Championship +6.22 million.
Dollar and Contract Numbers Are Starting to Diverge
Kalshi reports both numbers simultaneously. Last week, they moved at different speeds, and this gap tells you which type of trading filled the week.
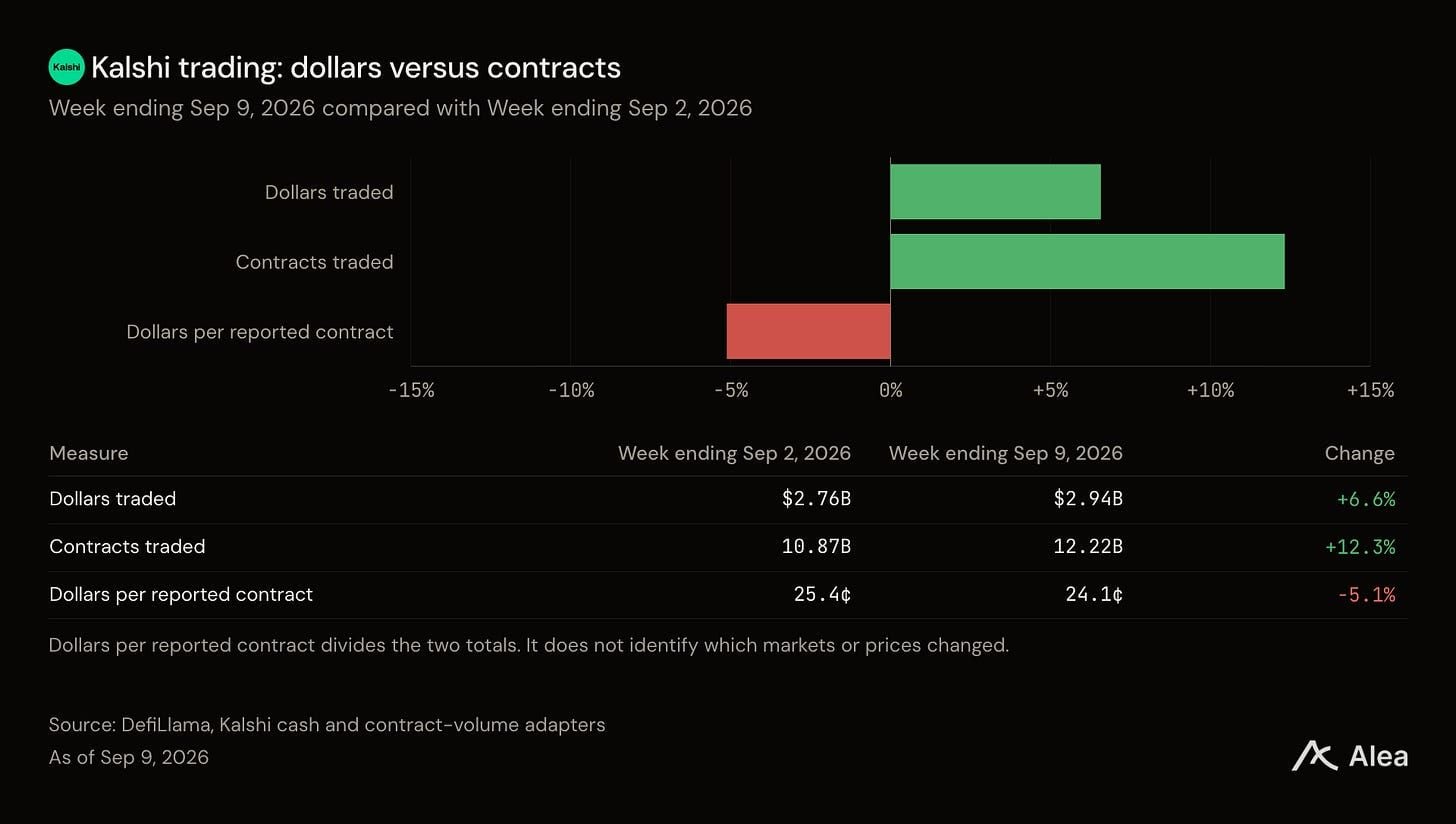
Figure: Comparison of Kalshi's dollar volume, contract volume, and the corresponding dollar amount per contract (bar chart + table).
Dollar volume increased by 6.6%, while contract numbers grew by 12.3%, so the average contract price became cheaper, dropping from 25.4 cents to 24.1 cents. The trading prices of less popular legs were just a few cents. They increased in the number of contracts at a pace far exceeding the dollar volume, which is why contract numbers can paint Kalshi in a better light than dollar volume.
Saturday, September 5, was the biggest day, with a trading volume of $509 million, coinciding with the opening schedule of college football. The slowest day was Monday, September 7, at $346 million. Kalshi's slowest day last week still surpassed its best day a year ago.
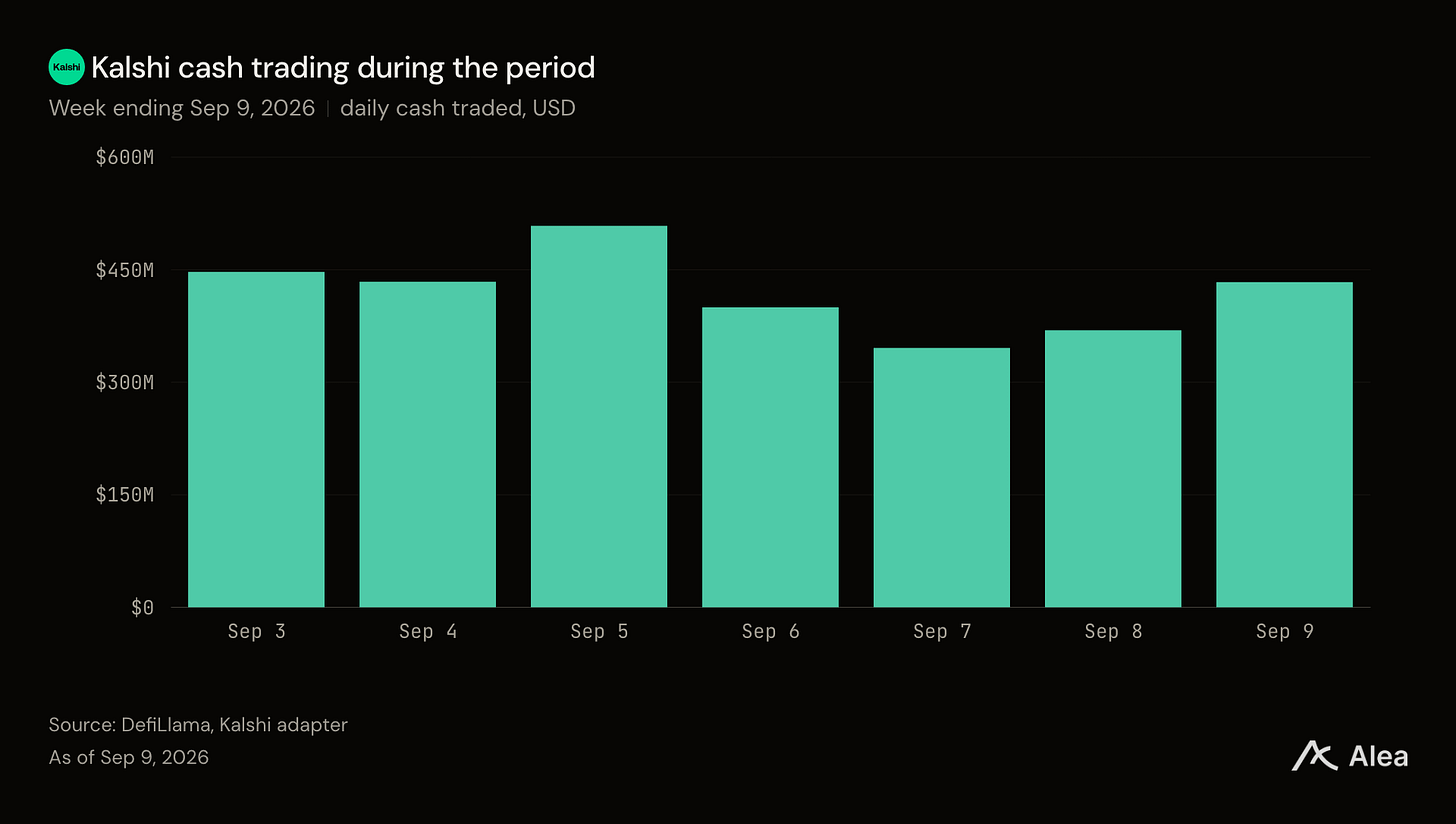
Figure: Kalshi's daily dollar trading volume for the week (bar chart).
Kalshi's event contract fees have a quadratic relationship with prices. Fees are charged based on the expected returns of contracts, peaking around 50 cents and decreasing toward both ends.
Trading Volume of Perpetual Contracts Is 1.8 Times That of Event Contracts
Kalshi also operates perpetual futures: leveraged contracts that track asset prices with no expiration date. It launched the first batch of perpetual contracts in the U.S. on May 29, and the trading volume exceeded $1 billion in the first week.
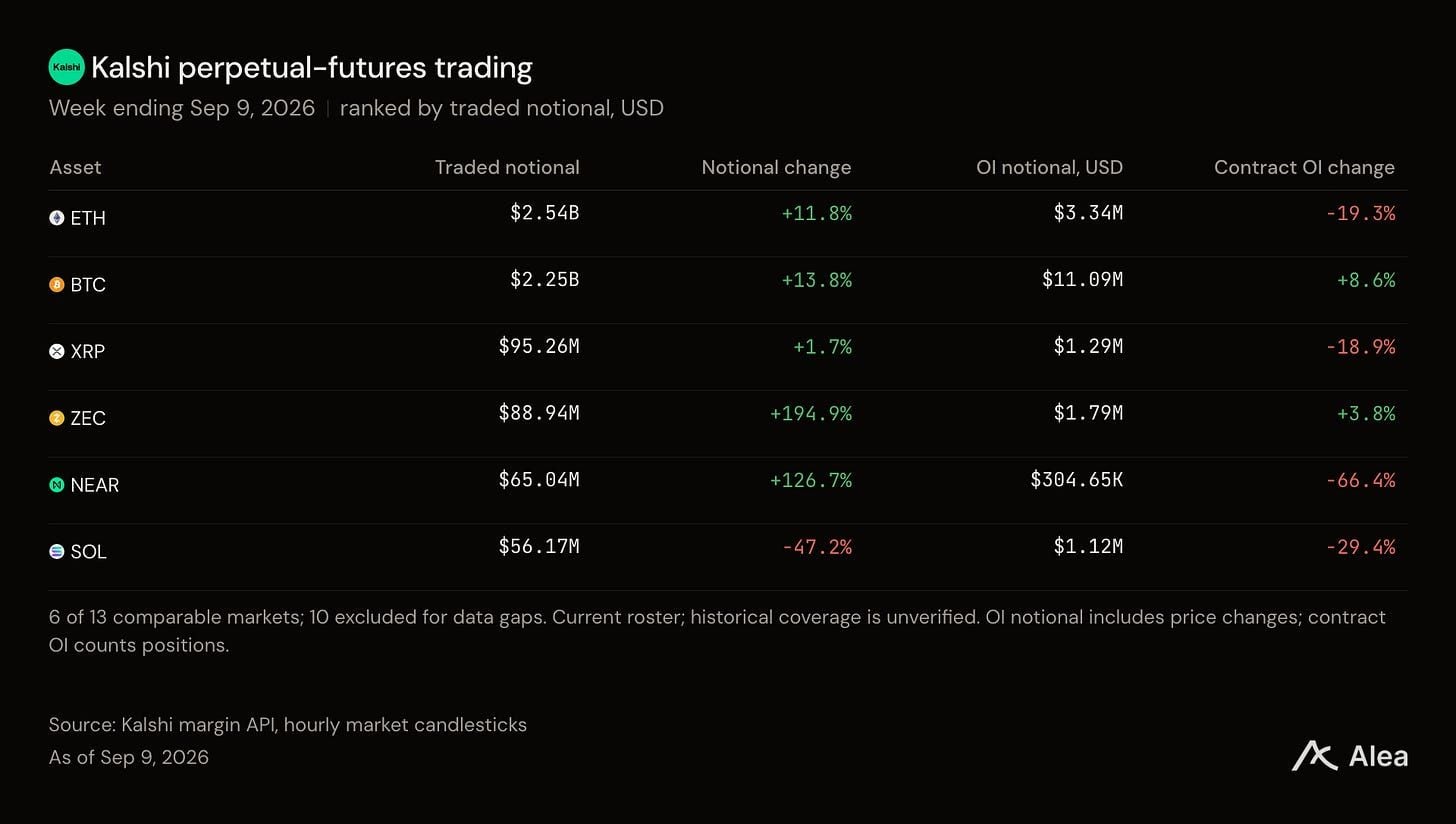
Figure: Kalshi's perpetual futures ranked by nominal trading volume (table, including nominal amounts and changes in open positions).
In the thirteen perpetual markets with a complete history over two weeks, their nominal trading volume reached $5.24 billion, growing by 13.2%; in contrast, the entire event contract exchange had a cash trading volume of $2.94 billion. Bitcoin and Ethereum accounted for 91% of this volume.
What Kalshi Launched This Week
Gold and silver perpetual futures launched on September 10, having been approved by the CFTC, with trading available around the clock. Kalshi's argument is that futures structures "were designed for the physical delivery of wheat and corn." Most participants never want delivery, thus they pay roll-over costs for unnecessary expiration dates. As of this week's close, neither of these contracts has recorded any trades.
The exchange also rolled out an entire series of Champions League contracts, comprising 20 of the 292 series that traded this week but were not traded last week. Five perpetual contracts had no comparable weeks before this week. They collectively traded $59.8 million.
Things to Watch
Four date-specific events, along with one commitment.
On September 16, the Federal Reserve. Contracts show an 81% probability of rate hikes. This is the first scoreable calibration test: an 81% that misses carries more weight than one that hits.
On September 16, metal cost sheets. They will take effect at the day's close. Gold and silver have not traded since their launch on September 10. Watch to see if they begin trading.
Next week, football contract books. Among the twelve largest open positions set for next week’s settlement, each is a football parlay, with ten priced below 3%. Watch if the contract books continue to grow after the opening weekend of football.
On October 14, the next CPI. The chain pushing the Federal Reserve contracts passed through energy. If crude oil holds near $97, the next data set will bring similar momentum.
We are recording prices for every market settling between September 11 and September 18 for this week. Next week we will let you know how the public performed.
免责声明:本文章仅代表作者个人观点,不代表本平台的立场和观点。本文章仅供信息分享,不构成对任何人的任何投资建议。用户与作者之间的任何争议,与本平台无关。如网页中刊载的文章或图片涉及侵权,请提供相关的权利证明和身份证明发送邮件到support@aicoin.com,本平台相关工作人员将会进行核查。


