Author: Glassnode
Translation: Deep Tides TechFlow
Deep Tides Overview: Glassnode's latest Market Compass has dropped 3 points to 23/100, entering the defensive zone; the macro score has fallen 8 points to 31, with the dollar index returning to the 200-day moving average, and three weeks of macro recovery have been wiped out in one night. The on-chain fundamentals have risen to 52, which is the best reading of this round; however, the waves of all assets rising together at the end of August have faded, and profit-taking during Bitcoin's rebound has been quite aggressive.
The comprehensive score has dropped another 3 points to 23/100 (defensive), which is 2 points lower than a week ago and 5 points lower than a month ago. The macro score has fallen 8 points to 31/100 in one week, coinciding with the dollar index returning to around the 200-day moving average, re-entering the "tightening" side—three weeks of macro recovery have been retraced in one trading day. The on-chain fundamentals have risen to 52, which is the best reading of this round; capital flows, cycle positions, and investor behavior have remained almost unchanged. What moved was one lens, but it affected the entire market.
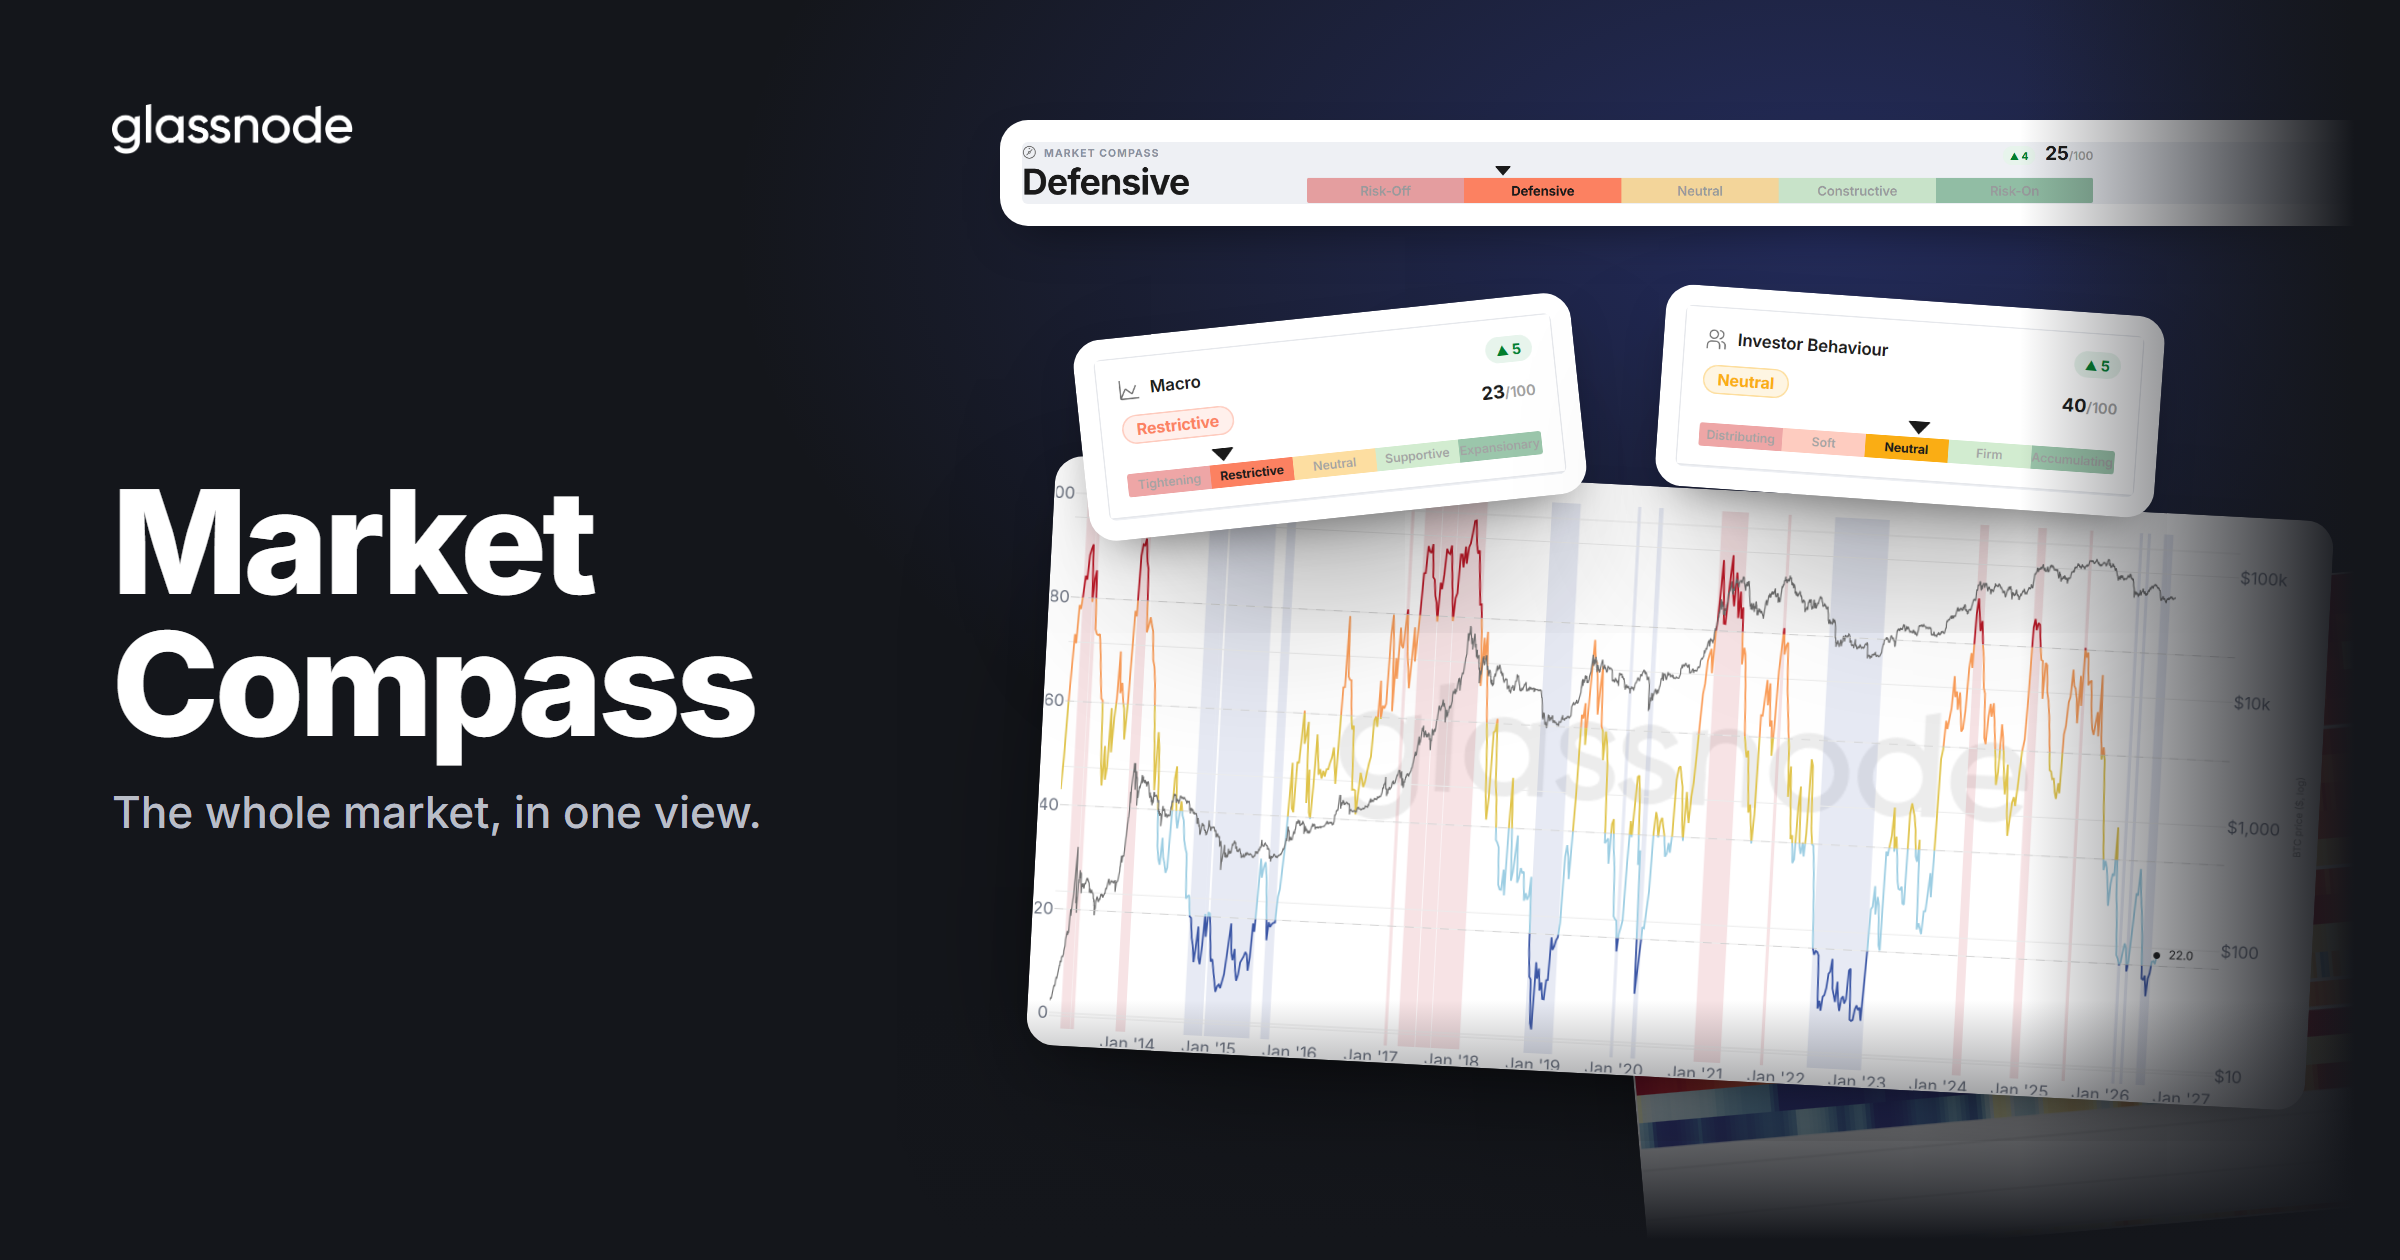
Under the title, there are two charts supporting this issue's story: how "synchronized" the market was at the end of August, and who sold their holdings during the rebound.
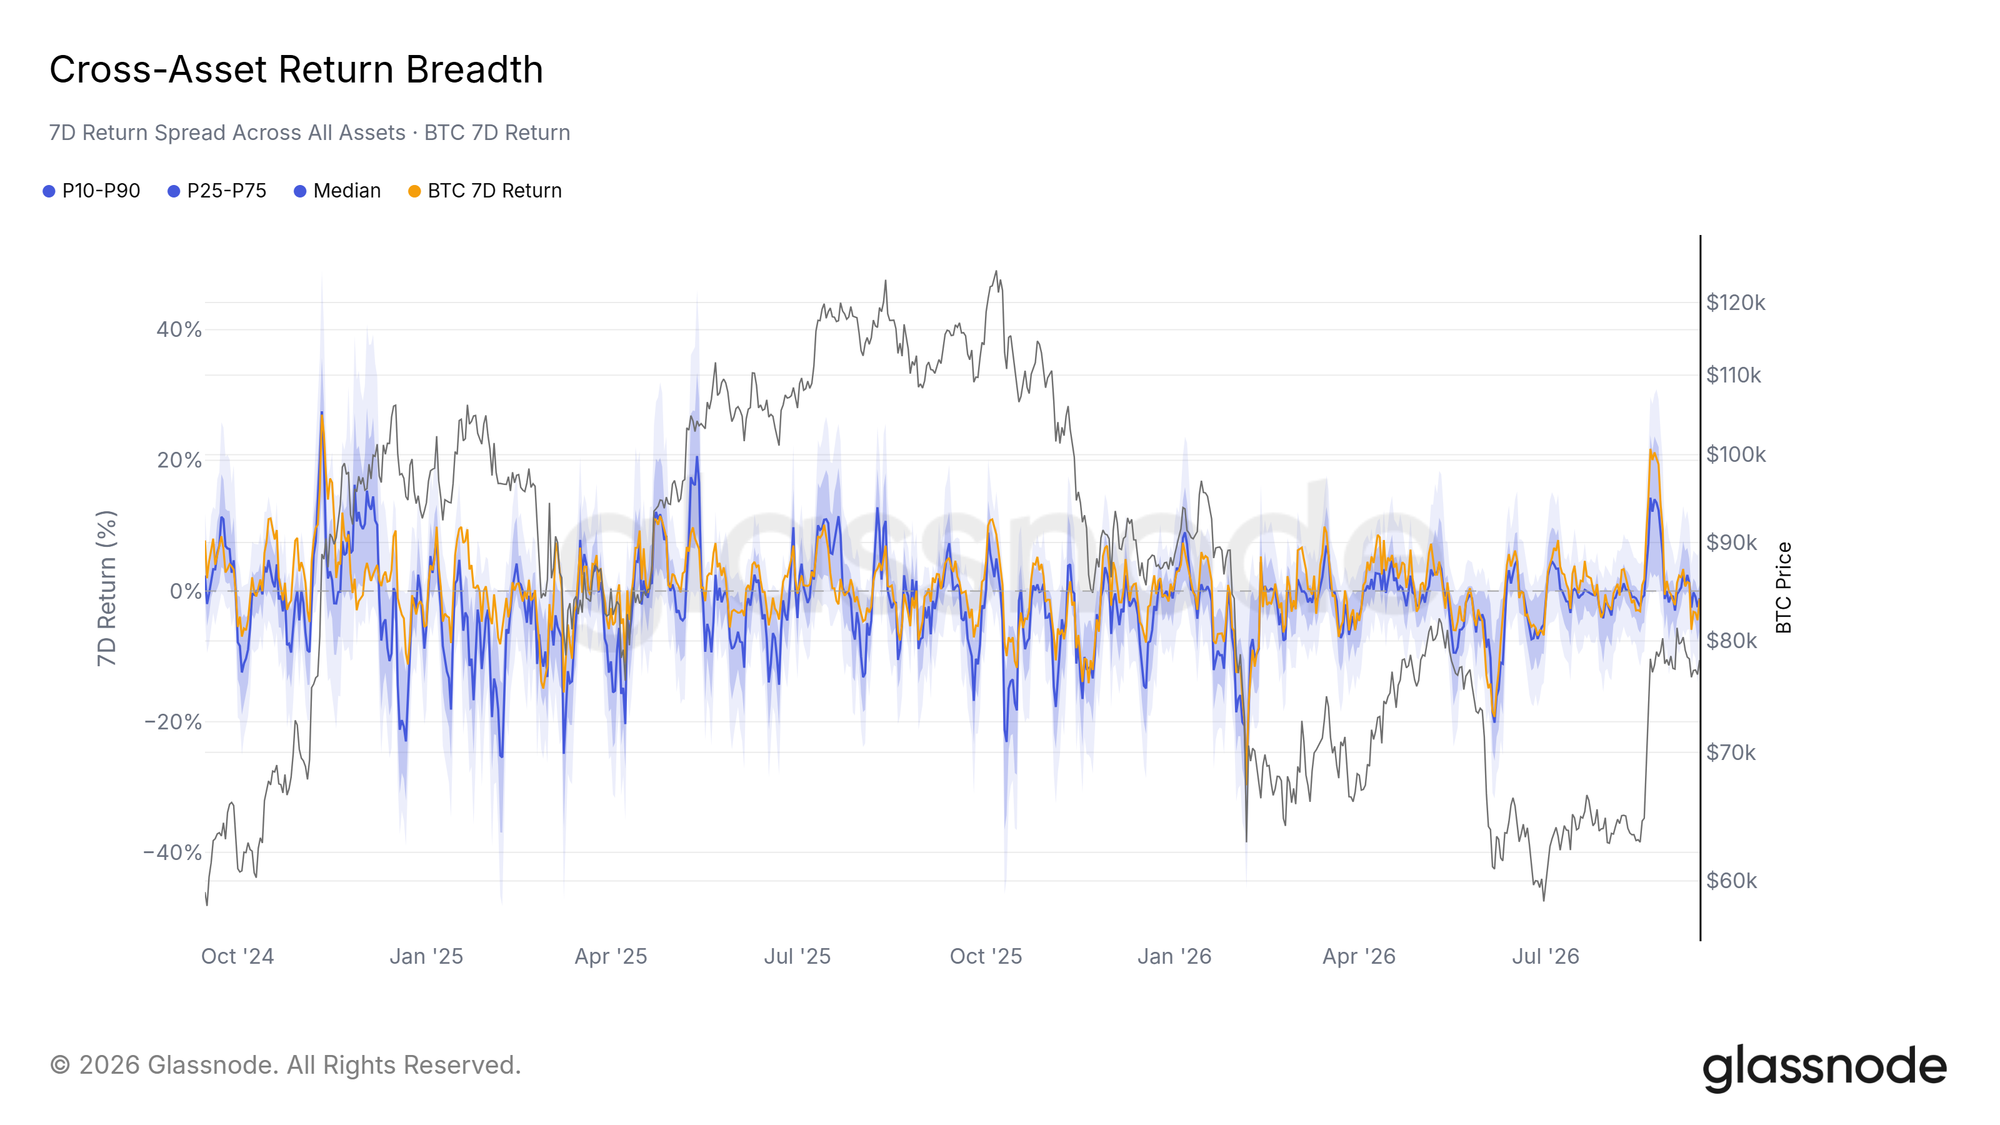
At the end of August, almost all assets surged together, marking the largest wave of cross-asset synchronized increases this year: the Altcoin Season Index returned to 75, with mid-cap coins leading the thirty-day list. This large-scale, simultaneous surge has historically been more like a risk zone rather than the start of a sustainable upward trend. This outburst has faded: the median seven-day returns of various assets have returned close to zero, and the index briefly touched but then lost the boundary line of the altcoin season.
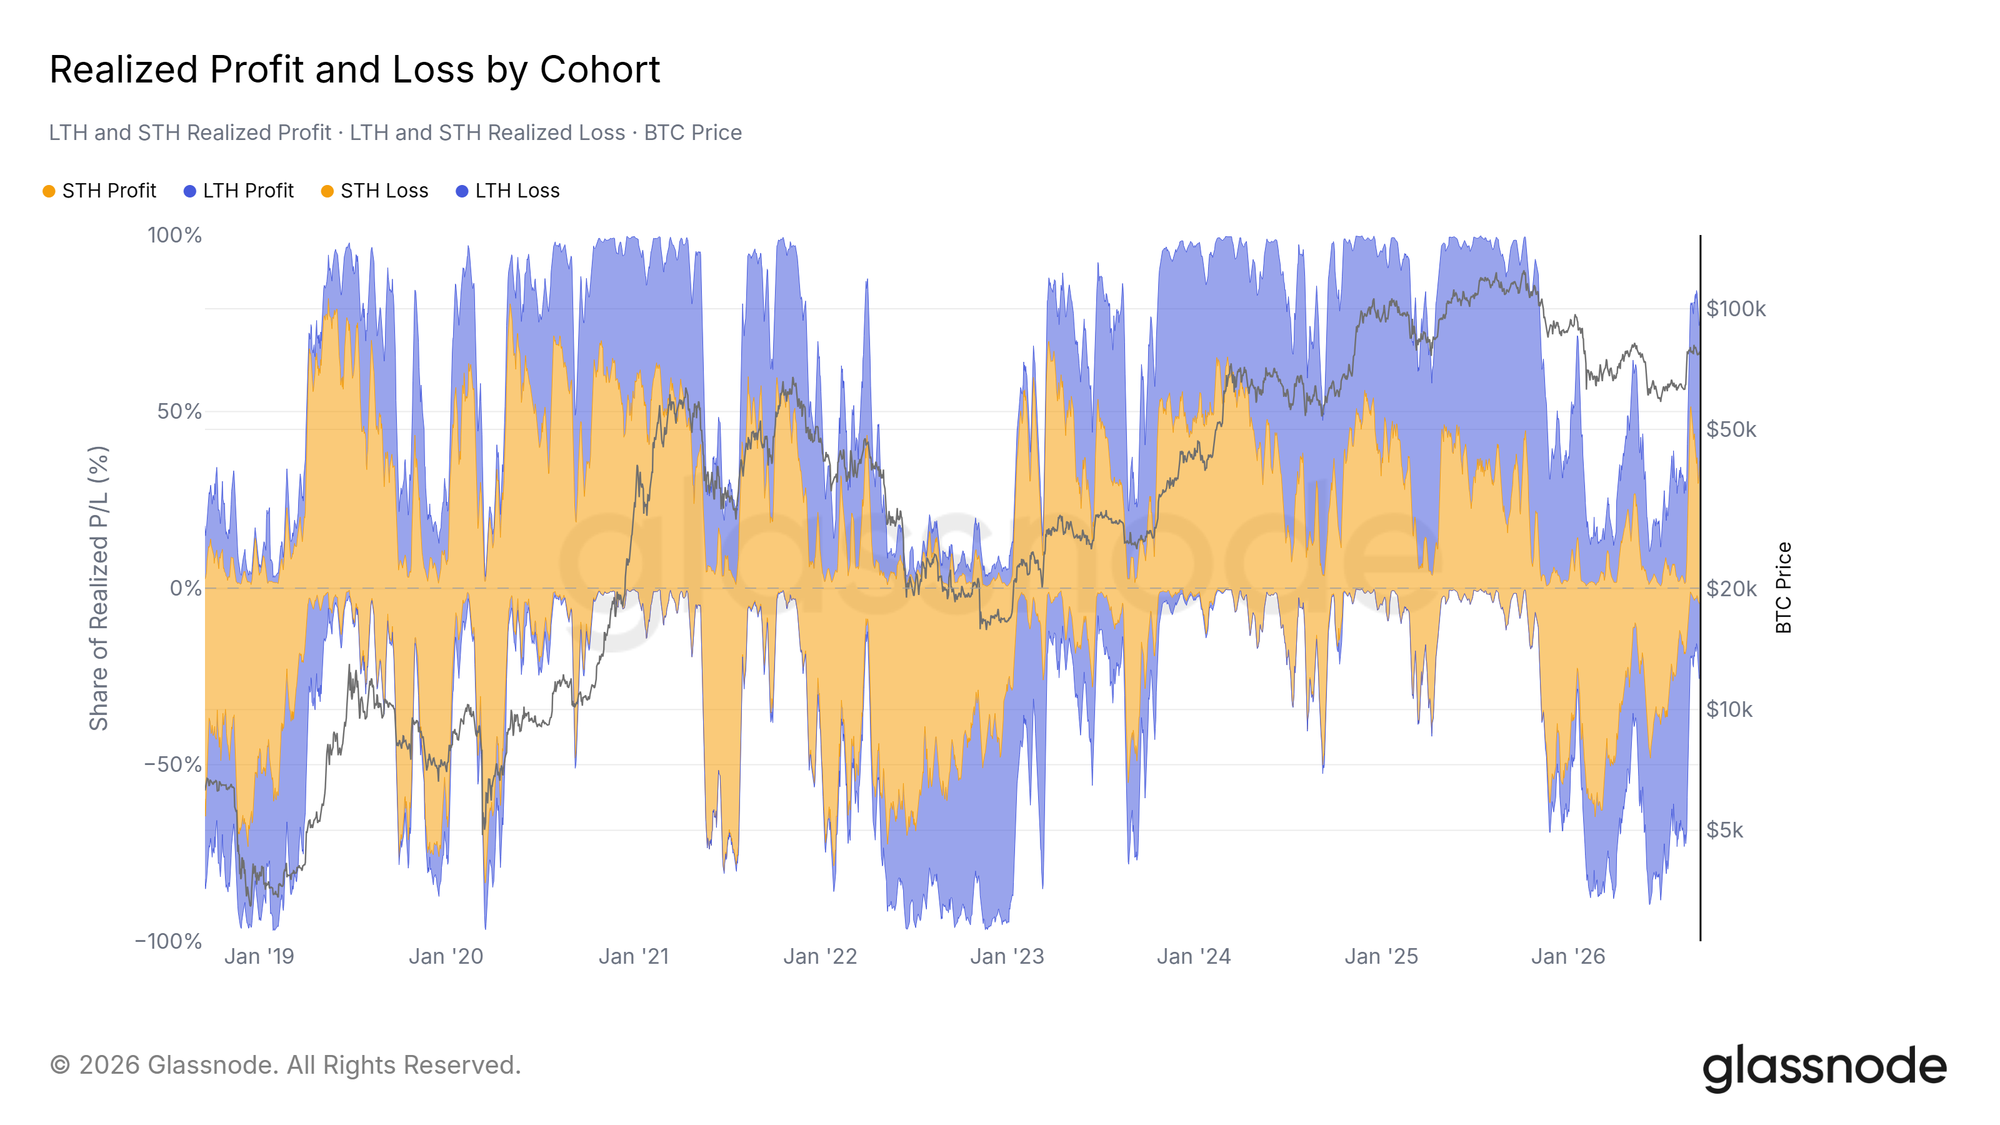
Bitcoin rebounded to about 47% premium over its realized price, yet holders behind it took advantage of the rebound to sell. Over the past three weeks, realized capital flows have shifted from predominantly losses to predominantly profits, with long and short-term holders approximately even, while the losing side has contracted to only a small portion of the flow. The realized profit and loss ratio has reached a new high for this round, reported at 2.63. Such one-sided profit-taking is a common sight in the charts during the uptrends of 2024 and 2025; the kind of pullback expected from the cycle lens has yet to begin.
What could turn the tables: If the dollar closes firmly above the 200-day moving average, it would confirm a macro reversal and continue to drag the comprehensive score down; if investor behavior finally turns upward, it could hedge against this.
免责声明:本文章仅代表作者个人观点,不代表本平台的立场和观点。本文章仅供信息分享,不构成对任何人的任何投资建议。用户与作者之间的任何争议,与本平台无关。如网页中刊载的文章或图片涉及侵权,请提供相关的权利证明和身份证明发送邮件到support@aicoin.com,本平台相关工作人员将会进行核查。


