Cryptocurrency Scholar: On September 16, Bitcoin (BTC) is experiencing high-level fluctuations and games, is this a turning point for bulls and bears under the Fibonacci structure? Latest market analysis and operational advice.
The current price of Bitcoin is 76400, and it is in a high-level fluctuation market. The worst thing is to frequently place orders back and forth. I have already entered a long position at 76000 and strictly set stop-losses. There is no fantasy that the market will directly reach new highs. In a fluctuating market, it is difficult to achieve a particularly favorable risk-reward ratio, so the position must not be heavy. Don’t panic and close positions at small fluctuations, and don’t stubbornly hold on when there are losses. The essence of trading is to manage risks well and profit from market trends that you understand. The market will not always move according to our predictions, and I am prepared to recognize mistakes and exit at any time.
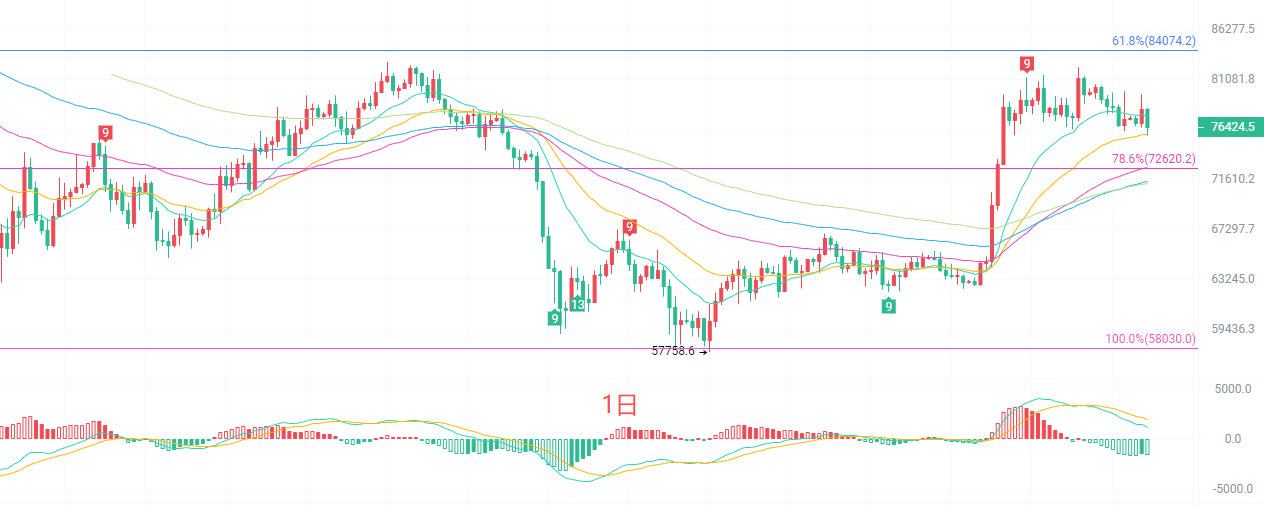
The daily K-line has just landed in the Fibonacci 78.6% support area above 72620. In the moving average system, the short-term EMA15 and EMA30 are intertwined, and bullish momentum is starting to weaken. The red bars of the MACD indicator are continuously shrinking, and the DIF is turning downward, indicating that bullish strength is gradually diminishing. The Bollinger Bands are narrowing, and prices have retreated to the middle band, indicating that the daily level is shifting from strong upward to high-level fluctuating patterns. Strong resistance above looks at the previous high point area, while the key support below is 72620. If the daily line effectively falls below this level, the structure of this rebound will be destroyed, and the probability of the market undergoing a deeper correction is high.
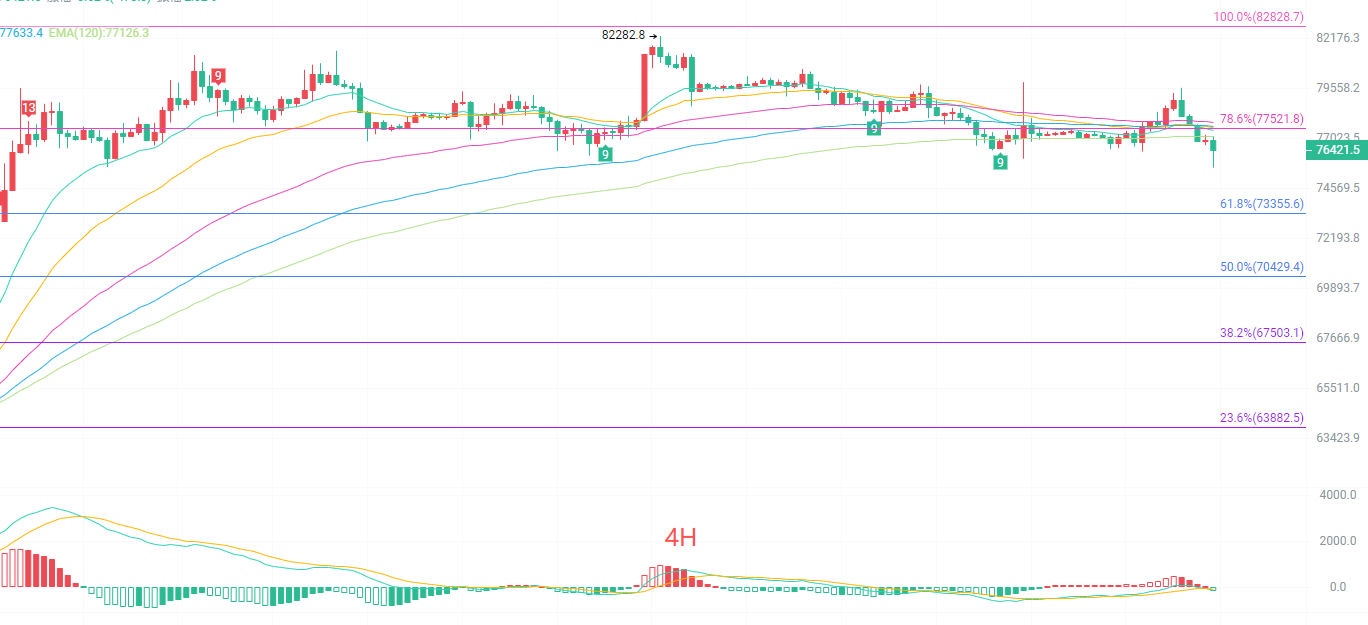
The four-hour K-line has retreated from highs and is under pressure near the Fibonacci 78.6% position at 77521. The short-term EMA moving average group has started to flatten, and the bullish trend is slowing down. The MACD DIF has crossed below the DEA, and the green bars are continuously expanding, indicating that short-term bearish strength is being released. The Bollinger Bands are narrowing in opening, and prices are running below the middle band. A short-term adjustment structure has entered; rebounds are resistance, and only by re-establishing above 77521 can the short-term weak pattern be reversed; otherwise, it will continue to test the support below.
Short-term Reference
Long up from 76000 to 75500, stop loss 500 points, target looking at 77500 to 78600.
Short down from 77500 to 77800, stop loss 500 points, target looking at 77000 to 76000.
Specific operations should mainly rely on real-time data from the market; for more information, you can consult the author. The publication of this article has a delay, and the advice is for reference only at your own risk.

Warm reminder: The content above is solely created by the author of the public account; the advertisements at the end of the article and in the comment area are not related to the author. Please distinguish carefully, thank you for reading.
免责声明:本文章仅代表作者个人观点,不代表本平台的立场和观点。本文章仅供信息分享,不构成对任何人的任何投资建议。用户与作者之间的任何争议,与本平台无关。如网页中刊载的文章或图片涉及侵权,请提供相关的权利证明和身份证明发送邮件到support@aicoin.com,本平台相关工作人员将会进行核查。