Cryptocurrency Circle Academician: On September 16, signals of breaking the high-level box pattern of Ethereum (ETH) have emerged. Is the pullback to wash out positions hiding a trend choice? Latest market analysis reference.
The current price of Ethereum is 2425, and the 2400 area has already been traded. Now just be patient and hold it. The biggest taboo in trading is to frequently watch the market after opening a position; a small fluctuation can cause panic. The market will not rise straight up; after peaking, there will inevitably be a pullback and position washing. This wave of retracement is a test of support strength. In trading, predicting the market is only part of it; managing positions and sticking to stop losses is the hardest part. Don't fantasize that every single trade will be profitable; accept reasonable losses and earn money within your understanding. The market always has opportunities; as long as the capital is still there, there will always be another chance to enter.
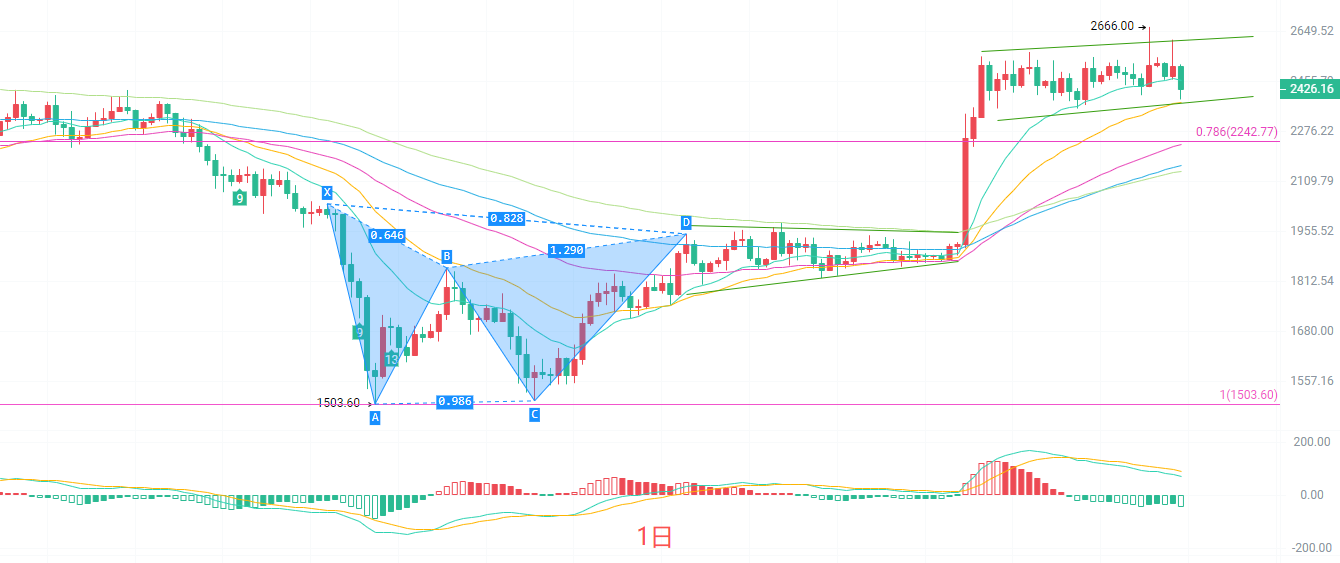
The daily K-line still maintains its position within the high box range of this round of price increase, without a complete breakout. The EMA moving average group is still in a bullish arrangement, and the short-term moving average is still supporting the price from below. The MACD indicator's red columns are significantly shrinking, with the DIF turning down. The bullish momentum has weakened, which is a normal pullback after a rise. The upper Bollinger band is under pressure and retracing, with the current price close to the middle Bollinger band. The key support is at 2242, and the upper pressure is at 2580. On the daily chart, it is in a consolidation adjustment phase within a bullish trend; the trend has not directly reversed, but the short-term bullish strength has weakened, so mindless chasing longs is not advisable.
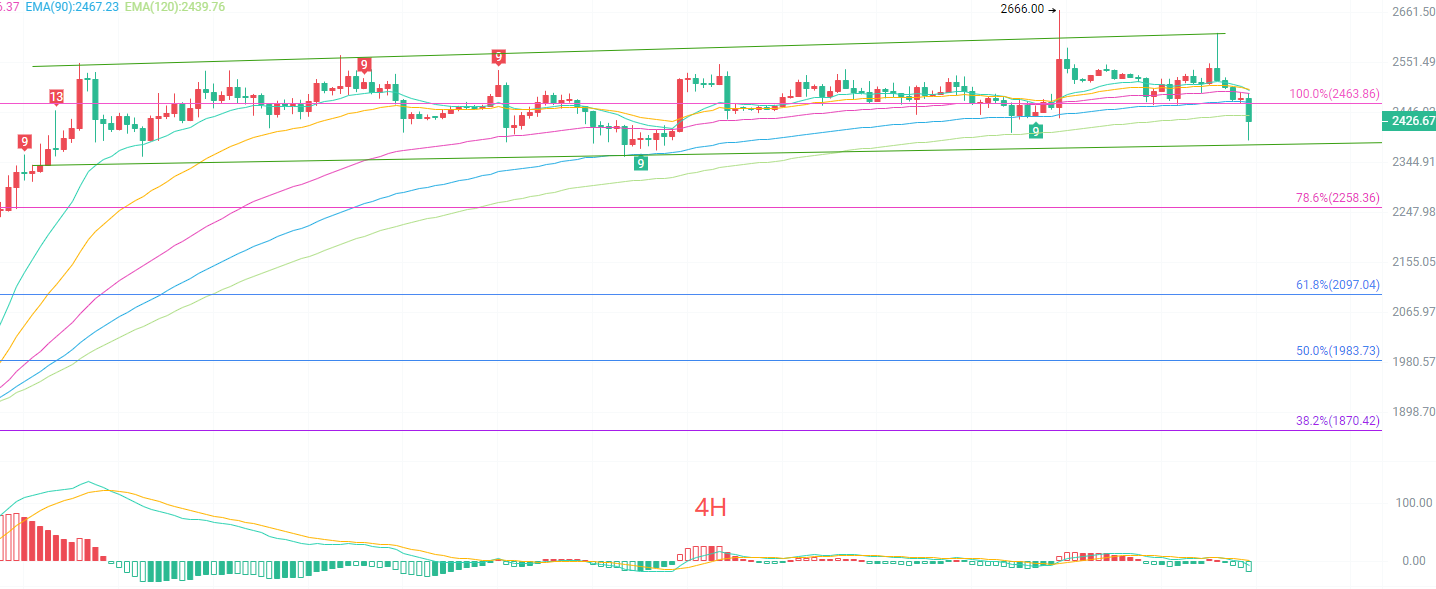
The four-hour K-line is pulling back to the previous box's upper support. The short-term EMA moving averages have begun to turn down, and the EMA 15 and 30 have already formed resistance. The MACD's DIF has crossed below the DEA, with the short-term bearish strength taking the lead. The Bollinger band is narrowing, with prices approaching the middle band; the lower band supports around 2451. The Fibonacci 100% level at 2463 has been broken down, indicating a loosening of the short-term bullish structure. This is a short-term retracement trend; near-term resistance is at 2463, with the first support at 2388. If support fails, there will be further exploration down to the 2258 level.
Short-term reference:
If the lower range of 2400 to 2370 holds, aim upwards with a stop loss of 40 points, targeting 2460 to 2520.
If the upper range of 2480 to 2520 holds, aim downwards with a stop loss of 40 points, targeting 2450 to 2410.
Specific operations should be based on real-time market data. For more information and details, you can consult the author. There may be a delay in the article's release; the suggestions are for reference only, and the risk is to be borne by yourself.

Warm reminder: The above content is solely created by the author of the public account. The advertisements at the end of the article and in the comments are unrelated to the author. Please discern carefully, and thank you for reading.
免责声明:本文章仅代表作者个人观点,不代表本平台的立场和观点。本文章仅供信息分享,不构成对任何人的任何投资建议。用户与作者之间的任何争议,与本平台无关。如网页中刊载的文章或图片涉及侵权,请提供相关的权利证明和身份证明发送邮件到support@aicoin.com,本平台相关工作人员将会进行核查。