Cryptocurrency Expert: The Ethereum (ETH) pullback on 9.17 is not the endpoint; key support determines the market direction? Latest market analysis reference
The current price of Ethereum is 2425. From the current situation, after the bulls pushed up, profit-taking concentrated and prices quickly retraced. The market's long-short battle has become extremely fierce. The larger trend has not completely reversed, but the short-term bearish strength has the upper hand. Do not blindly increase your position based on feelings; every transaction must have good risk control. Do not sing the market down, instead, find positions at bottom support to make the necessary trades, with small stop-loss and big space.
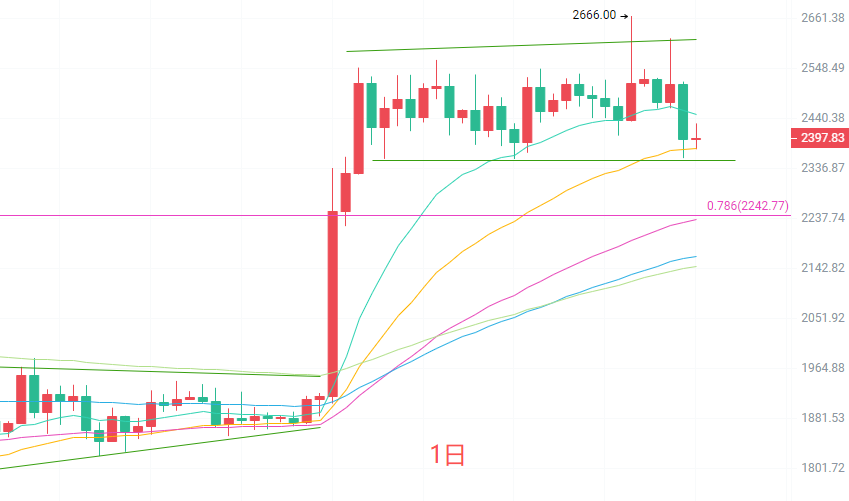
The daily K-line rose and then fell back, closing on a bearish line. The price has broken below the short-term EMA15 moving average. The MACD red bars are continuously shrinking, indicating weakening bullish momentum, and the Bollinger Bands price is beginning to move towards the lower band. The Fibonacci 0.786 position at 2242 is the key support below. The overall large trend still maintains a bullish structure, but the short term has entered a correction phase. The resistance above is at 2447; if it cannot re-establish itself at this position, the pullback trend is likely to continue. If the 2242 support is maintained, there is still a chance to initiate a rebound again.
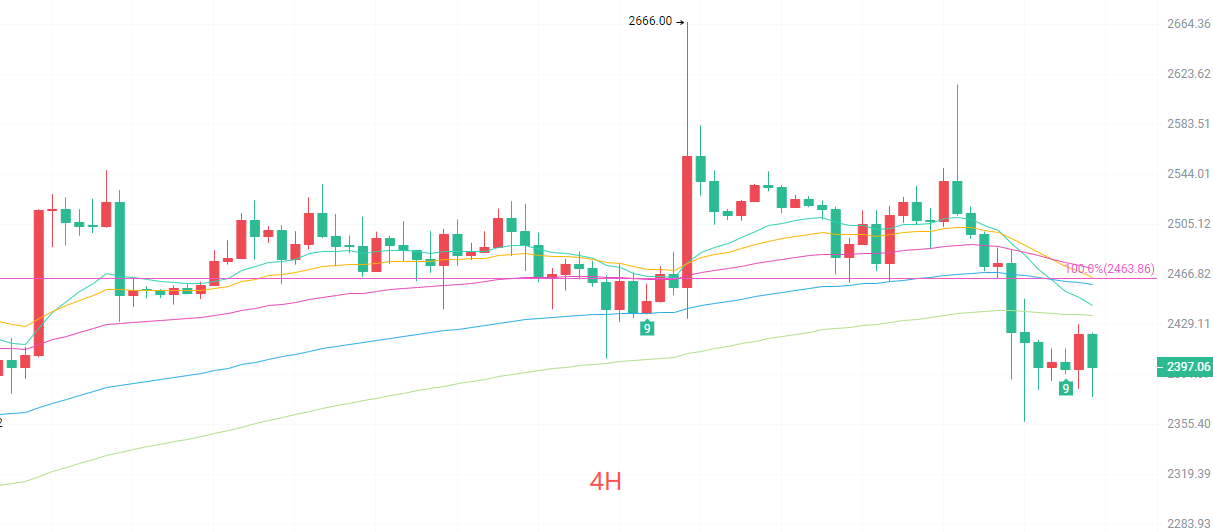
The four-hour K-line has continuously declined from the 2666 high, already breaking below the EMA15 and EMA30 short-term moving averages, with the moving averages shifting from support to resistance. The MACD is turning down above the zero axis, with green bars continuously expanding, releasing bearish strength. The Bollinger Bands are opening downwards, and the price is operating near the lower Bollinger Band. The Fibonacci 78.6% position at 2258 is an important defense level below. The short term is in a weak pullback trend, and the rebound is most likely a corrective rebound; the strong resistance level above is at 2463, making it easy to face resistance and fall back again when rebounding to this level.
Short-term reference:
If the price breaks upwards from 2360 to 2320, set a stop-loss at 40 points, targeting 2400 to 2430.
If the price does not break downward from 2440 to 2480, set a stop-loss at 40 points, targeting 2400 to 2370.
Specific operations should be based on real-time market data. For more detailed information, please consult the author. Articles may be published with delays; this is for reference only, and risks are borne by the reader.

Reminder: The above content is solely created by the author of the public account; advertisements at the end of the article and in the comments section are unrelated to the author. Please discern carefully, and thank you for reading.
免责声明:本文章仅代表作者个人观点,不代表本平台的立场和观点。本文章仅供信息分享,不构成对任何人的任何投资建议。用户与作者之间的任何争议,与本平台无关。如网页中刊载的文章或图片涉及侵权,请提供相关的权利证明和身份证明发送邮件到support@aicoin.com,本平台相关工作人员将会进行核查。