Cryptocurrency Scholar: The major bullish framework for Bitcoin (BTC) at 9.17 has not yet broken, is this round of high-level consolidation a build-up of strength or a top? Latest market analysis and operational advice explained
The current price of Bitcoin is 76400, and the long-short game has become very tense. Many people missed out earlier and are now afraid of chasing highs and getting stuck, while those wanting to buy the dip are worried about deeper corrections. After a big bullish candle, there was no direct continuation of the bullish trend, and the price started to oscillate sideways, washing out weak hands. Short-term capital is in a tug-of-war, with a single candle able to change short-term sentiment, while we are again positioning for an upward move below 76000. Currently, there is a panic sentiment at the bottom of this range. Everyone singing a bearish tune is our opportunity to position ourselves
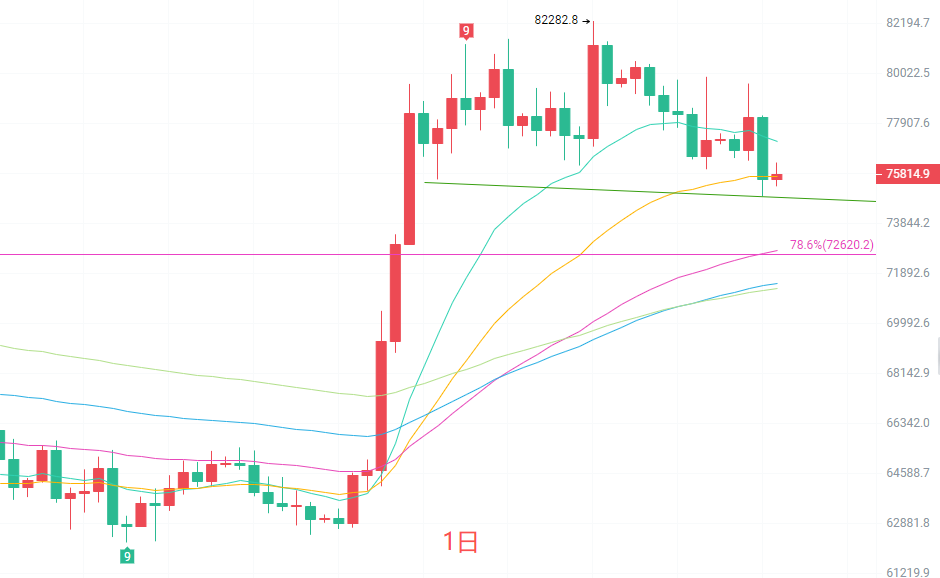
The daily K-line is still within this upward trend. The short-term EMA moving averages are still aligned upwards, and the medium to long-term bullish structure has not been damaged. The MACD indicator's red bars continue to shrink, and the DIF has started to turn down, gradually weakening bullish momentum. The middle band of the Bollinger Band offers strong support, with upper resistance around 78034. The daily level is in a corrective upward oscillation after a rise, not a trend reversal. Strong resistance above is at 80472, and key support below is 72620. As long as the support holds, the major bullish pattern remains intact
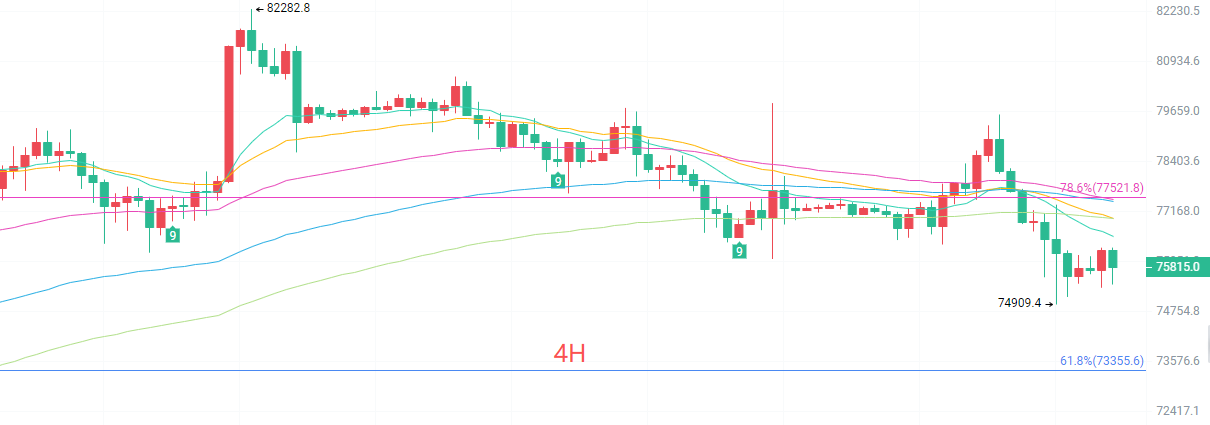
The four-hour K-line trend provides a clearer view of short-term speculation. The short-term EMA moving averages have flattened and are no longer diverging upwards, indicating a significant slowdown in upward momentum. The MACD dual lines continue to decline, with green bars slightly expanding, indicating an increase in short-term bearish power. The Bollinger Band is tightening, signaling that the market is about to choose a direction. Resistance above is at 77521, and the first support below is at 73355. We have entered a consolidation range, with neither side having a complete advantage, so the short-term approach should focus on range-bound trading. Either position with me at the market price or wait for a breakout to follow the trend
Next steps for short-term reference
Buying from 73600 to 73100, with a stop loss of 500 points, targeting 77500 to 80400
Selling from 77500 to 77800, with a stop loss of 500 points, targeting 77000 to 76000
Specific operations should be based on real-time market data. For more detailed information, please consult the author. There may be a delay in article publication, and it is advised for reference purposes only, with risk taken by the reader

Warm reminder: The above content is solely created by the author of this public account. The advertisements at the end of the article and in the comments section are unrelated to the author. Please discern carefully, and thank you for reading
免责声明:本文章仅代表作者个人观点,不代表本平台的立场和观点。本文章仅供信息分享,不构成对任何人的任何投资建议。用户与作者之间的任何争议,与本平台无关。如网页中刊载的文章或图片涉及侵权,请提供相关的权利证明和身份证明发送邮件到support@aicoin.com,本平台相关工作人员将会进行核查。