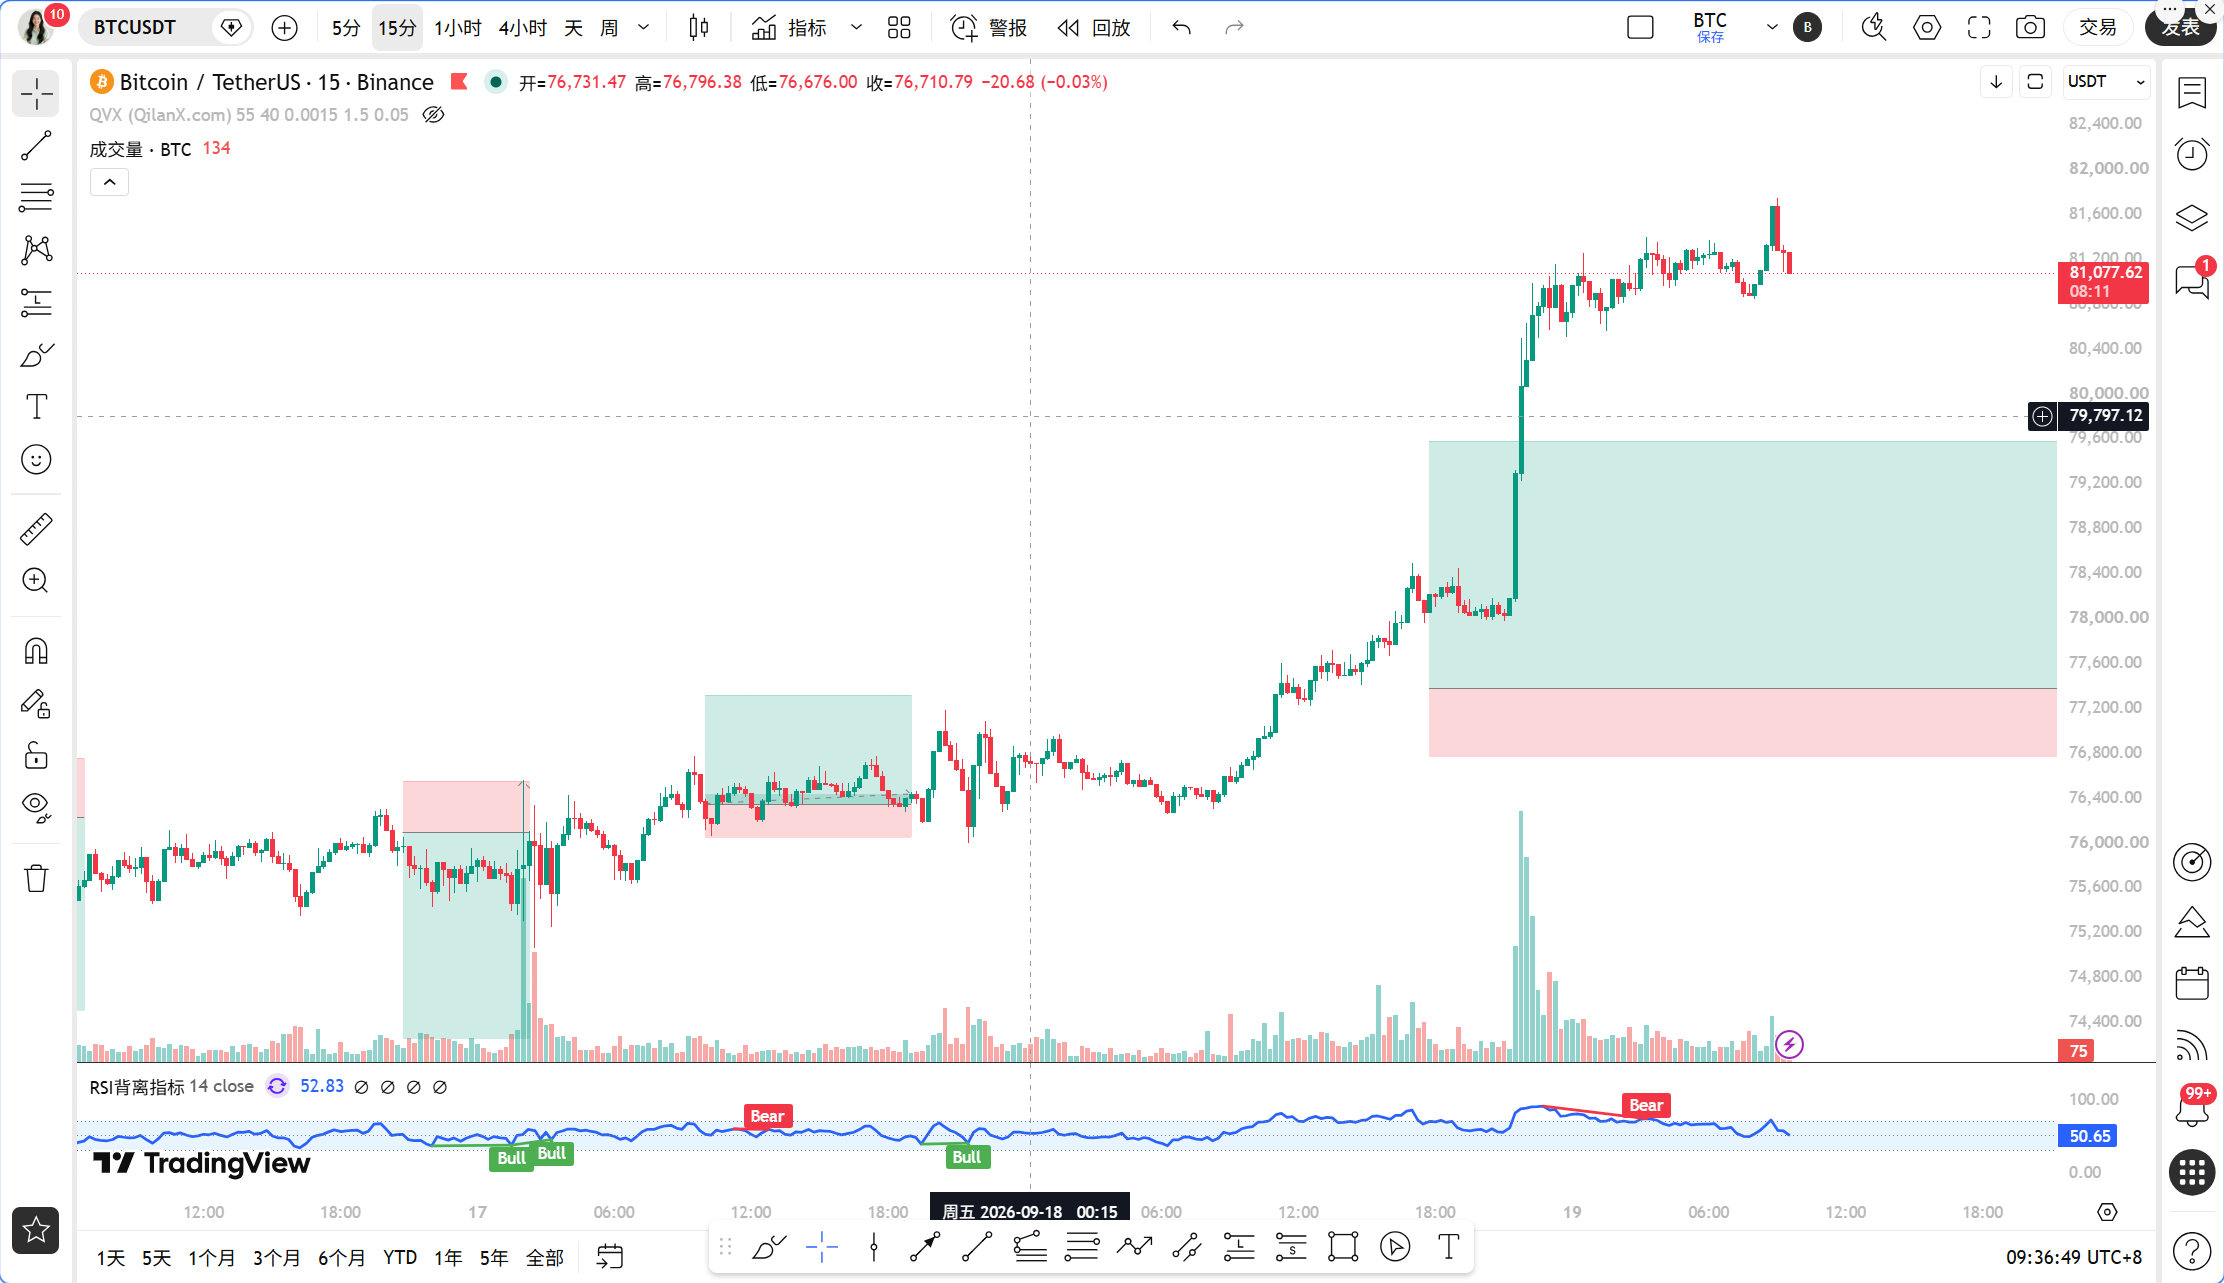
Dear teammates, this morning when I opened my eyes, two news stories instantly woke me up. The first one, $531 million was liquidated across the entire internet in 24 hours, with short positions accounting for $471 million, nearly 90%. What does this mean? It means that in the past day, those who were shorting the market were collectively wiped out, and the short squeeze effect is providing strong upward momentum for BTC. The second news, Bitcoin has officially stabilized above the 50-week moving average, with the Galaxy executive publicly stating "the upward trend is real." This is historically a bullish signal in the eyes of technical analysts, confirming the bottom of the bear market. With these two messages combined, BTC broke through the 81,000 USDT threshold, having risen 5.94% in 24 hours.
But here comes the question, after such a rise, can we still chase it? Today, Qinglan will use the TPV system to clarify the multi-timeframe state, signal verification, key support and resistance levels, and specific trading ideas one by one.
Current Price and Time
The current time is September 19th, 09:34, and the latest quote for BTC is 81,122 USDT. The increase over the past 24 hours is 6.22%, with a market share of 58.43%. The fear and greed index is at 71, indicating a greedy zone. Note that greed does not mean that a peak is imminent, but it does indicate that market sentiment is significantly overheated, and the cost-performance ratio for chasing highs in the short term is declining.
Multi-Timeframe State Overview
First, let's look at the daily chart. The daily MA5 is at 78,054.74, MA10 at 77,637.81, MA30 at 78,347.58, and the current price of 81,122 is far above these three moving averages. However, the daily MACD's DIF is 1303.59, DEA is 1479.89, and the histogram value is -176.30, which indicates a death cross state, meaning that the momentum at the daily level has not yet fully recovered; this wave of increase is primarily driven by the 4-hour and 1-hour levels. The daily RSI is 54.36, neutral but somewhat bullish, with no signs of being overbought.
Next, let's look at the 4-hour chart. The 4h MA5 is at 80,399.71, MA10 at 78,697.11, MA30 at 77,452.68, and the moving averages are in a very standard bullish arrangement. In terms of MACD, DIF is 935.40, DEA is 353.56, and the histogram value is 581.84, showing strong bullish momentum. But note that the 4h RSI has surged to 89.33, which is a very extreme overbought reading, indicating that a profit-taking pullback might occur at the 4-hour level at any time.
Then look at the 1-hour chart. The 1h MA5 is at 81,210.48, MA10 at 81,117.13, MA30 at 78,925.63. The MACD's DIF is 1068.90, DEA is 1054.91, and the histogram value is 13.99; momentum still exists, but the histogram value is quite small, indicating that the upward momentum at the 1-hour level is diminishing. The 1h RSI is 76.96, also in the overbought region. The 1h EMA55 is at 78,394.93, with the current price at 81,122, a distance of 3.48% from the EMA55.
Finally, let's look at the 15-minute chart. The 15m MA5 is at 81,331.07, MA10 at 81,151.44, MA30 at 81,151.32; the three moving averages are almost glued together, with the price repeatedly crossing near the moving averages. The 15m MACD's DIF is 124.46, DEA is 149.81, and the histogram value is -25.36, indicating a death cross. The 15m RSI is 46.75, neutral but somewhat weak. This indicates that at the short-term level, bullish momentum is weakening, and the price has entered a small-scale consolidation phase.
TPV Signal Verification
According to the core rules of the Qinglan TPV system, we verify each point one by one.
First, the EMA55 bullish-bearish boundary. The current price is 81,122, and the 1h EMA55 is at 78,394.93, with the price far above the EMA55. In the past 8 1-hour candles, the number of closing prices greater than EMA55 is 8/8, and the number of times it has crossed is 0, with a distance of 3.48%. This does not align at all with the threshold for a choppy market, and the system judges it to be in a one-sided bullish trend area. This is very clear: the overall direction is bullish.
Second, verification of long conditions. Condition one: the price stabilizes above the 1h EMA55, with the closing prices of two consecutive 1-hour candles being greater than the EMA55, which is already satisfied. Condition two: the support stabilizing pattern. Currently, at the 1-hour level, the price has slightly pulled back from a high position, but there is no clear signal of a long lower shadow line, bottoming pattern, or a rebound touching an effective low point. Condition three: the downwards momentum has weakened. The 1h MACD histogram value is 13.99; although it is still positive, the value has been shortening compared to previous values, but there has not yet been confirmation of two consecutive periods of shortening. The 1h RSI has dropped from a high of 76.96 but is still far from 30. Therefore, only the first condition is currently satisfied for entering long, while the second and third conditions do not yet have clear signals.
In other words, the TPV system tells us: the trend is bullish, but it is not an ideal point to enter long at present. The system does not encourage forcing an entry when the RSI is overbought, momentum is weakening, and the support pattern is unclear.
On-chain/Fund Flow
Regarding on-chain data, the fear and greed index is at 71, in a greedy zone. BTC's market share is 58.43%, indicating that funds are still concentrated on BTC, and according to Glassnode data, the leverage level of altcoins is not overheated, making risks controllable. Liquidation data is the most noteworthy; $531 million was liquidated across the entire internet in 24 hours, with short positions accounting for $471 million, indicating that a large number of shorts have been wiped out. However, conversely, after the shorts have been cleared, there is still a large number of liquidations clustered in the $83,000 to $86,000 range above; if the price continues to rise and touches this range, it may trigger a new round of rapid increases. But if it does not touch it, it might cause a brief pullback due to the exhaustion of short forces.
Additionally, the sentiment of U.S. investors has fallen to a new low for 2025, with more than half being bearish, and the AAII survey shows that retail investors are extremely pessimistic. Qinglan has always said that extreme pessimism among retail investors often serves as a contrarian indicator, but in the short term, it may exacerbate market volatility. This signal creates an interesting divergence with the current greed index, warranting caution.
Key Support and Resistance Levels
The first resistance level above is in the range of 81,500 to 81,800, which is a dense area of moving averages on the 15-minute chart and a short-term trading zone. The second resistance level is in the range of 83,000 to 86,000, which is the dense area of short liquidations mentioned in the news; if it breaks through 83,000 with volume, it may trigger a rapid increase.
The first support level below is in the range of 80,300 to 80,500, which is the position of the 4-hour MA5 and also the first line of defense for short-term bulls. The second support level is in the range of 78,900 to 79,000, which is where the 1-hour MA30 and the previous consolidation platform are located. The third support level is around 78,400, which is the 1-hour EMA55; this is the bullish-bearish boundary of the TPV system, and if the price falls below here, the trend judgment will need to be re-evaluated.
Trading Ideas
Direction: Bullish trend, but wait for a pullback confirmation before entering; do not chase highs.
Entry conditions: The first scenario is to wait for the price to pull back to the range of 80,300 to 80,500, showing a long lower shadow line or a bottoming pattern at the 1-hour level, while the 1h MACD histogram consecutively shortens for two periods before expanding again, and the RSI stabilizes after falling from overbought to the range of 50 to 60; you can take a small position to go long. The second scenario is if the price breaks through 83,000 with volume and holds above with two consecutive 1-hour candles; you can chase long, but control your position to within half of the normal level.
Stop-loss: If entering in the range of 80,300 to 80,500, place the stop-loss below 78,900, which is below the 1-hour MA30. If chasing long after the break of 83,000, place the stop-loss below 81,800.
Target levels: The first target is 83,000, and the second target is 85,000 to 86,000, which is the area of dense short liquidations. If the second target is reached, it is recommended to reduce the position by more than half to lock in profits.
Risk Warning
The 4h RSI is at 89.33, indicating severe short-term overbought conditions, along with a 57.6% probability of the Federal Reserve raising interest rates in October; any hawkish signal could trigger a quick pullback, so make sure to have a stop-loss when chasing highs.
Follow Qinglan's cryptocurrency classroom to seize more trading opportunities! Feel free to visit the official website www.qinglan.org
📊 Qinglan TPV Trading Strategy Backtesting Reference
🕒 Last Backtesting Time 09-19 07:00:01
Total Analysis: 4112 Backtests: 4099 Accuracy Rate: 78.6% (3223/4099)
免责声明:本文章仅代表作者个人观点,不代表本平台的立场和观点。本文章仅供信息分享,不构成对任何人的任何投资建议。用户与作者之间的任何争议,与本平台无关。如网页中刊载的文章或图片涉及侵权,请提供相关的权利证明和身份证明发送邮件到support@aicoin.com,本平台相关工作人员将会进行核查。