Cryptocurrency Academy: 9.20Bitcoin (BTC) should not be deceived by unilateral rises; is a correction hidden in the market? Latest market analysis and operational advice explained
Current price of Bitcoin81850, it is essential to distinguish between trend and position. The trend is bullish, but it does not mean you can go long at any price level at will. The risk at high levels is always greater than the opportunity; it is better to miss out than to make a mistake. The market never lacks opportunities; what it lacks is patience and risk control. Since you missed the 60000 and 65000 upward signals I provided, and now you also missed the 75500 upward, it’s fine. The market is always here, and I am always here.
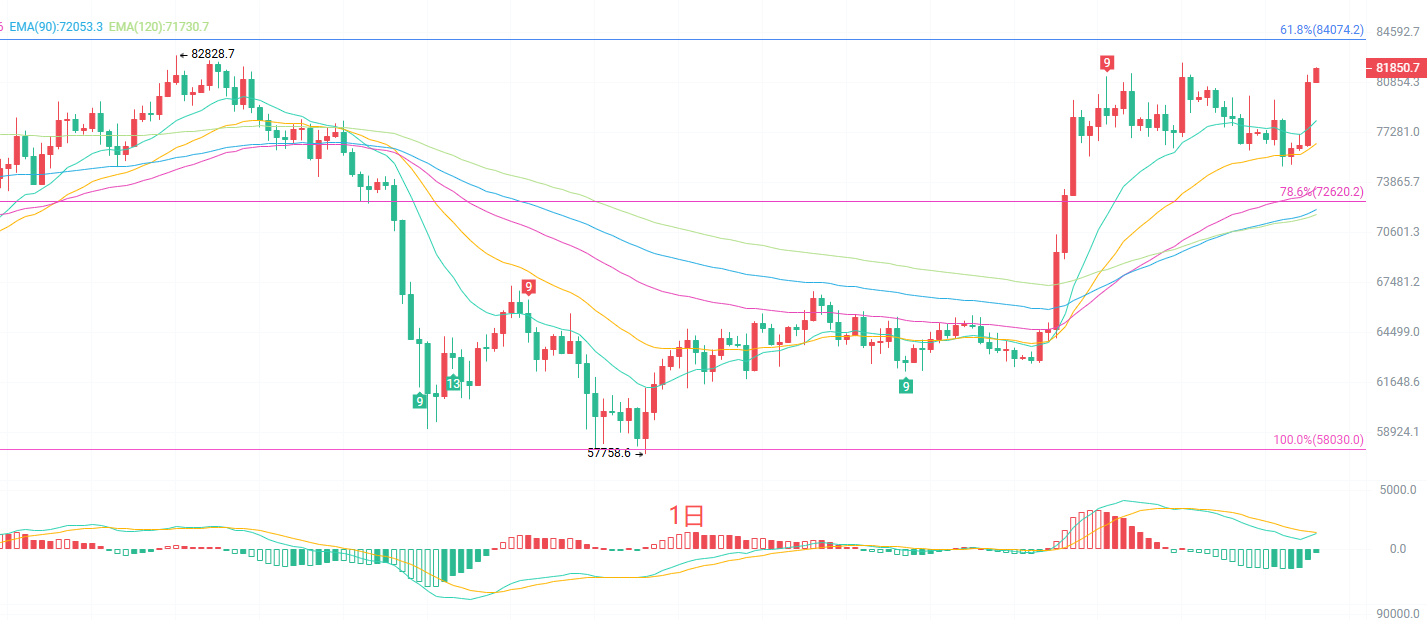
The daily K-line bullish trend framework is intact. The MACD indicator's red column has slightly converged, the DIF is still above the DEA, bullish momentum is slightly declining but there are no signals for a bearish reversal. The Bollinger Bands are expanding upward, and the price is running near the upper band, indicating a strong bullish pattern in the short term. However, after continuous rises, overbought pressure is gradually accumulating, and a technical correction may occur at any time; one should not blindly chase prices but pay attention to the effectiveness of moving average support.
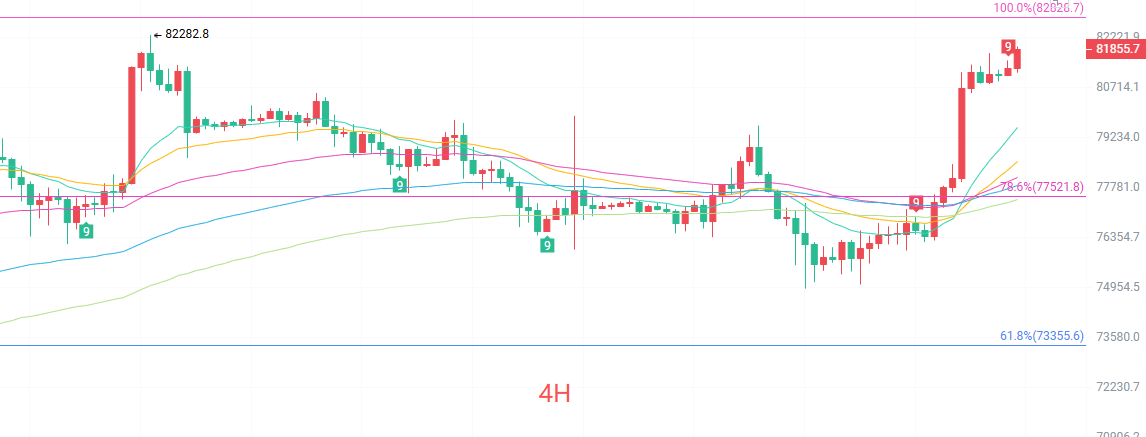
The four-hour K-line moving averages maintain a bullish arrangement. The previous high of82282 is currently the strongest resistance, and it is a key threshold for this rebound. The MACD red column continues to shorten, showing signs of slowing bullish momentum, with potential bearish divergence. The upper Bollinger Band at 82594 is clearly pressing down, while the lower band at 73808 serves as long-term support. This is the accumulation phase after a strong bullish trend, and the market is likely to fluctuate and digest in the 81000-82282 range, waiting to choose a direction. During this phase, chasing long positions increases risk; it is better to wait for a pullback to support before considering opportunities.
Short-term reference
From below 80500 to 80000 upward, stop loss at 500 points, target after breaking 82000 aims for 84000.
Above, the previous high of 82200 could see a stagnation and decline; attempt to go short with a stop loss of 500 points, aiming for 81000 to 80000.
Specific operations should be based on real-time market data; for more information, please consult me. There may be delays in the article’s release, so advice is for reference only and risks are borne by the user.

Warm reminder: The above content is only created by me on the official account. The advertisements at the end of the article and in the comments section are unrelated to me. Please be cautious in identifying them. Thank you for reading.
免责声明:本文章仅代表作者个人观点,不代表本平台的立场和观点。本文章仅供信息分享,不构成对任何人的任何投资建议。用户与作者之间的任何争议,与本平台无关。如网页中刊载的文章或图片涉及侵权,请提供相关的权利证明和身份证明发送邮件到support@aicoin.com,本平台相关工作人员将会进行核查。