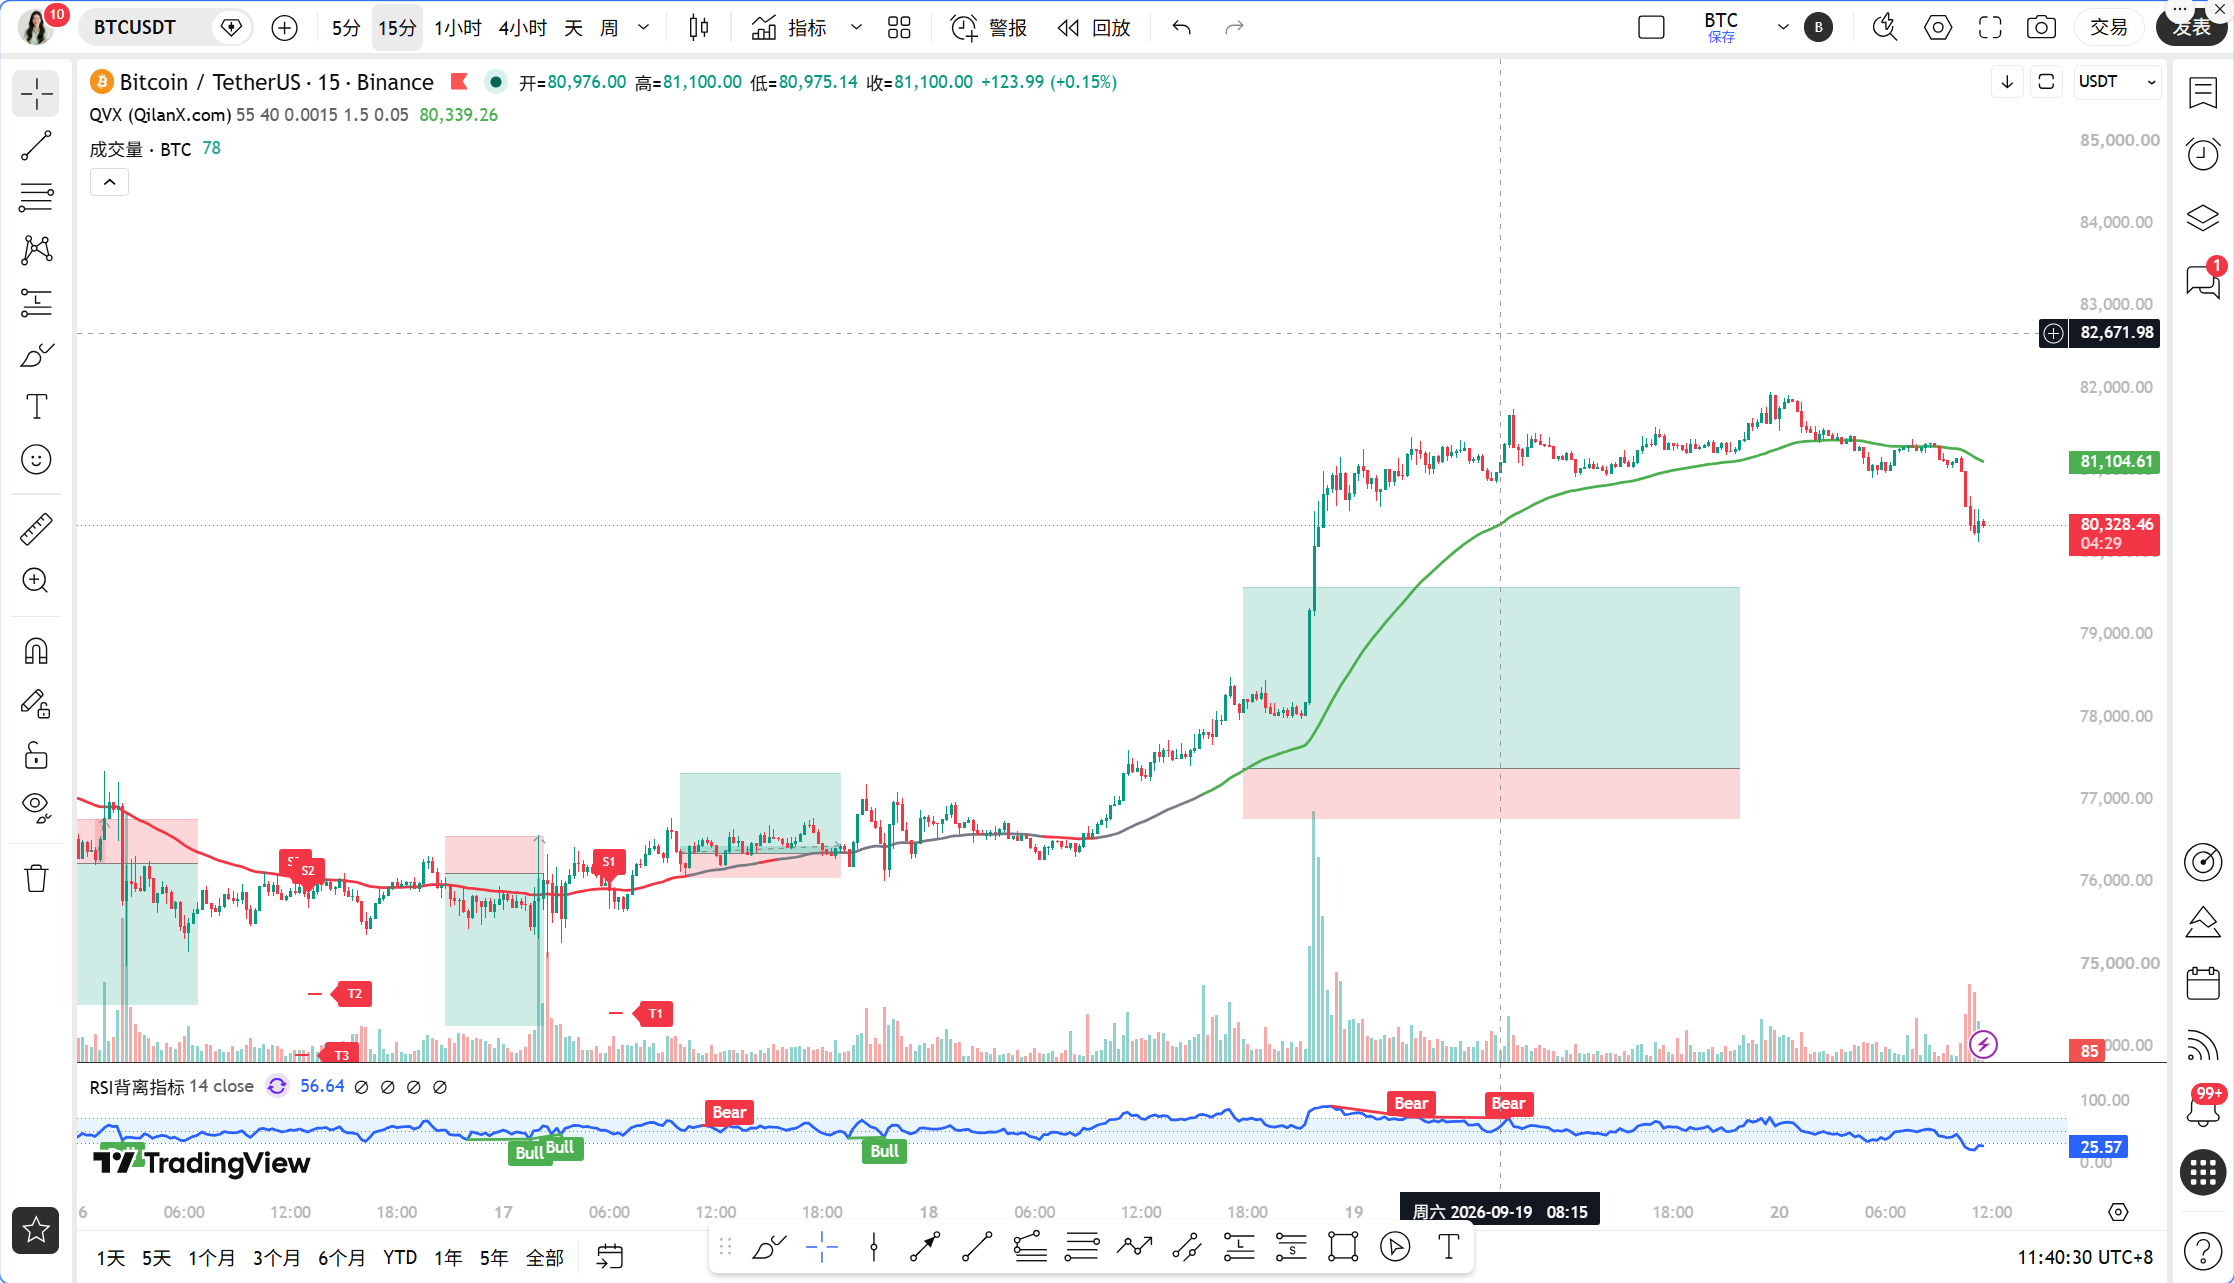
Today's news is quite contrasting. On one side, the well-known big player Huang Licheng has increased his positions, pushing the long positions in ETH, BTC, and HYPE to $131 million, sending a strong bullish signal and igniting market sentiment. On the other side, Binance issued an emergency security alert, with iPhone users reported to have an iOS vulnerability that could steal private keys, and the FomoPeek malware is threatening user asset security, causing panic withdrawals and selling concerns to spread rapidly. These two forces are colliding head-on, with BTC stuck around 80323 USDT, and neither side dares to act decisively.
Current Price and Time
It is now September 20th, 11:40, with the latest BTC price at 80323 USDT, showing a 24-hour change of -0.27%. Although the fluctuations seem minor, the internal battles within the market are much more intense than the surface numbers suggest. BTC's market dominance remains at 58.88%, with no significant capital flowing into altcoins, indicating that the market is still in a stock game phase. The fear and greed index is reported at 71, within the greed range, but has retreated from the previous highs, indicating that sentiment is shifting from exuberance to caution.
Multi-Cycle Overview
First, let's look at the daily level. The daily MA5 is at 79015.98, MA10 at 78026.00, and MA30 at 78418.00. The current price of 80323 is steadily above these three moving averages, suggesting a bullish mid-term structure. However, the daily MACD shows a DIF of 1377.90, DEA of 1458.37, and a histogram value of -80.48. The fast and slow lines are still in a death cross with a negative histogram value, indicating that upward momentum at the daily level is diminishing, which is a warning signal. The daily RSI is at 49.94, right near the neutral line, indicating neither overbought nor oversold conditions, with direction still unclear.
Now, let's examine the 4-hour level. The 4h MA5 is at 81173.13, MA10 at 81091.60, and MA30 at 78048.84. The price at 80323 has fallen below the 4h MA5 and MA10, but is still far above the MA30. The 4h MACD shows a DIF of 1137.91, DEA of 956.20, and a histogram value of 181.71, maintaining a golden cross state, but with signs of narrowing histogram values. The 4h RSI at 75.12 indicates an overbought area, signaling a need for short-term correction. Overall, the 4-hour level is in the initial adjustment phase after high-level lethargy.
The 1-hour level is currently the key observation window. The 1h MA5 is at 80859.17, MA10 at 81059.50, MA30 at 81220.05, showing a bearish arrangement of moving averages, with the price at 80323 operating below the moving average system, indicating clear short-term pressure. The 1h MACD has a DIF of 59.68, DEA of 259.48, and a histogram value of -199.80, with a death cross and ongoing negative histogram, showing that downward momentum is still being released. The 1h RSI at 28.32 is nearing the oversold area, and the risk/reward ratio for continuing to short is decreasing. The 1h EMA55 is at 80119.74, which is the core bullish-bearish dividing line of the TPV system, with the current price at 80323 only about 203 points, or around 0.25%, above EMA55, indicating a typical line-conforming operation state.
At the 15-minute level, the MA5 is at 80369.49, MA10 at 80728.20, and MA30 at 81040.42, with the moving averages in a bearish arrangement, struggling near MA5. The 15m MACD shows a DIF of -239.62, DEA of -147.91, and a histogram value of -91.72, still in a death cross but with signs of shortening histogram values. The 15m RSI at 17.24 indicates extreme oversold conditions, with a potential technical rebound possible at any moment.
TPV Signal Verification
According to the core rules of the Qinglan TPV system, we will verify the current signals one by one.
First, let's look at trend positioning. The current price of 80323 is above the 1-hour EMA55 of 80119.74, indicating a bullish trend area according to the system's definitions. However, it is important to note that the absolute distance from EMA55 is only 0.25%, far below the 0.3% volatility threshold reference line, meaning the price is nearly operating on EMA55, and the bullish-bearish dividing line could be breached at any moment.
Next, we verify the conditions for going long. The first requirement is that the price must continuously close above EMA55 for two consecutive 1-hour candlesticks. According to the oscillation support data, in the past 8 one-hour candlesticks, the closing price has been above EMA55 8/8 times, with 0 instances of crossing below, indicating that the price has operated above EMA55 for the past 8 hours, thus fulfilling the first condition. The second requirement is a stable support signal; currently, the 1h level has not shown any clear long lower shadow or bottom formations, and while the 15m RSI is extremely oversold, a rebound has not yet formed an effective stabilization pattern. The third requirement is that downwards momentum must be exhausted; the 1h MACD histogram value is -199.80, requiring observation of whether the value shortens for two consecutive cycles. Currently, the data shows the histogram value remains at a high level, with an insufficient exhaustion signal.
In summary, the TPV system currently indicates that both bullish and bearish conditions are incomplete. Although the price is above EMA55, the line-conforming operation along with bearish momentum indicators means only the first of the three conditions for going long is satisfied, while the second and third conditions are yet to be confirmed. Additionally, since the price has not closed below EMA55 for two consecutive 1-hour candlesticks, the first condition for going short is also not met. The system signal is in a gray area and needs clearer confirmation.
On-chain and Financial Aspects
In terms of on-chain data, the fear and greed index at 71 is still within the greed range, but BTC's 24-hour change is -0.27%, indicating that the price has not followed the greedy sentiment to continue rising, suggesting a divergence in bullish strength at the current position. With BTC's market dominance at 58.88%, capital has not significantly rotated into altcoins, and the market is in a defensive posture.
On the news side, a BIT-related address has transferred 1000 BTC worth $81.06 million to Binance again. The behavior of large whales continually depositing into exchanges warrants caution, as it may indicate that some large players are choosing to take profits at the current position. On the flip side, PlanB stated that Bitcoin could rise to $89,000 if it breaks above the 50-week moving average, while the BTC-gold ratio has also surpassed the 50-week moving average, suggesting a bullish logic in the medium to long term remains. The SEC has issued an exemption for tokenized stock innovations, which is favorable for the RWA track and ETH ecosystem. In terms of geopolitics, the US is preparing to negotiate with Iran, causing a retreat in risk premiums, though Trump's signing of sanctions against Iran introduces uncertainties.
Key Resistance and Support Levels
The first resistance level above is around 80119.74 at the 1-hour EMA55, which is the dividing line between bullish and bearish conditions. The price must stabilize at this level to maintain the bullish structure. The second resistance level is formed by the pressure band between the 4h MA5 at 81173.13 and the 1h MA10 at 81059.50, approximately in the range of 81000 to 81200. Only successful breakthrough of this area can open the space for a rise to 82000 or even higher positions.
The first support level below is at the psychological level of 80000, which is not only a psychological support but also near the 1-hour EMA55 position. The second support level is near the daily MA5 at 79015.98. If the 80000 level is breached, the range of 79000 to 79200 will be a crucial defensive position for bulls. Even lower, strong support is located in the area where the daily MA10 and MA30 intersect, at 78000 to 78400.
Trading Thoughts
Direction Judgment: The current TPV system signal is incomplete, as the price is near the EMA55, indicating a period of observation before direction selection. The suggestion from Qinglan is to patiently wait for signal confirmation and not rush to enter the market.
Long Strategy: If the price shows a clear long lower shadow or bottom formations in the range of 80000 to 80100, while the 1h MACD histogram value shortens for two consecutive cycles, and the 15m RSI rebounds from the oversold zone accompanied by a bullish engulfing candle, a small position can be taken to go long. Entry conditions must meet both support stabilization and momentum exhaustion. Set the stop loss below 79500, with an initial target at the 81000 to 81200 pressure band; hold until a breakthrough to 82000.
Short Strategy: If two consecutive 1-hour candlesticks close below EMA55, which is 80119.74, while the 1h MACD histogram value continues to expand, and RSI rebounds from the current 28 area before falling again, a short position can be considered. Entry conditions must wait for the confirmation of two consecutive 1-hour candlesticks closing below. Set the stop loss above 80800, with an initial target in the range of 79000 to 79200, further targeting the strong support area of 78000 to 78400.
Risk Warning
The iOS private key vulnerability may trigger panic selling, combined with large whales depositing into exchanges, indicating that short-term downward risks cannot be ignored; strict stop-loss measures are essential.
Follow Qinglan Crypto Classroom to seize more trading opportunities! Welcome to visit the official website www.qinglan.org
📊 Qinglan TPV Trading Strategy Backtest Reference
🕒 Last Backtest Time 09-20 07:00:02
Total Analysis: 4135 Backtests: 4128 Accuracy: 78.7% (3248/4128)
免责声明:本文章仅代表作者个人观点,不代表本平台的立场和观点。本文章仅供信息分享,不构成对任何人的任何投资建议。用户与作者之间的任何争议,与本平台无关。如网页中刊载的文章或图片涉及侵权,请提供相关的权利证明和身份证明发送邮件到support@aicoin.com,本平台相关工作人员将会进行核查。