Crypto Circle Academician: Don't be confused by the short-term pullback of Ethereum (ETH) on 9.21, a deep analysis of the current rising structure? Latest market analysis reference
The current price of Ethereum is 2645, the most tormenting part is the high-level fluctuations. When the direction is not clear, getting slapped in the face repeatedly is the norm. Many people always want to catch every wave of the market, resulting in frequent trades and continuous losses. Trading doesn't have to be done all the time; when you don't understand, the best strategy is to stay out of the market and wait. Technology is just a tool; risk control is the fundamental way to survive. Don't fantasize that every trade will be profitable; maintaining the loss bottom line and making money from what you understand is enough.
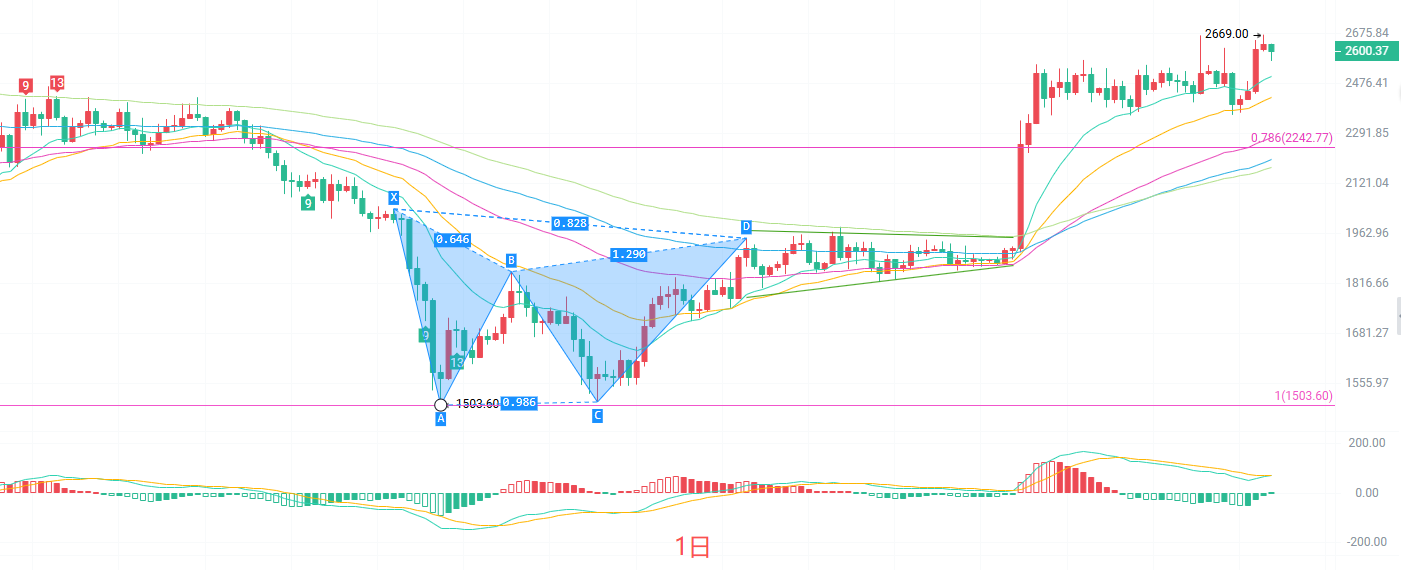
The daily K-line has previously initiated a significant rebound from the low point of 1503. The current price is operating above the 0.786 Fibonacci level of 2242, with upper resistance at the 0.618 level of 2823. The MACD indicator's red bars are gradually converging, and both DIF and DEA are still above the zero axis, indicating a reduction in bullish momentum. The Bollinger Bands are narrowing, and the price is moving between the upper and middle bands. The daily K-line has entered a high-level fluctuation range, with a low probability of a direct unilateral surge in the short term; the main theme is oscillation and digestion.
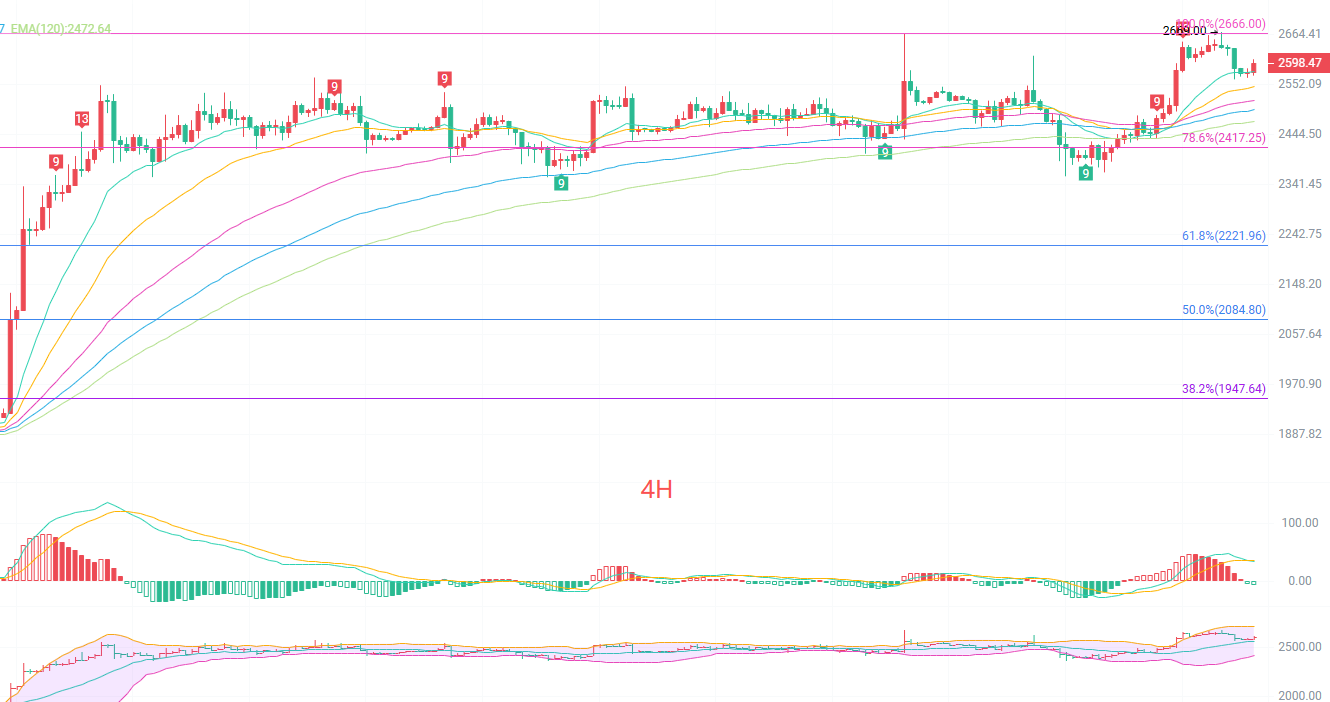
The four-hour K-line EMA moving averages are arranged bullishly, but the price has already fallen below the short-term moving average. The MACD has formed a death cross at high levels, with the green bars continuously expanding, indicating a short-term need for a pullback. The upper Bollinger Band at 2707 is under pressure, and the current price has fallen to test support near the middle Bollinger Band. Strong resistance above at 2666 and critical support below at 2417. The retracement phase of the high-level bullish market belongs to the oscillation correction after the rise, and the overall structure has not turned bearish.
Short-term reference:
If the price breaks above 2570 to 2560, stop loss at 40 points, target at 2650 to 2666.
If the price doesn't break down at 2650 to 2666, stop loss at 40 points, target at 2600 to 2570.
Specific operations should mainly rely on real-time market data. For more information details, you can consult the author. The publication of this article may be delayed, so it is recommended for reference only, and you assume the risk.

Friendly reminder: The above content is solely created by the author of the public account. Advertisements at the end of the article and in the comments are unrelated to the author. Please be cautious in discerning, thank you for reading.
免责声明:本文章仅代表作者个人观点,不代表本平台的立场和观点。本文章仅供信息分享,不构成对任何人的任何投资建议。用户与作者之间的任何争议,与本平台无关。如网页中刊载的文章或图片涉及侵权,请提供相关的权利证明和身份证明发送邮件到support@aicoin.com,本平台相关工作人员将会进行核查。