Academician of the Currency Circle: On September 21, the major bullish cycle of Bitcoin (BTC) has not broken, what are the response strategies under the short-term decaying momentum? Latest market analysis and operational advice breakdown
The current price of Bitcoin is 80700. The market will not move according to our thoughts; we can only respond according to the signals on the chart. Right now, BTC is in a stage of choppy and frustrating movements, with many small fluctuations, and the significant trend has not yet emerged. Many people are losing large amounts of money due to holding large positions during fluctuations. Do not fantasize about making a profit on every single trade; accept reasonable stop-loss levels. Patiently wait for high risk-reward opportunities, control your hands, and reduce ineffective trades.
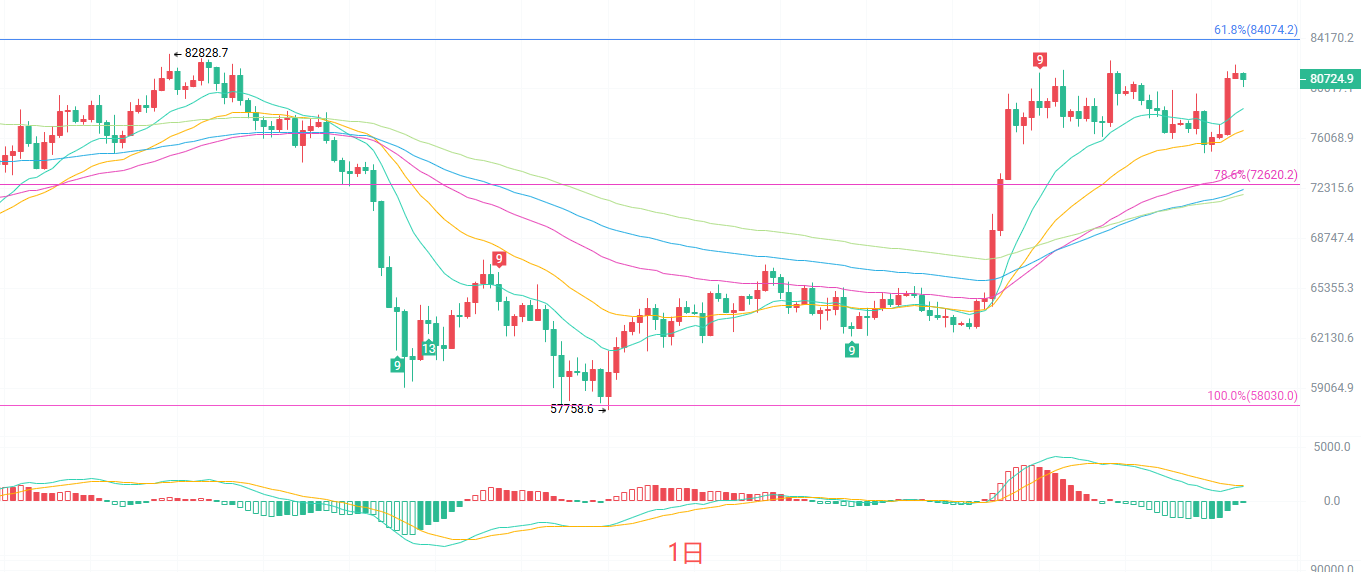
The daily candlestick chart is firmly above multiple EMA moving averages, and the medium to long-term moving averages are trending upwards, with the bullish structure of the larger trend intact. The MACD indicator's red bars are gradually shrinking, and the DIF and DEA remain above the zero axis, indicating a slowdown in bullish momentum, with no clear bearish reversal signals. The Bollinger Bands are narrowing, and the price is operating between the middle and upper Bollinger bands. The key resistance above is at 82282, while the support below is at the Fibonacci 78.6% position of 77521. On the daily chart, this phase is a consolidation phase after an uptrend; as long as the core support remains intact, the overall direction continues to lean towards bullishness, with a high probability of continuing to oscillate within a range in the short term.
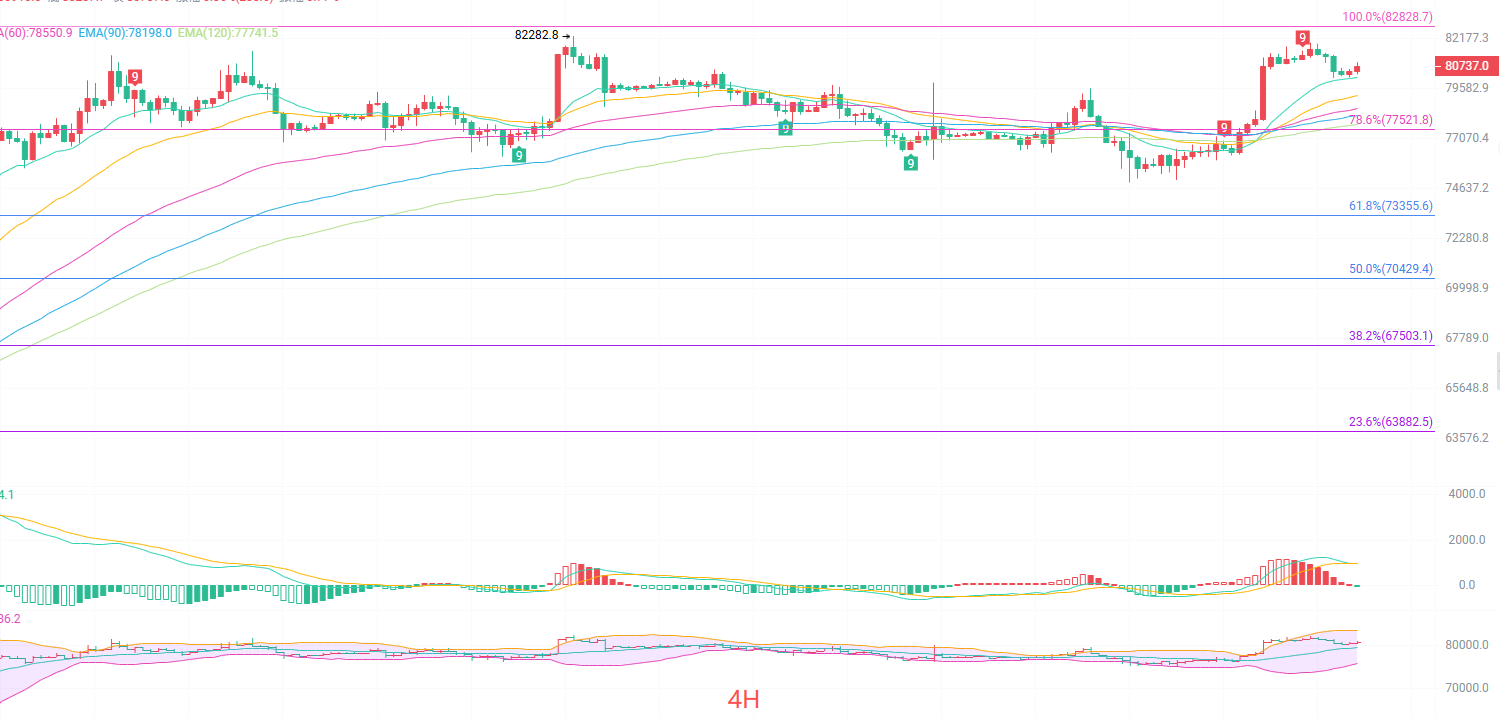
The four-hour candlestick chart has formed a short-term pressure pattern. The price is still maintaining above the short-term EMA15 and EMA30; the moving average system remains in a bullish arrangement, but the upward slope of the short-term moving averages is slowing. The MACD indicator has turned down from a high position, with the red bars continuing to shorten, indicating a sustained weakening of bullish strength, with potential expectations of a dead cross forming. The Bollinger Bands are tending to flatten out, and the price is oscillating above the middle Bollinger band. The resistance above is at 82282, with the first support below at 80000 and strong support at 77521. This is a phase of bullish pullback and consolidation; the oscillating range will repeatedly test support and resistance, and short-term operations should be wary of false breakouts within the range.
Short-term reference
Buy between 80200 and 79800 with a stop loss of 500 points, targeting 81800 then 82200 if broken.
Try selling at the previous high of 82200 with a stop loss of 500 points, targeting 81000 to 80000.
Specific operations should primarily rely on real-time data from the market; for more details and information, you can consult the author. The publication of this article may be delayed; the advice is for reference only, and risks are borne by you.

Friendly reminder: The above content is solely created by the author for the official account. Ads at the end of the article and in the comment section are unrelated to the author. Please discern carefully, and thank you for reading.
免责声明:本文章仅代表作者个人观点,不代表本平台的立场和观点。本文章仅供信息分享,不构成对任何人的任何投资建议。用户与作者之间的任何争议,与本平台无关。如网页中刊载的文章或图片涉及侵权,请提供相关的权利证明和身份证明发送邮件到support@aicoin.com,本平台相关工作人员将会进行核查。