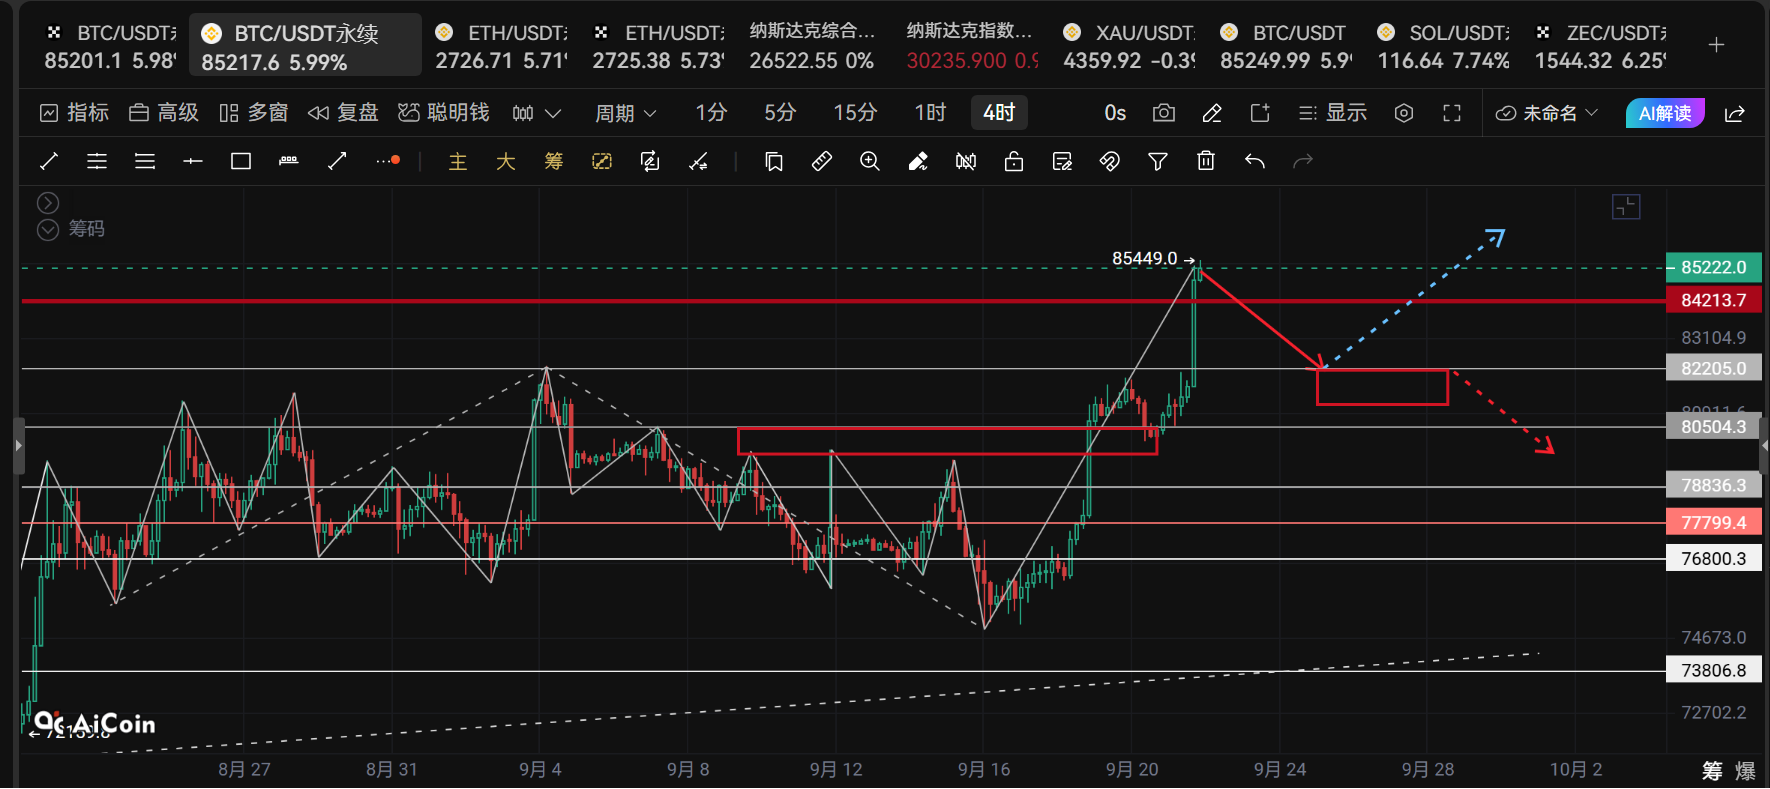
Crypto Circle Academician: On September 22, Bitcoin (BTC) continuously breaks new highs; what is the core difference between the continuation of trends and peak signals? Latest market analysis and operation suggestions breakdown
The current price of Bitcoin is 86000, with new market highs constantly achieved, but risks are also accumulating simultaneously. When there is a one-sided increase, everyone feels it will continue to rise, but market reversals often occur in an instant. Technical analysis can only serve as a probabilistic reference, with no signal being 100% accurate. Regardless of being bullish or bearish, it is essential to plan for stop-loss in advance, especially for my fellow cryptocurrency traders heading north, hold steady and be prepared.
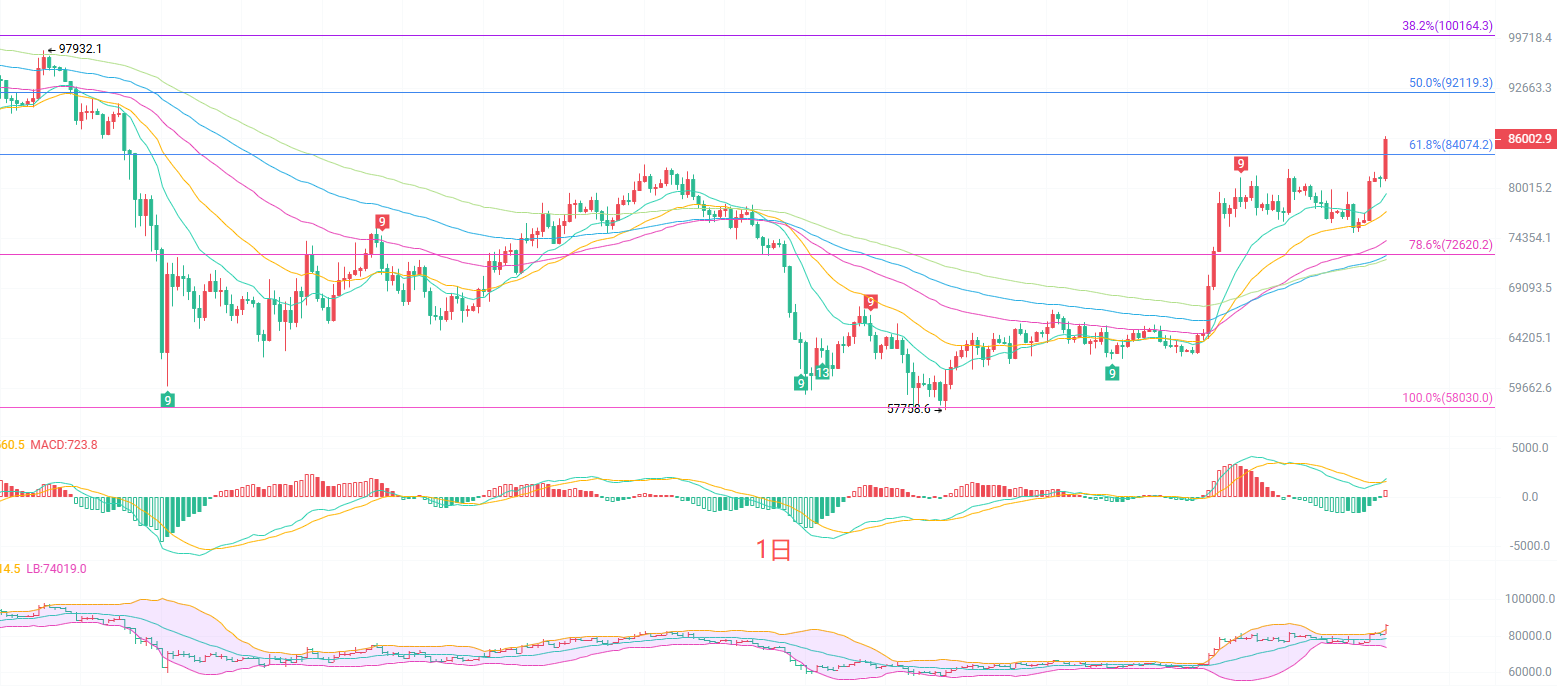
The daily K-line continues to move upwards along the EMA bullish moving averages, showing a bullish arrangement in the moving average system, with the 15, 30, and 60-period EMA levels providing strong support. The MACD indicator's DIF operates above the DEA, with the red bars maintaining a volume expansion state. The upper Bollinger Band continues to open upwards, indicating an expansion of the channel, representing that the large-scale bullish trend on the daily line has not ended. However, the current price has already stood above the upper Bollinger Band, which is in an overbought range. After a sustained rise, there is a possibility of a technical pullback at any time. One should not chase high prices blindly, but rather observe if the moving average support holds effectively during the pullback.
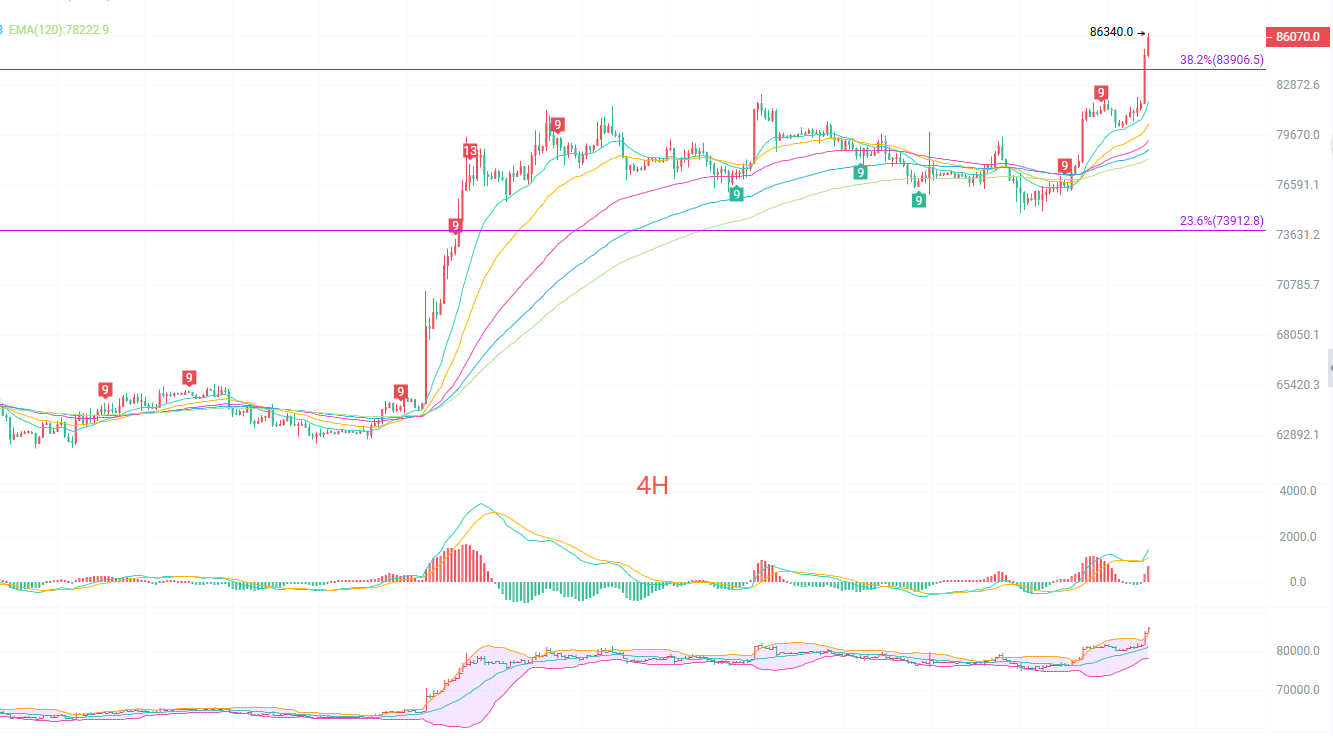
The four-hour K-line continues to ascend along the EMA15 and EMA30 moving averages, with the bullish arrangement of moving averages remaining intact, and pullbacks have not effectively broken below the short-term moving averages. The MACD maintains its red bars, and bullish momentum is still present, but the red bars have shown some decline compared to the previous high points, indicating a slight dulling of bullish strength. The Bollinger Band is opening upwards, and the price is trading near the upper band, with the range of fluctuations continuing to widen. The 4-hour level has consecutively closed with bullish candlesticks, making short-term overbought conditions evident; a short-term pullback to consolidate power may occur at any time. In short-term operations, do not chase high prices, and wait for key support during pullbacks to observe.
Short-term Reference
Buy on the dip from 83000 to 82000, with a stop loss at 500 points, and if 81800 breaks, aim for 82200.
If the previous high of 86200 cannot maintain stability, consider selling downwards, with a stop loss at 500 points; short-term operations should be fast in and out.
Specific operations should primarily rely on real-time market data; for more information, details can be consulted with the author. The publication of the article may be delayed, and the suggestions are for reference only, risks are to be borne by the reader.

Friendly reminder: The above content is solely created by the author of the public account, and any advertisements at the end of the article or in the comment section are unrelated to the author. Please discern carefully, thank you for reading.
免责声明:本文章仅代表作者个人观点,不代表本平台的立场和观点。本文章仅供信息分享,不构成对任何人的任何投资建议。用户与作者之间的任何争议,与本平台无关。如网页中刊载的文章或图片涉及侵权,请提供相关的权利证明和身份证明发送邮件到support@aicoin.com,本平台相关工作人员将会进行核查。