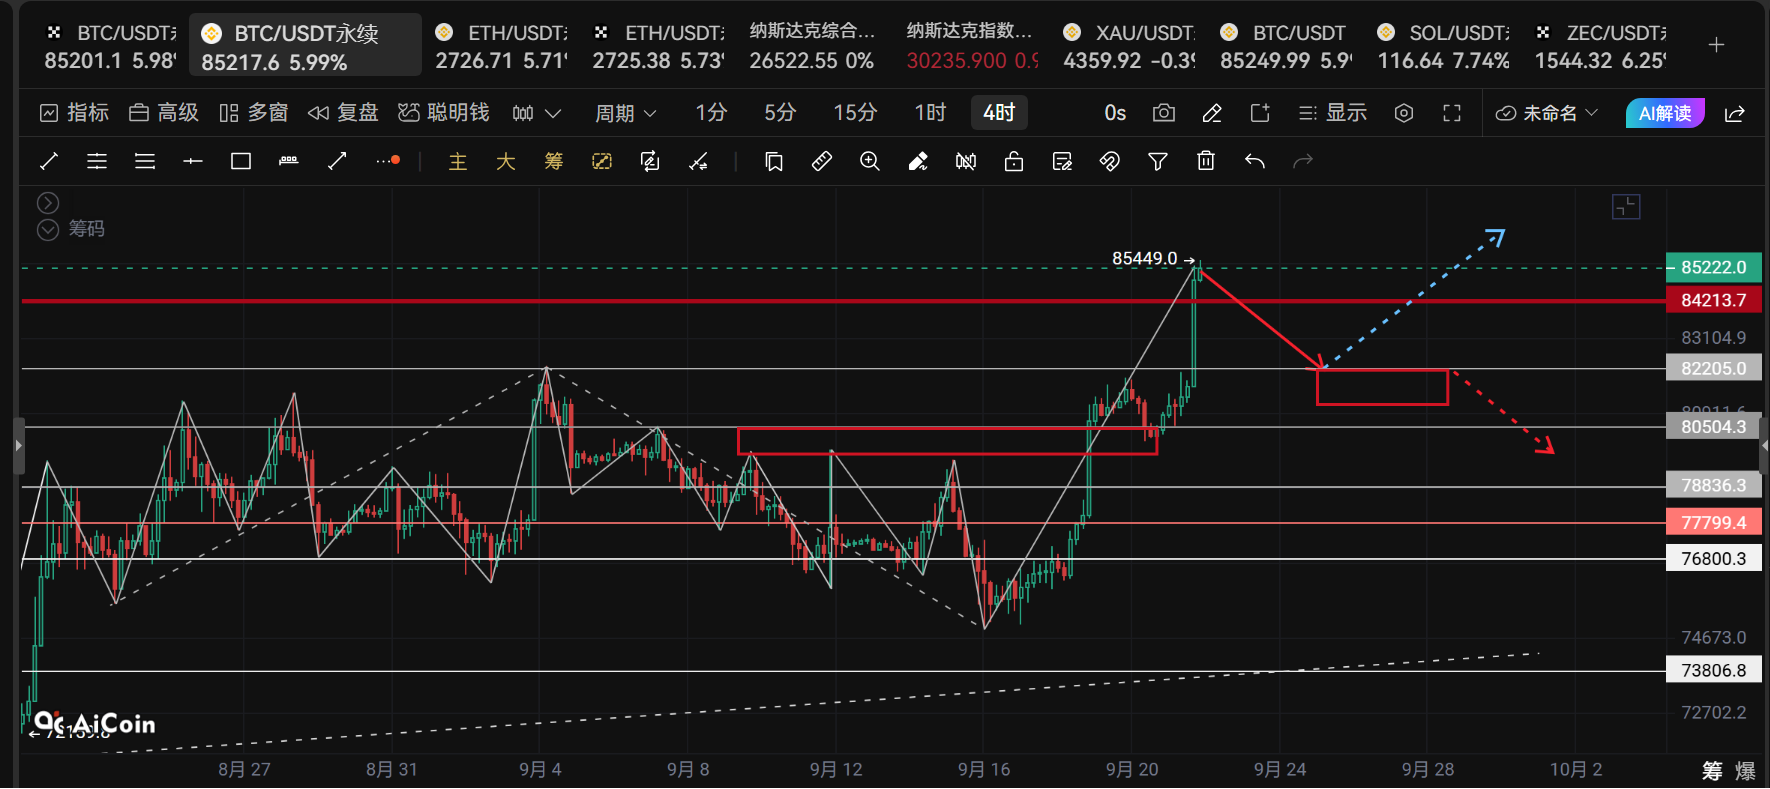
Crypto Circle Academician: 9.22 Ethereum (ETH) high-level speculation, is the trend turning point hidden in the cyclical structure? Latest market analysis reference
Ethereum current price 2735, this bull market level rebound has already gone a long way, the higher the position, the less one should take a heavy position. Especially for friends trading northbound with me, reducing positions and securing profits is the right way to go. Don't casually guess the peak until the trend breaks, but don't ignore risks just because the market is rising sharply. Missing out is not scary; what’s scary is chasing in at high positions, where a single pullback can wipe out a significant amount of principal.
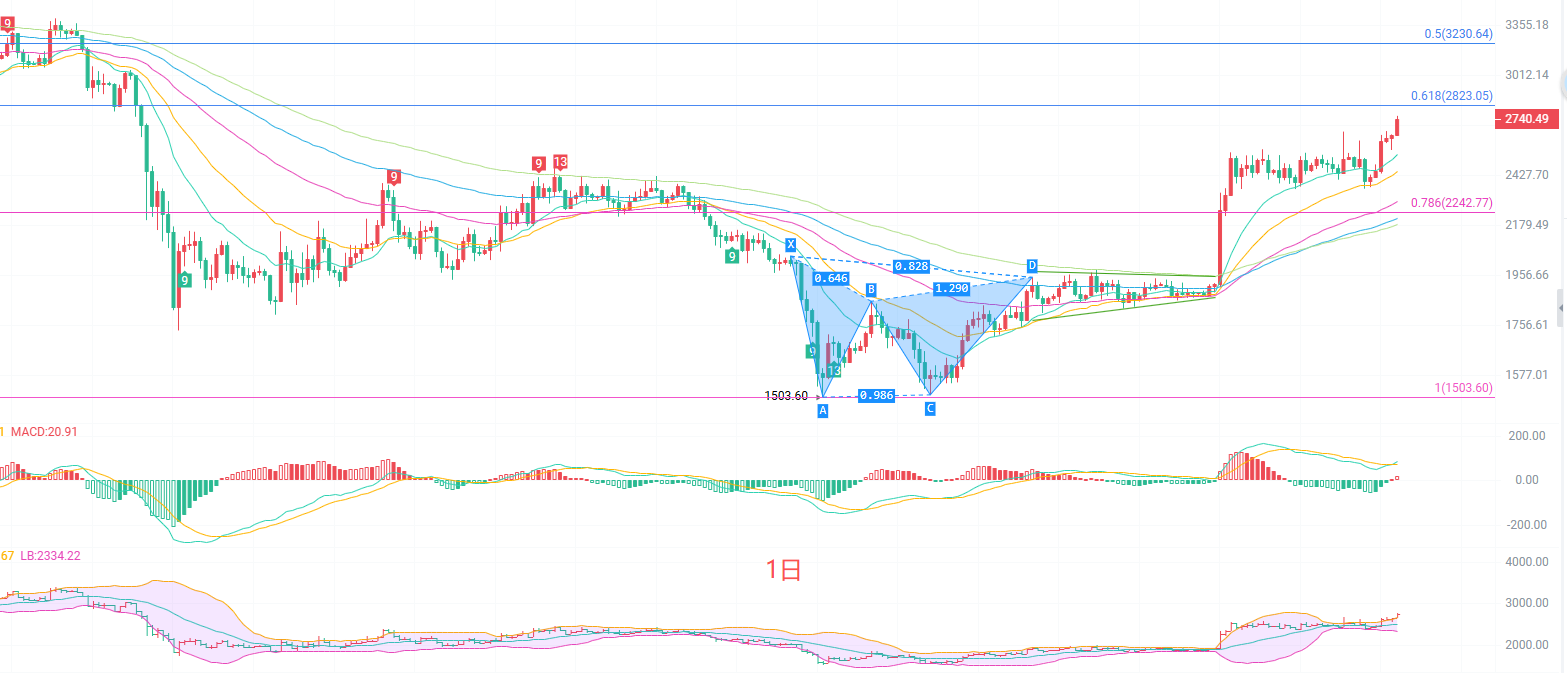
The daily K-line moving average system shows a complete bullish arrangement, with the short-term EMA15 and EMA30 firmly supporting the price, while the medium to long-term EMA60 and EMA90 turning upwards simultaneously, indicating that the long-term trend is intact. The MACD indicator DIF operates above DEA, with bullish strength still prevailing. The Bollinger Bands are opening upwards, with the price closely adhering to the upper band, characteristic of strong upward momentum. However, it should also be noted that after the price continues to operate near the upper band, there is always a need to pull back to the Bollinger middle band around 2506 for digestion and consolidation. On the daily level, this is a strong bullish sentiment, but the overbought status is accumulating, so one should not chase blindly at high prices.
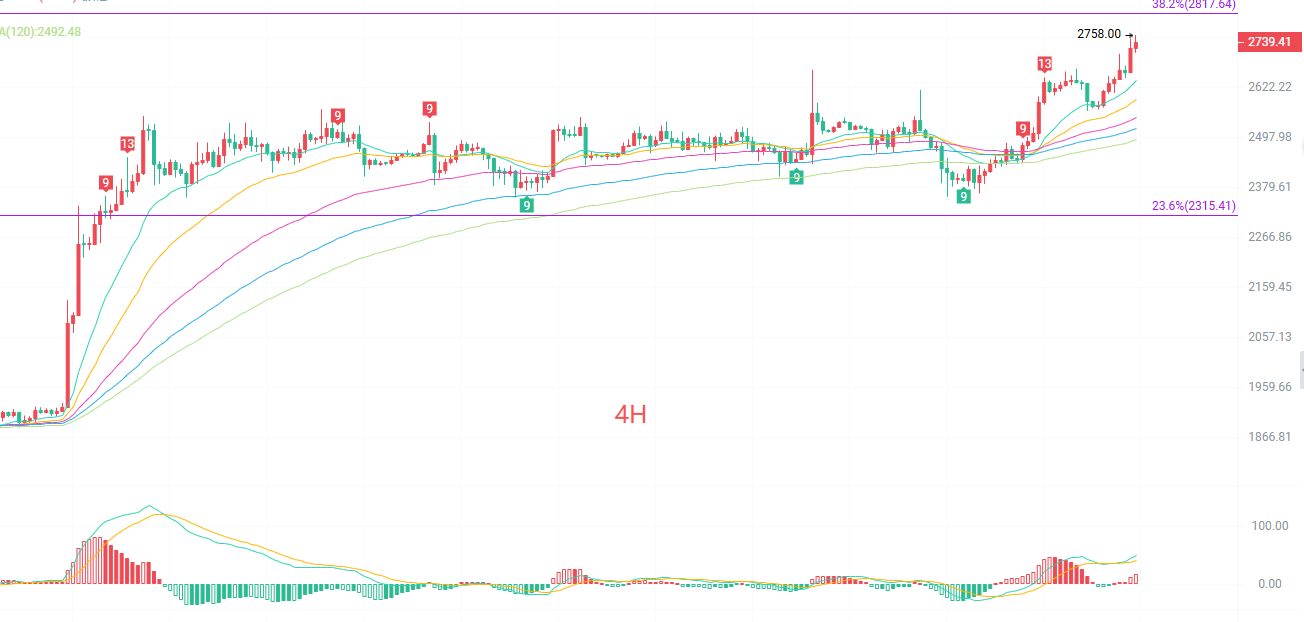
The four-hour K-line moving averages maintain a perfect bullish arrangement, with the short-term EMA continuously acting as support for pullbacks, and every minor retracement can be quickly recovered. The MACD remains above the zero axis; although the red bars have shortened compared to the previous high point, the bullish momentum shows a slight decrease, but no death cross reversal signal has formed. The Bollinger Bands are opening upwards, with the price oscillating near the upper band. It is currently in a high position oscillation phase, with the speed of increase slowing down and the bullish-bearish contest intensifying. Short-term support is at around 2630; if this position holds, the bullish trend will continue; if it breaks effectively, it will trigger a deeper corrective movement.
Short-term reference:
If the lower 2650 to 2620 breaks north, stop loss at 40 points, target 2780 to 2850.
If the upper 2770 to 2800 does not break south, stop loss at 40 points, target 2720 to 2680.
Specific operations should be based on real-time market data. For more information, please consult the author. The article publication might have delays; suggestions are for reference only, and risks are to be borne by oneself.

Warm reminder: The above content is only created by the author's public account. The advertisements at the end of the article and in the comments section are unrelated to the author, please discern carefully. Thank you for reading.
免责声明:本文章仅代表作者个人观点,不代表本平台的立场和观点。本文章仅供信息分享,不构成对任何人的任何投资建议。用户与作者之间的任何争议,与本平台无关。如网页中刊载的文章或图片涉及侵权,请提供相关的权利证明和身份证明发送邮件到support@aicoin.com,本平台相关工作人员将会进行核查。