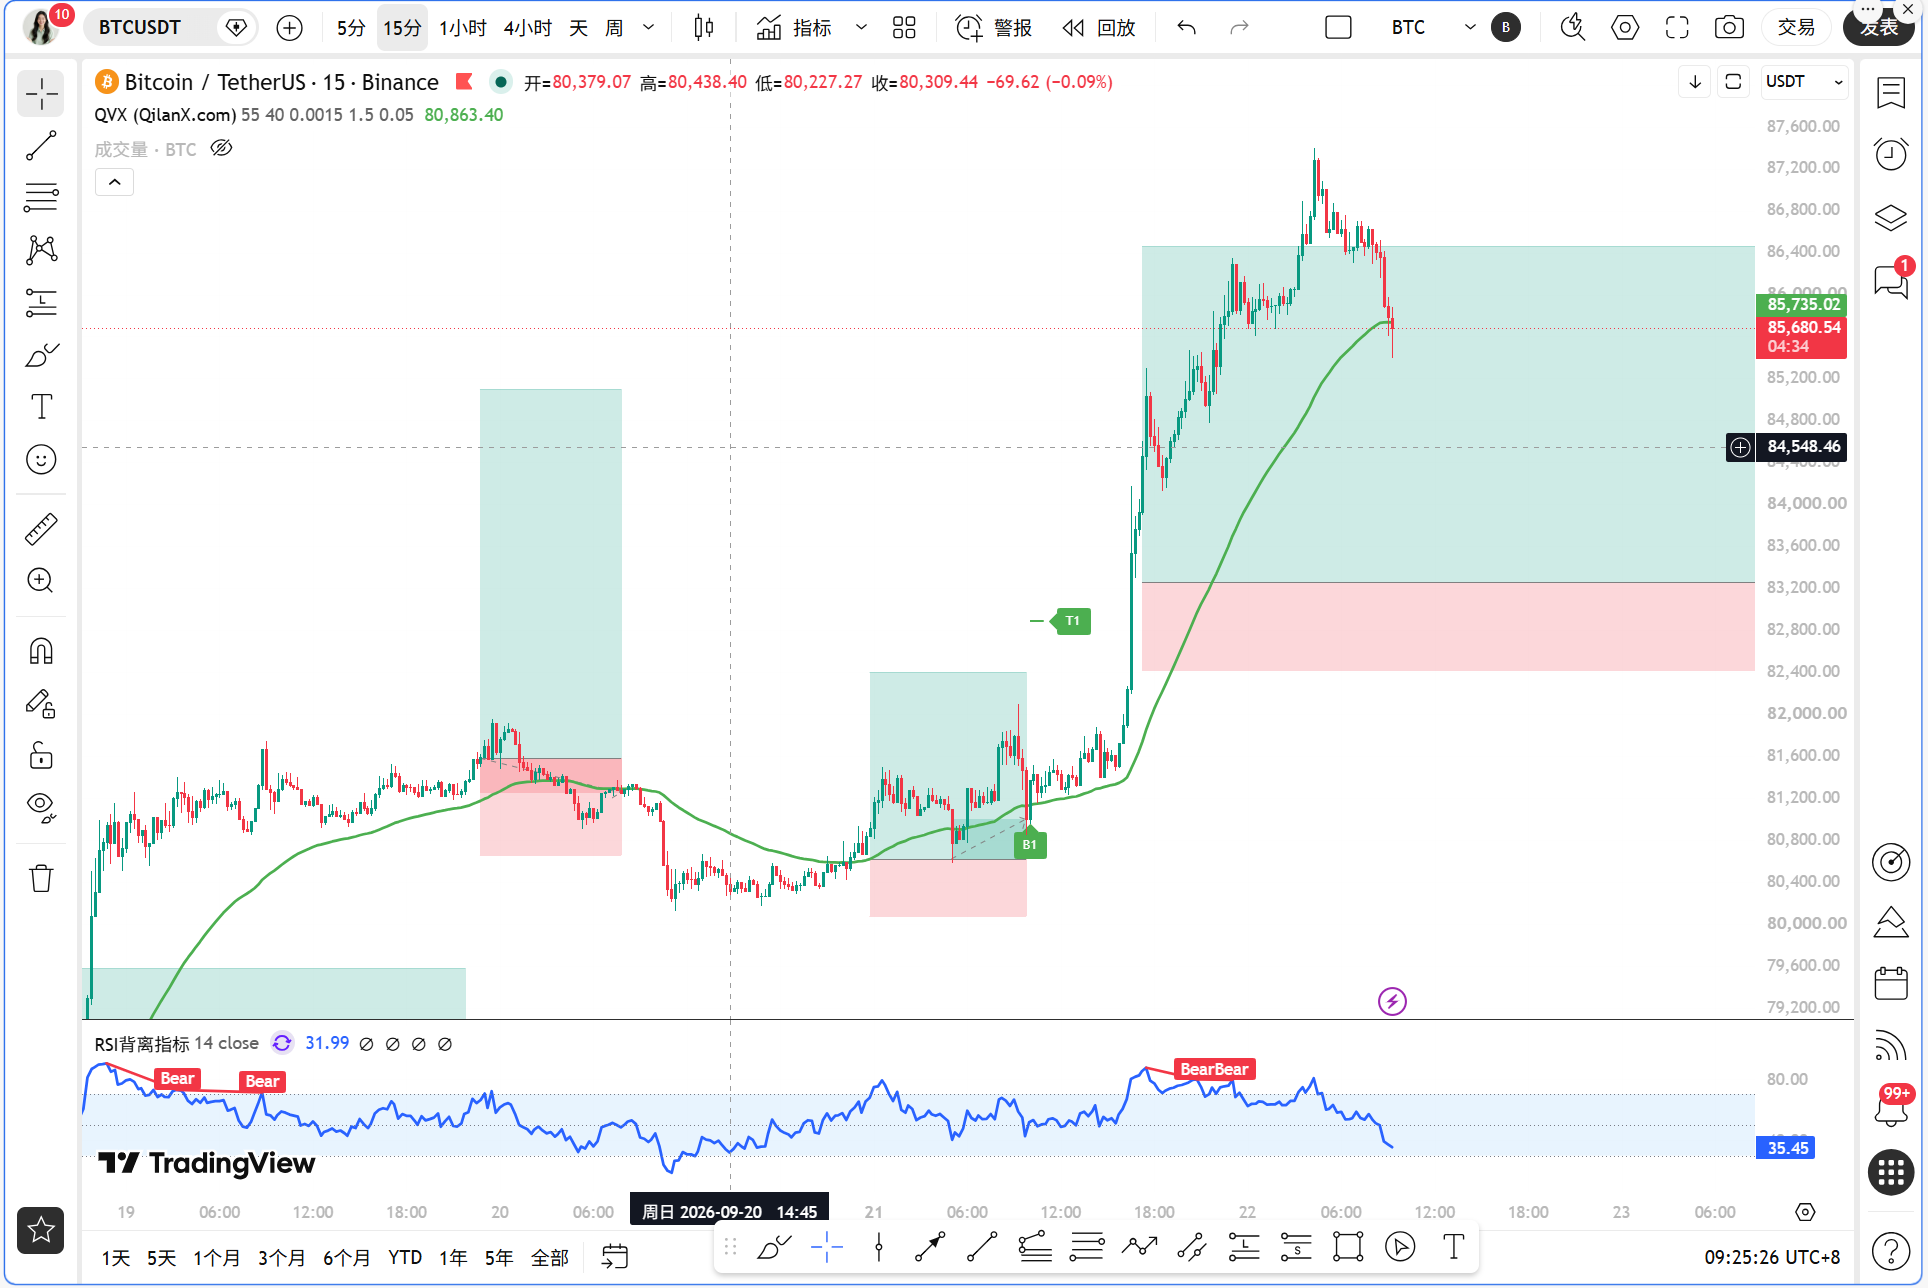
In the past 48 hours, the market has seen a vast amount of information, with both bulls and bears holding significant chips. The most eye-catching development is well-known investor Huang Licheng continuing to increase his positions, pushing his long positions in ETH, BTC, and HYPE to $131 million. Such a substantial amount of real capital going long releases bullish signals that cannot be overlooked. However, at the same time, the Binance security team issued an emergency alert, urging iPhone users to check for FomoPeek, as an iOS vulnerability could steal private keys. This is a typical bearish event in terms of security, and similar incidents historically trigger short-term panic withdrawals and sell-offs. Under the influence of these two forces, the current BTC price is 85,664 USDT, located at a very critical offensive and defensive node. Additionally, PlanB has indicated that Bitcoin's breakout of the 50-week moving average has a target of 89,000 USDT, and the BTC gold ratio has also simultaneously broken through the 50-week moving average, making these two cross-market signals worth paying attention to.
Current Price and Time
The current time is September 22, 09:24, with the latest BTC price at 85,664 USDT, a 24-hour increase of 4.74%, and a market share of 58.84%. The Fear and Greed Index reports 78, indicating an extreme greed zone, which means market sentiment has become highly exuberant, increasing the risk of chasing highs, but the trend inertia still exists.
Multi-Cycle Overview
Daily Level: MA5=83,119.10, MA10=79,889.42, MA30=79,028.99, the moving averages show a standard bullish arrangement. The MACD histogram is 568.16, with DIF=2,278.21 far exceeding DEA=1,710.06, indicating continued bullish momentum. RSI=68.97, approaching but not yet in the overbought area, the overall daily structure is very healthy.
4-Hour Level: MA5=85,917.73, MA10=83,600.12, MA30=80,795.49, the moving averages are also in a bullish arrangement. MACD histogram 445.83, with DIF=1,898.81 higher than DEA=1,452.98, indicating a clear upward trend direction. However, RSI=75.94 has already entered the overbought area, which is a warning signal, meaning there may be a short-term correction need in the 4-hour level.
1-Hour Level: MA5=86,243.27, MA10=86,261.90, MA30=83,966.60. Note that MA5 and MA10 are almost adhering to each other, and the short-term moving averages are beginning to flatten out, which is an early sign of weakening upward momentum. The MACD histogram is -114.57, with DIF=1,103.63 lower than DEA=1,218.21; the 1-hour MACD has already shown a death cross state, with histogram values in the negative. RSI=59.92 is in a neutral but slightly strong area. EMA55=83,367.58, and the current price of 85,664 is well above EMA55.
15-Minute Level: MA5=86,021.06, MA10=86,281.46, MA30=86,423.27, the moving averages show a short-term bearish arrangement, with prices running below the moving averages. The MACD histogram is -143.25, with DIF=-50.79 lower than DEA=92.46, indicating a bearish bias in short-term momentum. RSI=23.86 has deeply entered the oversold area. The oversold condition in the 15-minute level resonates with the death cross in the 1-hour level, indicating short-term retracement pressure; however, the oversold state also implies the possibility of a technical rebound at any time.
TPV Signal Validation
First, let's look at the trend positioning. The current price of 85,664 USDT is far above the 1-hour EMA55 at 83,367.58, with an absolute amplitude of 2.75% from EMA55. Among the past 8 1-hour candlesticks, the count of close prices greater than EMA55 is 8 out of 8, with a crossover count of 0. This set of data is crucial; it clearly tells us that the current situation does not align with the judgment threshold for a fluctuating market, and the market is in a one-sided trend, specifically a bullish trend area. The first core rule of the TPV system has been confirmed: the price stands firmly above the 1-hour EMA55, and there have been 8 consecutive candlesticks without breaking below it, indicating strong support.
Next, let's examine the validation of the three essential conditions for going long. Condition one, the price stands firmly above 1H EMA55, with two consecutive 1-hour candlestick close prices greater than EMA55; this condition is undoubtedly met, and it has been satisfied for 8 consecutive periods, exceeding the minimum requirement by far. Condition two, support stabilization pattern. From the 1-hour candlestick structure, MA30=83,966.60 constitutes mid-term support, while the lower EMA55=83,367.58 is the trend demarcation. The current price has some space from both support lines and has not yet presented a clear long lower shadow or bottom formation signal, indicating that although the trend direction is upward, the current price level is not an ideal entry point due to the lack of near support confirmation. Condition three, depletion of downward momentum. The 1-hour MACD histogram is -114.57, and DIF is below DEA, indicating that momentum has not shown signs of exhaustion and is actually weakening. RSI=59.92 has retreated from a higher level but has not dropped below 30 into the recovery range. Although the 15-minute RSI=23.86 shows oversold conditions, this is a short-term signal and cannot be used alone as an entry basis for the 1-hour level.
In summary, the TPV system currently signals that the trend direction is clearly bullish, but the entry timing is not yet mature. Only the first condition for going long is met, while the shape and momentum conditions still need to wait. This is not a position to act immediately; it requires patience to wait for stabilization signals after a retracement.
On-Chain / Capital Situation
The Fear and Greed Index is 78, indicating extreme greed. This reading can act as a catalyst in trend markets but often serves as a reverse indicator near key resistance levels. BTC's market share is 58.84%, with funds still concentrated in Bitcoin, which provides support for BTC prices. On-chain news shows that a BIT-related address has transferred 1,000 BTC valued at $81.06 million to Binance, and whale deposits into exchanges are typically interpreted as potential sell signals; it is essential to continuously track whether there are more deposit activities. On the other hand, Bitcoin market behavior has shifted from panic selling to buying on dips, with pullbacks seen as buying opportunities, indicating an increase in underlying buying willingness in the market. The SEC has released an exemption for tokenized stock innovations, which is a long-term positive for ecosystems like ETH and other public chains. Geopolitically, the US is preparing to negotiate with Iran, which has eased risk premiums, temporarily suppressing BTC as a safe-haven purchase; however, Trump signed sanctions against Iran and weighed military action, indicating that geopolitical risks have not completely dissipated.
Key Offensive and Defensive Levels
Upper Resistance: The first resistance is in the range of 86,000 to 86,200 USDT, which corresponds to the densely packed moving averages on the 15-minute scale and short-term chip exchange area. The second resistance is 88,000 USDT, corresponding to PlanB's proposed target of 89,000. Stronger resistance is at the integer level of 90,000 USDT.
Lower Support: The first support is near 83,966 USDT, corresponding to the 1-hour MA30. The second support is 83,367 USDT, where the 1-hour EMA55 is located, and is also the TPV system's bullish and bearish boundary, which must not be breached. The third support is 83,119 USDT, corresponding to the daily MA5. If EMA55 is effectively broken, the entire TPV bullish structure will be destroyed, necessitating a decisive shift in mindset.
Trading Thoughts
Direction: The bullish trend area, primarily using pullbacks to go long, do not short against the trend.
Entry Conditions: Do not chase the long at the current price of 85,664. Wait for the price to pull back to the range of 83,966 to 84,300 USDT, and observe whether there is a long lower shadow, bottom formation, or volume stagnation signal at the 1-hour level. At the same time, it requires the 1-hour MACD histogram to shorten for two consecutive cycles, or RSI to rebound from a low position. After all three conditions are simultaneously met, enter long after confirmation with a close of the 1-hour candlestick. If the price directly breaks through 86,200 with volume and stabilizes, one may also pursue long on a confirmed pullback, but the position should not exceed 50% of the normal position size.
Stop Loss: Set the stop loss for the long entry between 1% to 1.5% below EMA55, specifically referring to the range of 82,800 to 82,500 USDT. If the price closes below EMA55 and fails to recover for two consecutive 1-hour candlesticks, exit unconditionally.
Target Levels: The first target is 88,000 USDT, and the second target is in the range of 89,000 to 90,000 USDT. After reaching the first target, you can reduce the position size by half, and for the remaining position, move the stop loss to the entry price to aim for the second target.
Risk Warning
Extreme greed combined with the 4-hour RSI being overbought; if the iOS vulnerability incident escalates and triggers panic withdrawals, it may lead to a sharp short-term decline. Strictly enforce stop-loss discipline.
Follow Qinglan Crypto Classroom to seize more trading opportunities together! Welcome to visit the official website www.qinglan.org
📊 Qinglan TPV Trading Strategy Backtest Reference
🕒 Last Backtest Time 09-22 07:00:01
Total Analysis: 4,138 Backtests: 4,138 Accuracy Rate: 78.6% (3,251/4,138)
免责声明:本文章仅代表作者个人观点,不代表本平台的立场和观点。本文章仅供信息分享,不构成对任何人的任何投资建议。用户与作者之间的任何争议,与本平台无关。如网页中刊载的文章或图片涉及侵权,请提供相关的权利证明和身份证明发送邮件到support@aicoin.com,本平台相关工作人员将会进行核查。