Author: Flow Brief by Alea Research
Translator: Deep Tide TechFlow
Deep Tide Introduction: Derive has collected 360 million dollars in option premiums in just nine months this year, capturing nearly 90% of the on-chain options market, with perpetual contracts contributing 40% of the fees. More crucially, it has consistently outperformed new issuance in buybacks for nine consecutive months, which is quite rare in the on-chain derivatives arena that relies on issuing tokens to survive: a 158% increase in a week is not without reason. For those observing the DeFi options track, this article clarifies "why only it has survived."
Premiums increased by 191.9% to 362.5 million dollars, perpetual contracts contributed 40% of fees, and buybacks outpaced issuances for nine consecutive months
Derive has collected 362.5 million dollars in option premiums this year. This accounts for 87.4% of the total premiums in the on-chain options market, rising 191.9% compared to the full year of 124.2 million dollars in 2025. On September 17, the price of DRV reached a historic high of 0.2877 dollars. By Saturday, the price had risen to 0.3857 dollars (circulating market cap of 385 million dollars; fully diluted valuation of 577 million dollars), an increase of 158% in a week. Coinbase spent 2.9 billion dollars to acquire Deribit in May 2025.
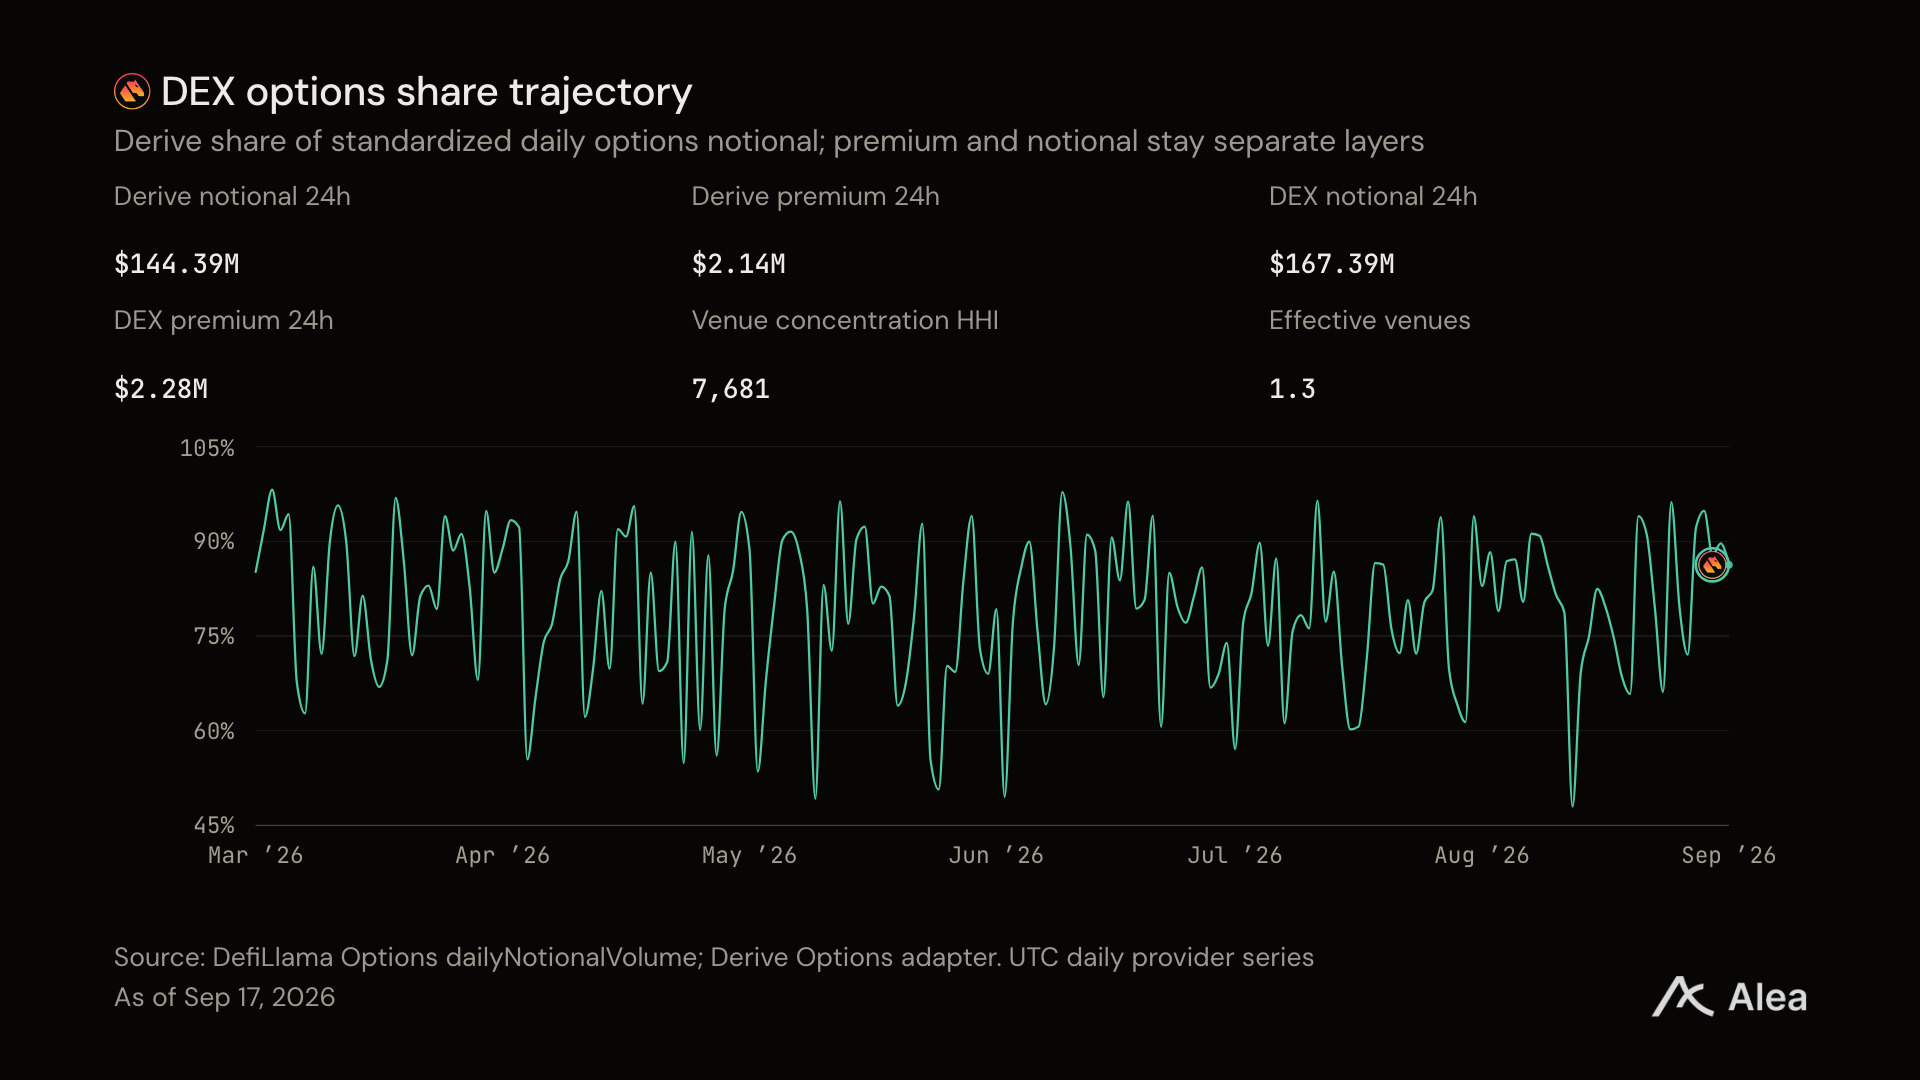
Figure: Derive's share of the on-chain options premiums has remained stable at over 80% since spring.
Derive has completely taken over the on-chain options space. This year, the total on-chain options premium was 414.9 million dollars, of which Derive took 362.5 million, while it only had 124.2 million for the entire year of 2025.
The room above is Deribit. Derive trades options worth 162.6 million dollars in a day, while all trading venues with publicly available data combined traded 7.74 billion.
Perpetual contracts are not a supporting role. They earned 4.51 million dollars in fees this year, of which 1.76 million accounted for 39.1%, surpassing the options business in February.
Fees reached holders through buybacks. This trading venue retained 3.37 million dollars from the 4.51 million dollars in fees, with 35% used for buying back DRV, destroying 16.6 million tokens this year, while only 6.1 million tokens were issued as staking rewards.
Option fee rates decreased from 2.94 cents for every 100 dollars traded to 1.27 cents, yet the market has revalued its earnings multiple from 22.5 times to 48.7 times.
Derive's year of no longer sharing with others
In January, there were several trading venues for on-chain options. Now there is only one left, and the second place is so close it can no longer be called competition.
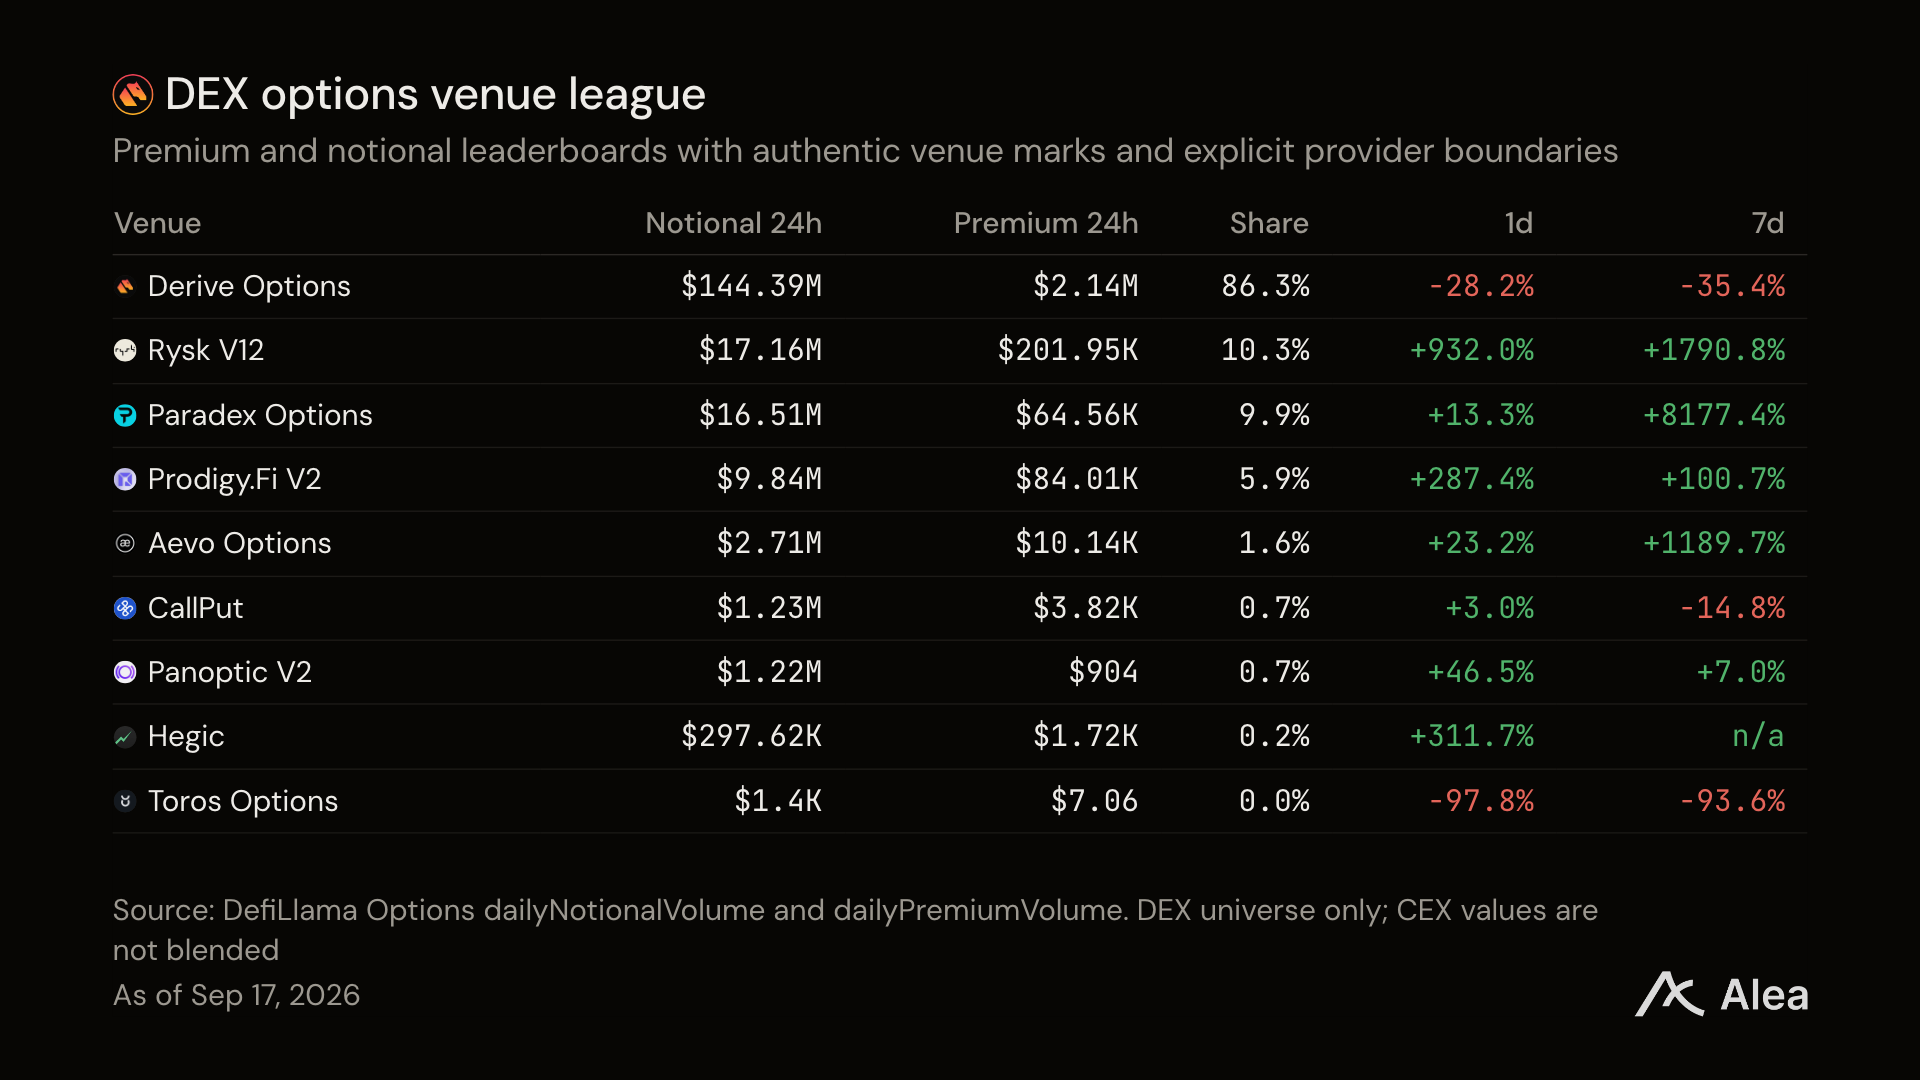
Figure: Ranking of each on-chain options trading venue based on premiums collected this year, in dollars.
Deribit traded options worth 3.56 billion dollars in a day, while Derive only reached 162.6 million, nearly a 22-fold difference.
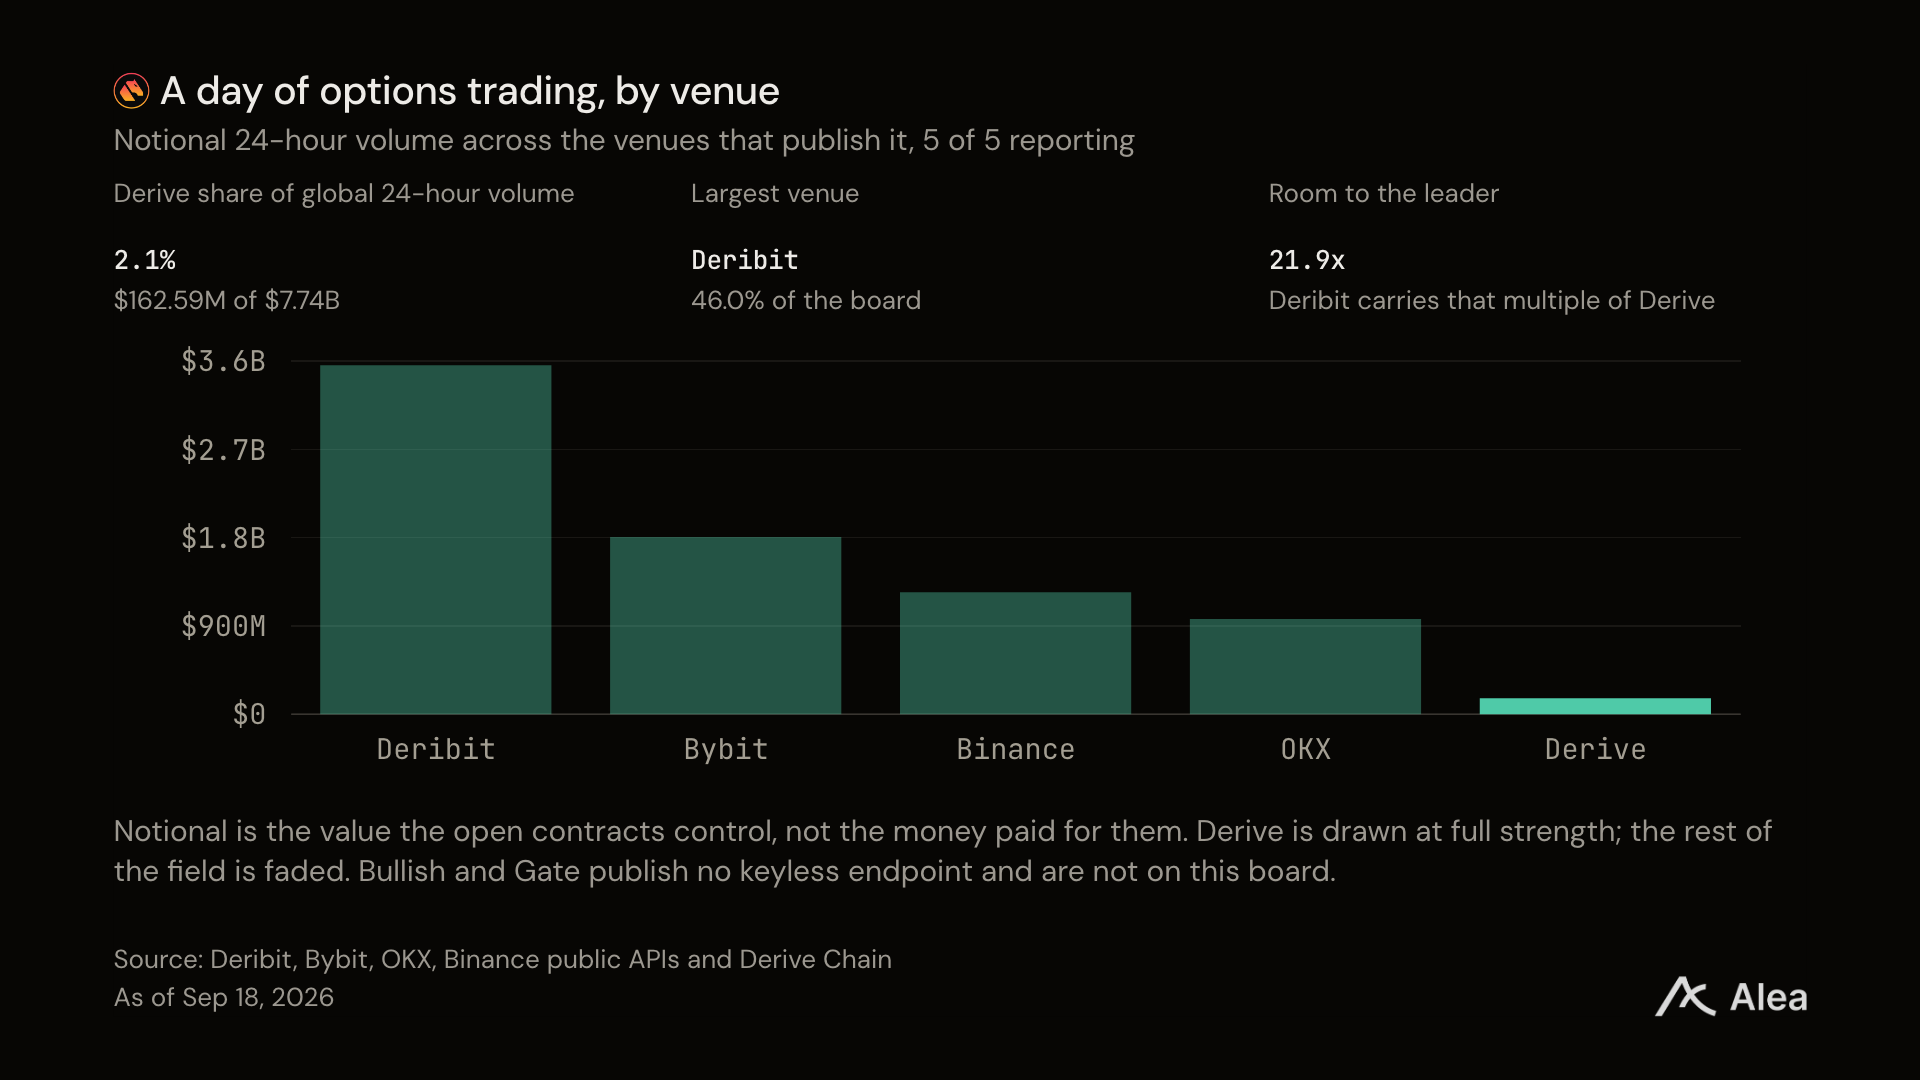
Figure: Daily trading volume by trading venue, calculated in dollar value of assets controlled by contracts. Derive accounted for 162.6 million of the total of 7.74 billion.
Open interest tells the same story. Derive holds a position worth 1.59 billion dollars in an overall market of 50.22 billion dollars, accounting for 3.2%. Deribit alone accounts for 78.8%.
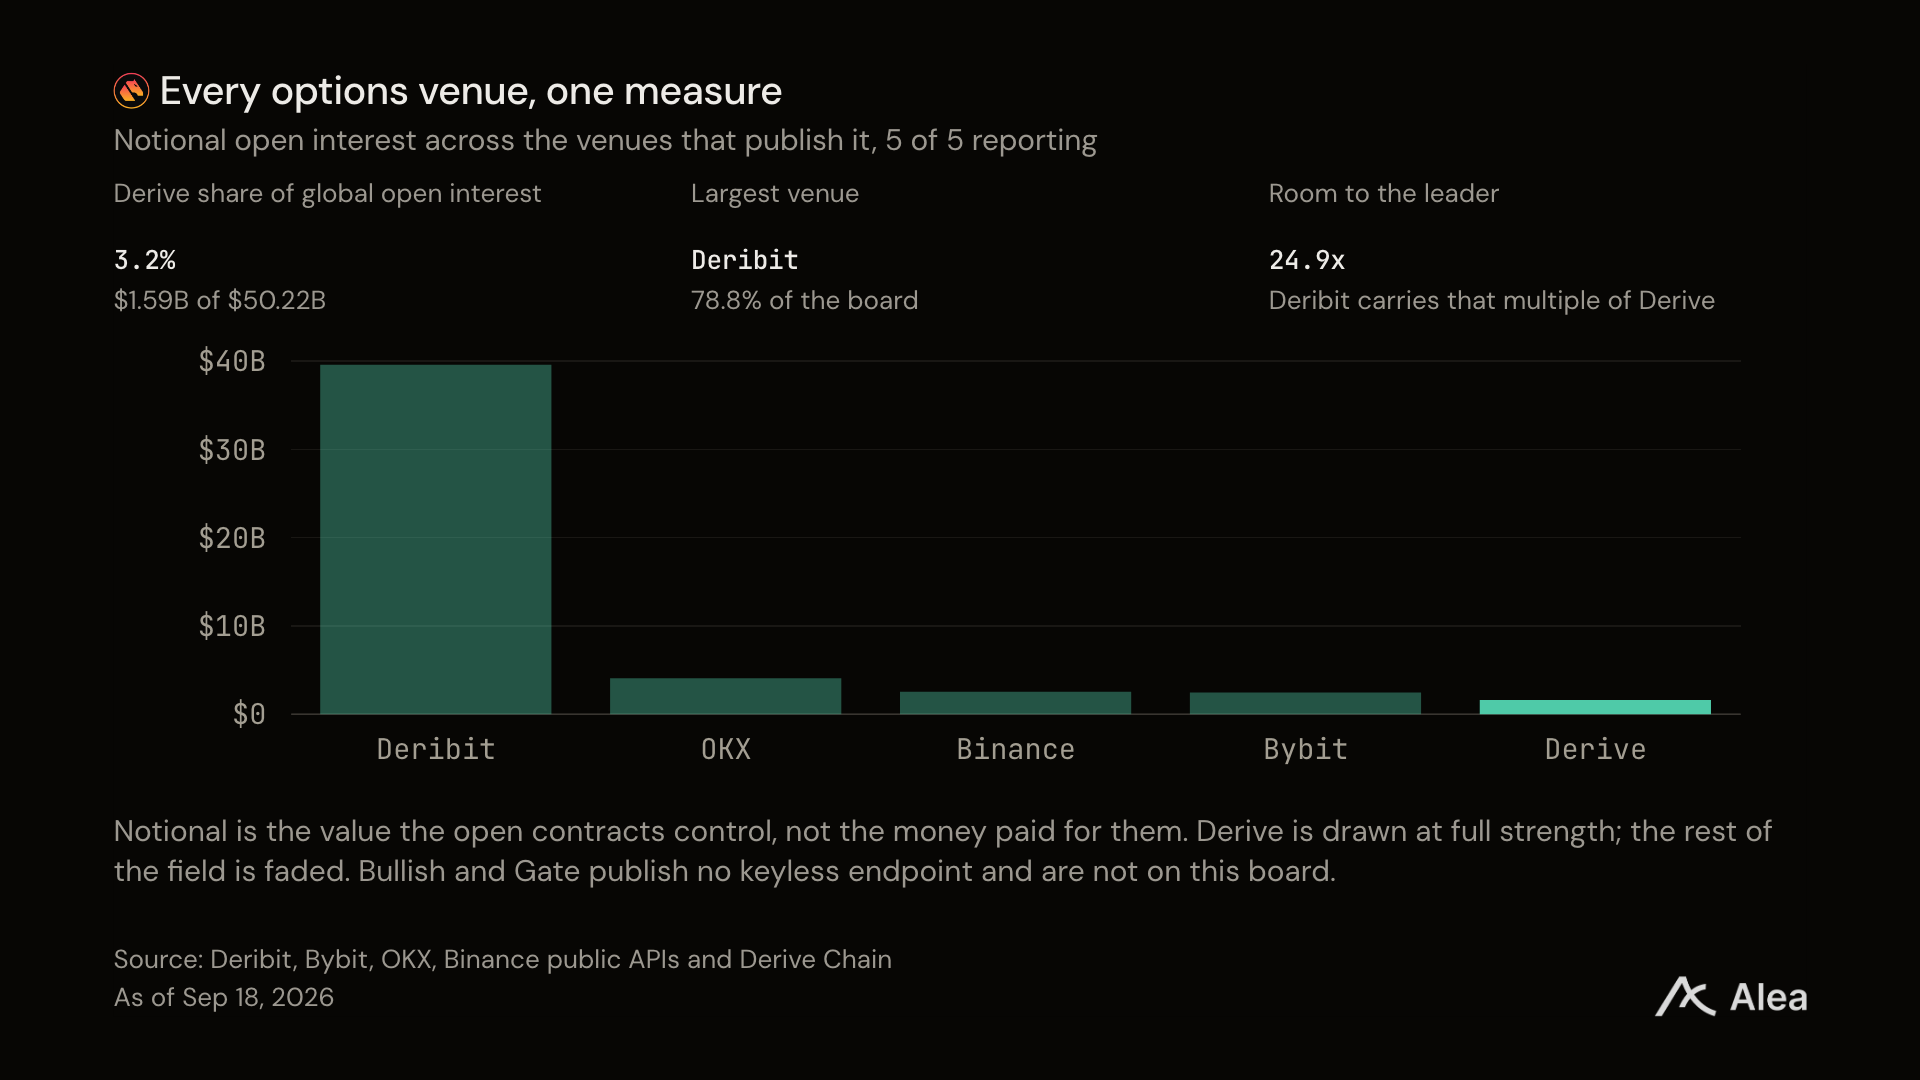
Figure: Nominal open interest ranked by trading venue, in dollars.
Three times last year's performance in nine months
Premiums represent the money paid by buyers, indicating how much a trading venue has been used. Nominal trading volume rose from 5.38 billion to 12.46 billion.
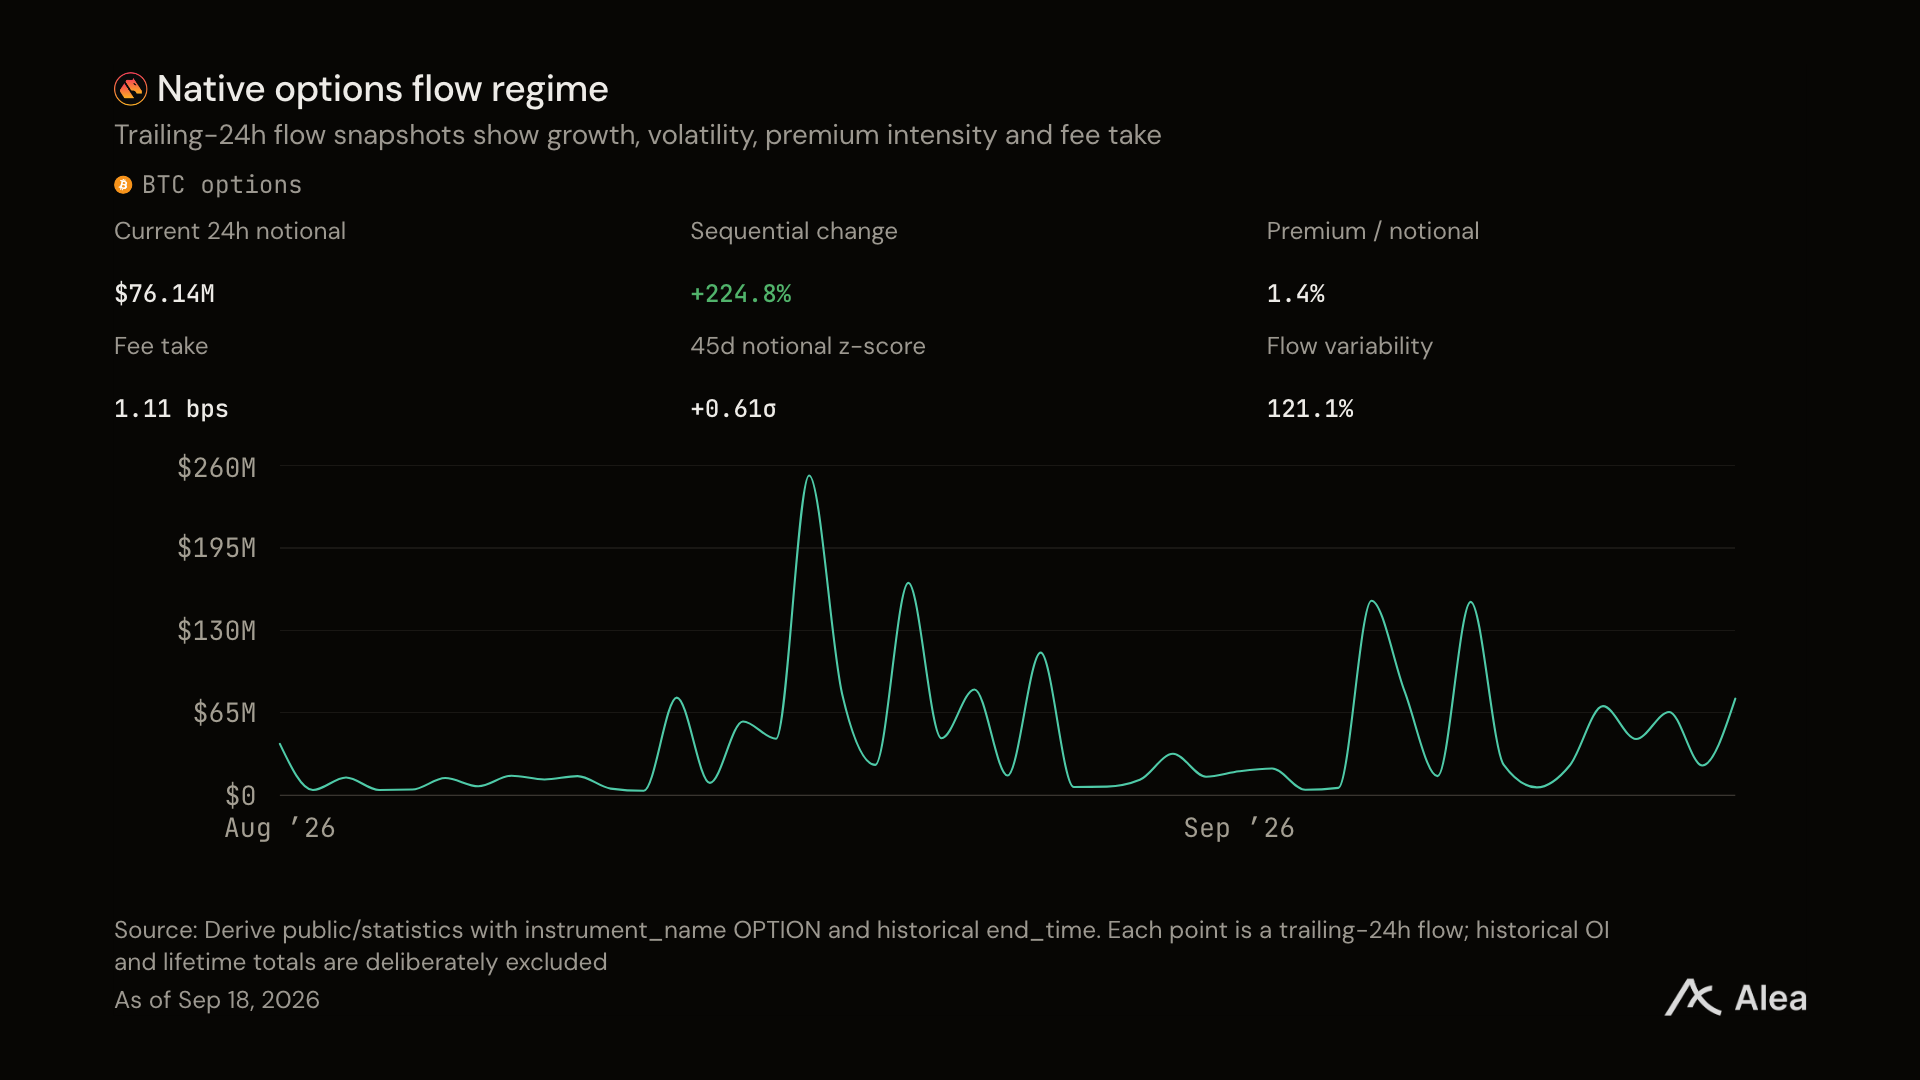
Figure: Monthly native option flow of Derive, in dollars.
Buyers have taken on more exposure, and for every dollar of exposure, they paid more money.
How much is a dollar of exposure worth
The premium divided by nominal volume indicates the proportion of an option price to the exposure it controls. The longer the term, the closer the strike price is to the current price, and the greater the market's expected price volatility, the higher this ratio will be.
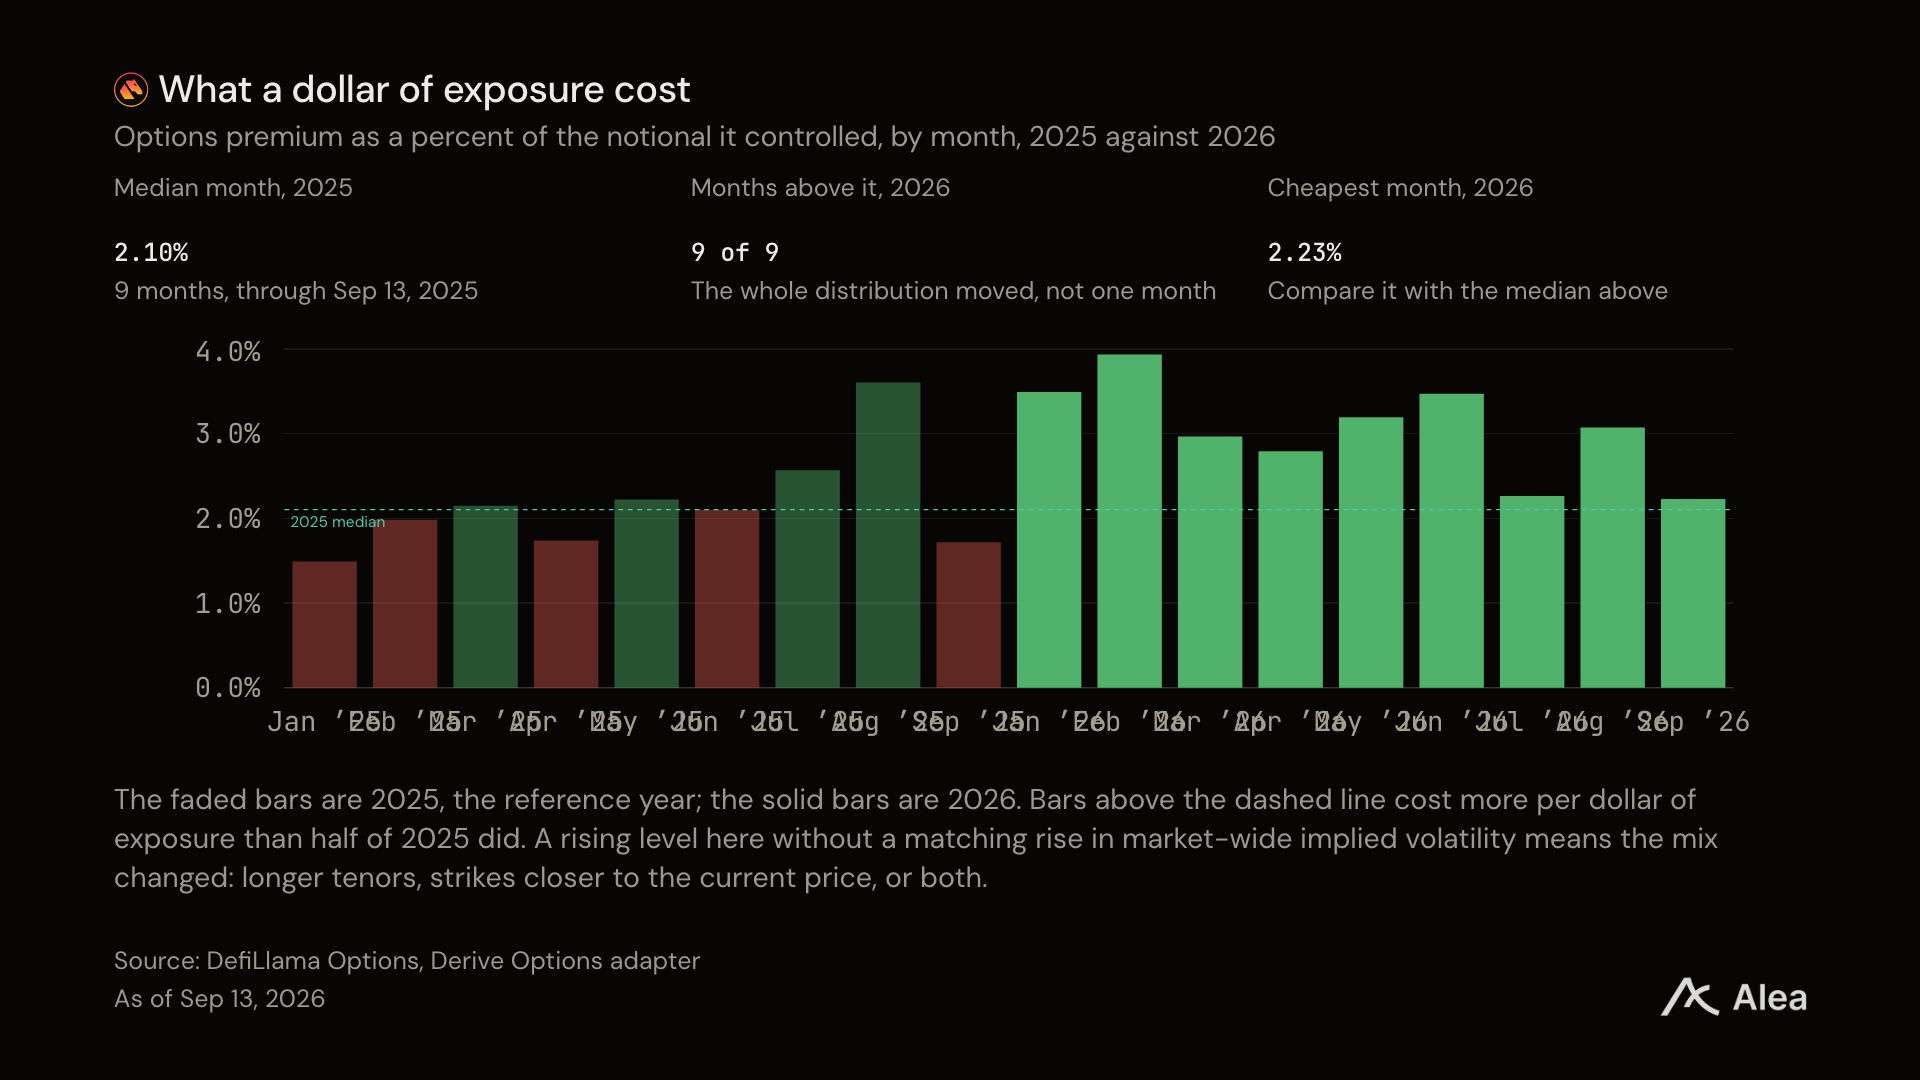
Figure: Each bar represents a month's premium as a percentage of its controlled nominal volume.
All nine months of 2026 exceeded the median of 2.10% in 2025, with even the cheapest month at 2.23%. During the same period, the 30-day implied volatility decreased by 7.0%. Buyers paid more for every dollar of exposure when volatility fell.
This indicates more options with longer terms and strike prices closer to the current price. Derive is being used as Deribit.
Comparison of its quotes with the room above
Before switching venues, traders just want one number: how much the same risk costs in two places.
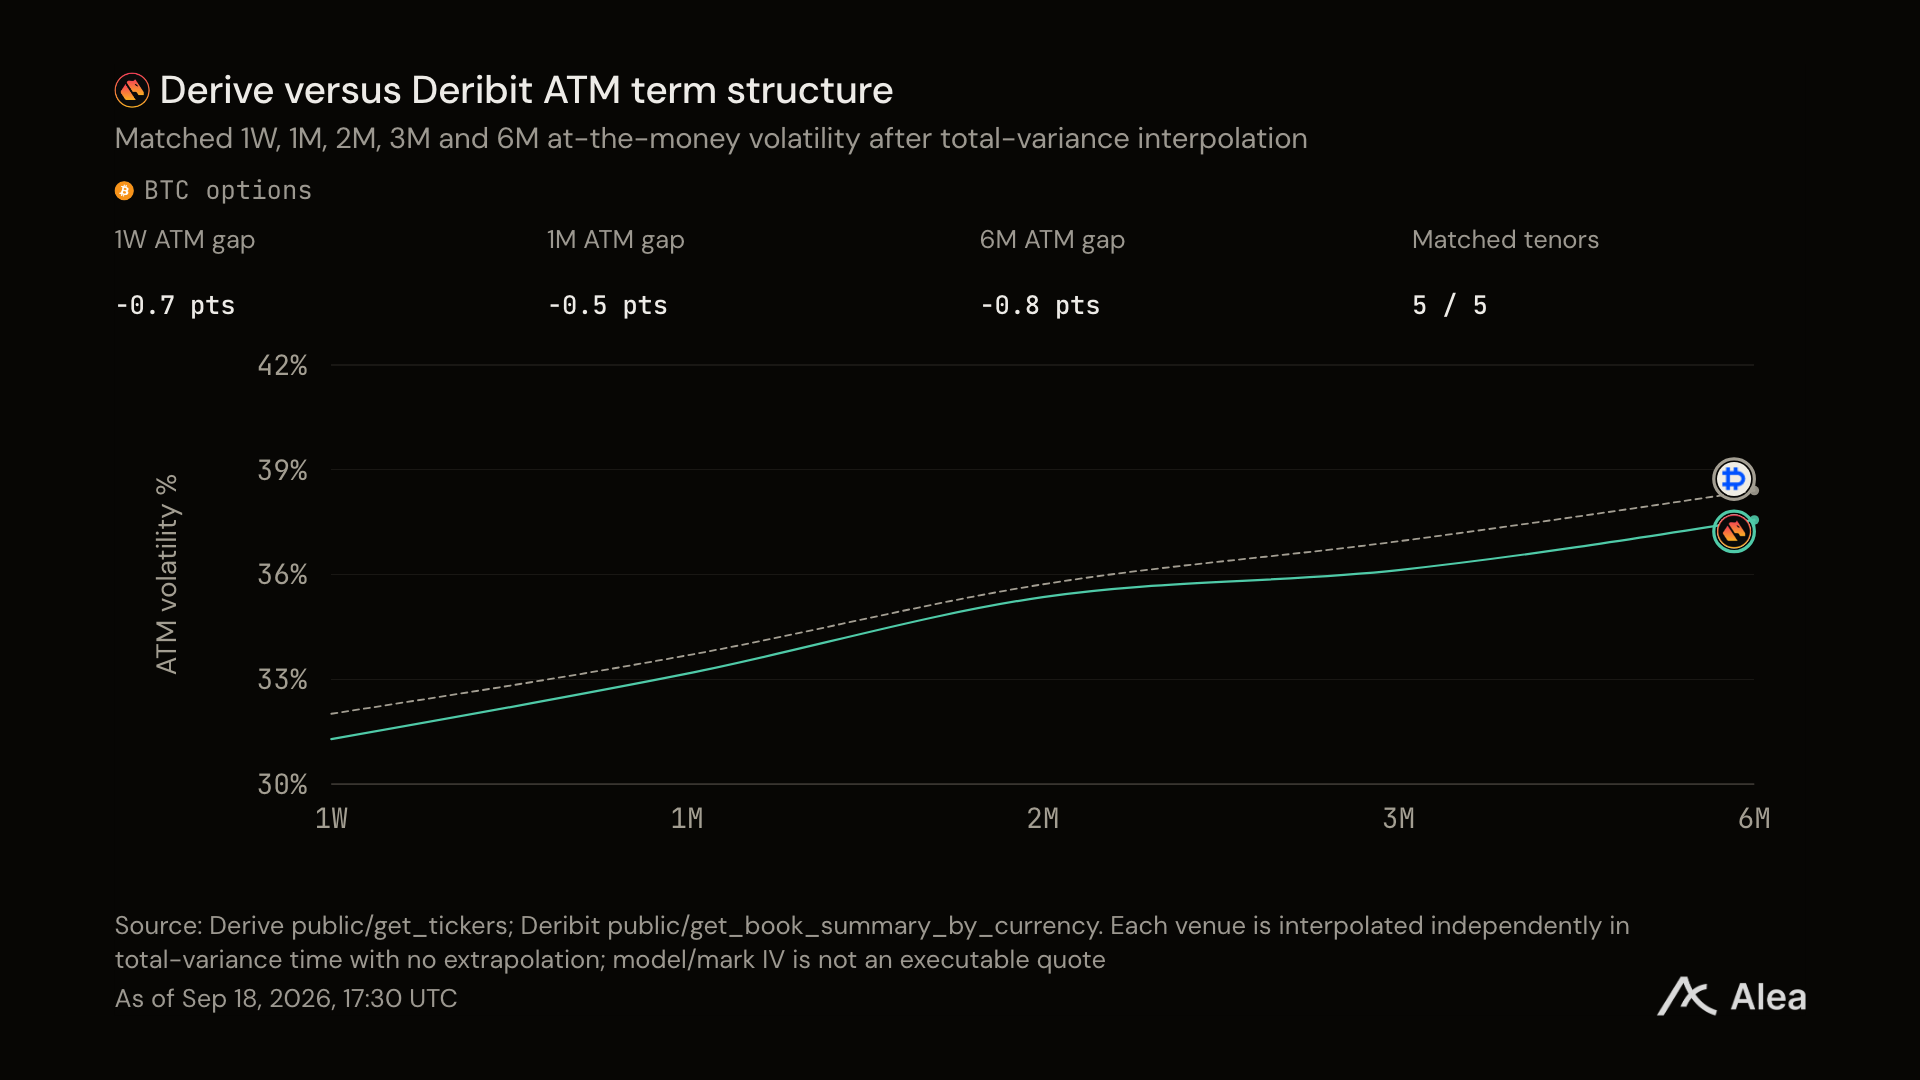
Figure: At-the-money implied volatility by expiration date, in percentage, Derive vs Deribit.
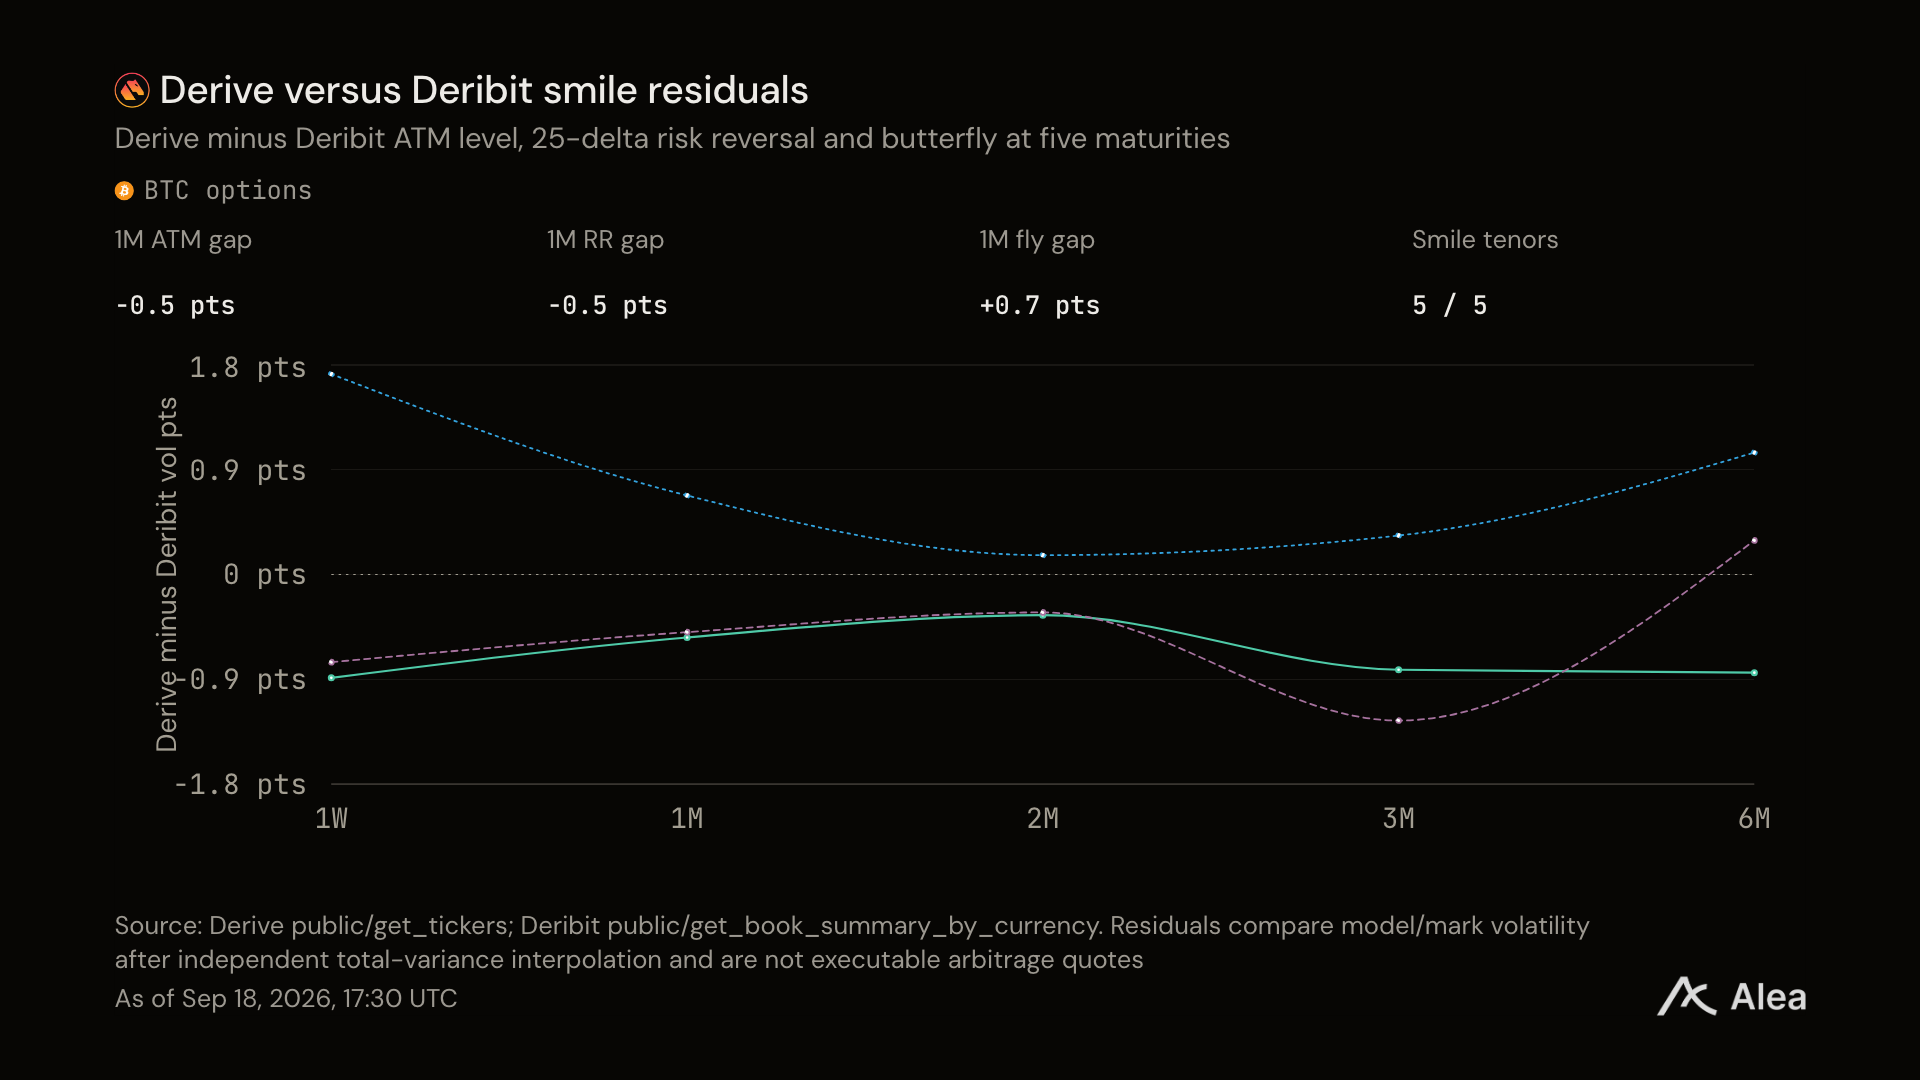
Figure: Difference in implied volatility at the same strike price between the two trading venues, in percentage points, covering all expiration dates quoted on September 17.
Quotations are only half the story. The other half is how much it costs to execute the cross-price spread.
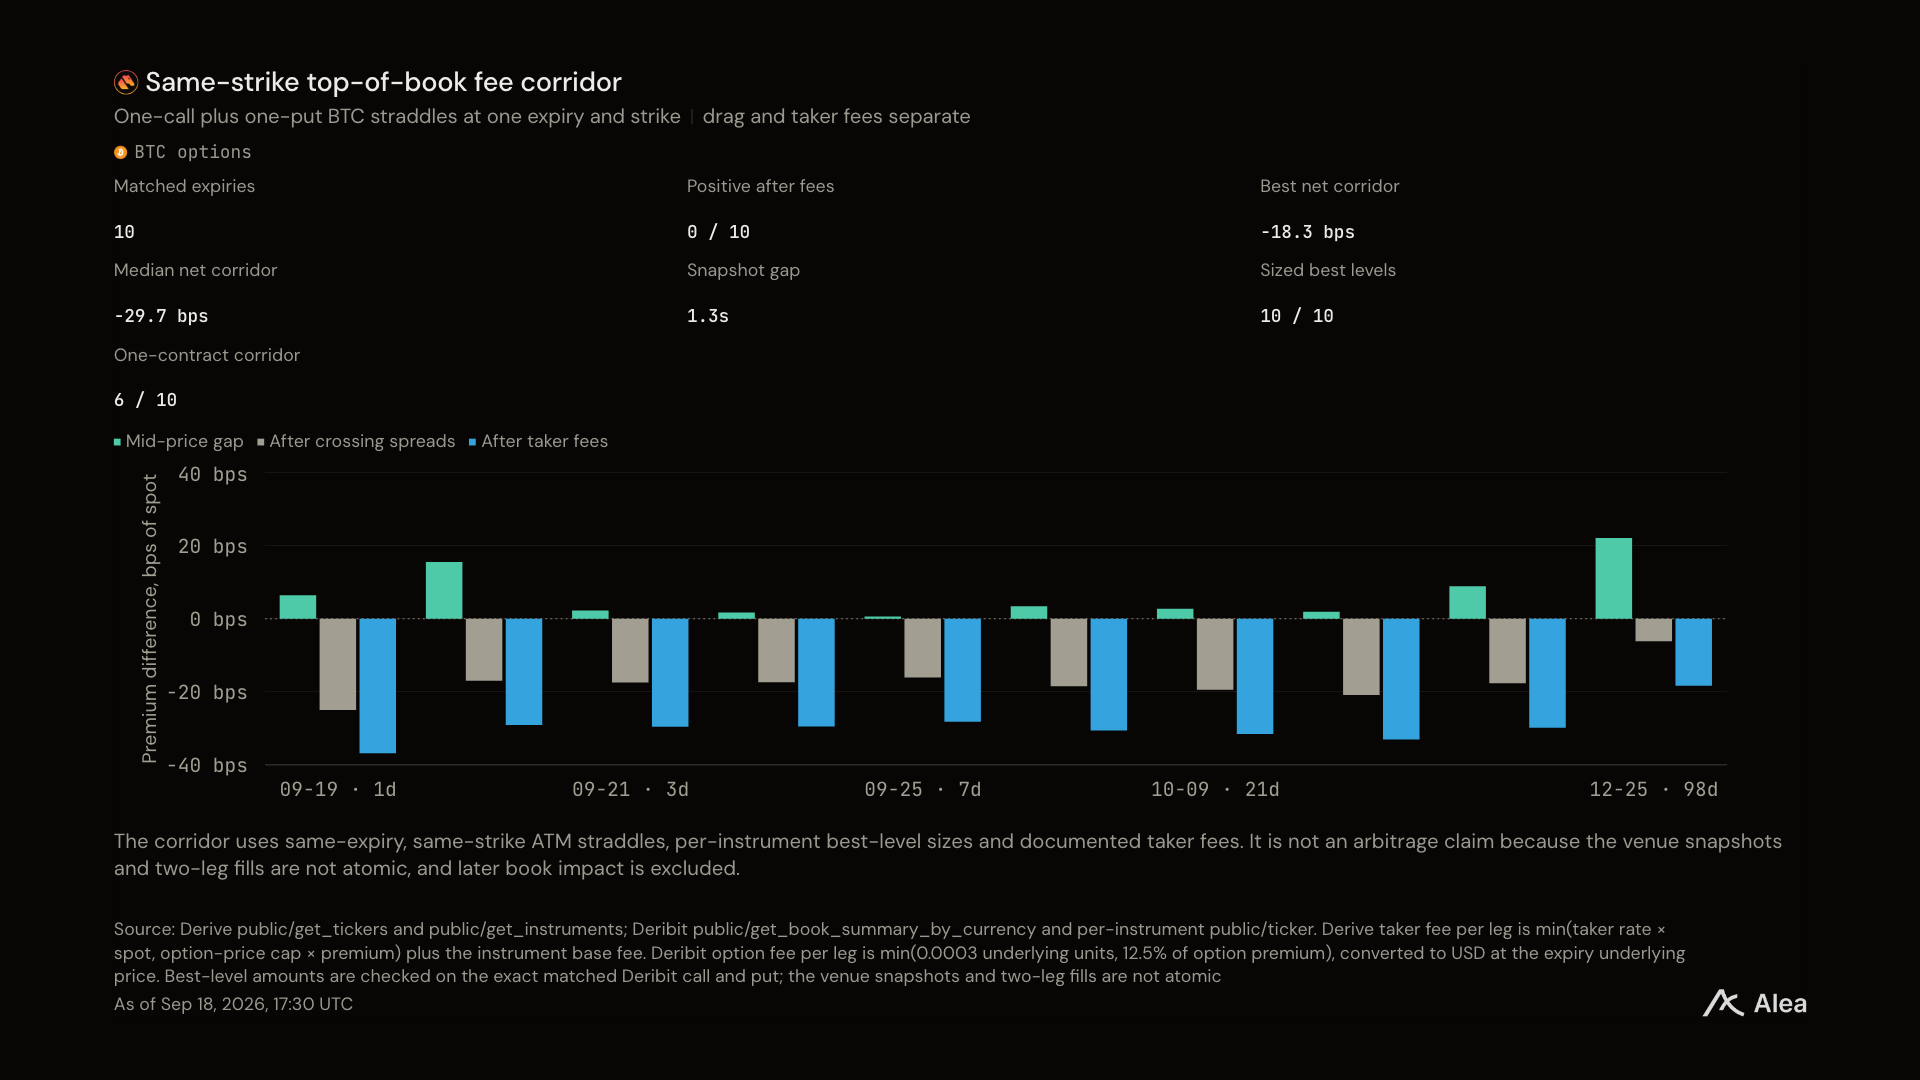
Figure: Cost of executing at the best price on the same strike price in both trading venues, in cents per 100 dollars.
Have sellers been compensated for taking on risk?
Implied volatility is what buyers pay for volatility. Realized volatility is the actual volatility that occurs. The difference between the two reflects the year of options sellers: implied volatility decreased by 7.0% throughout the year.
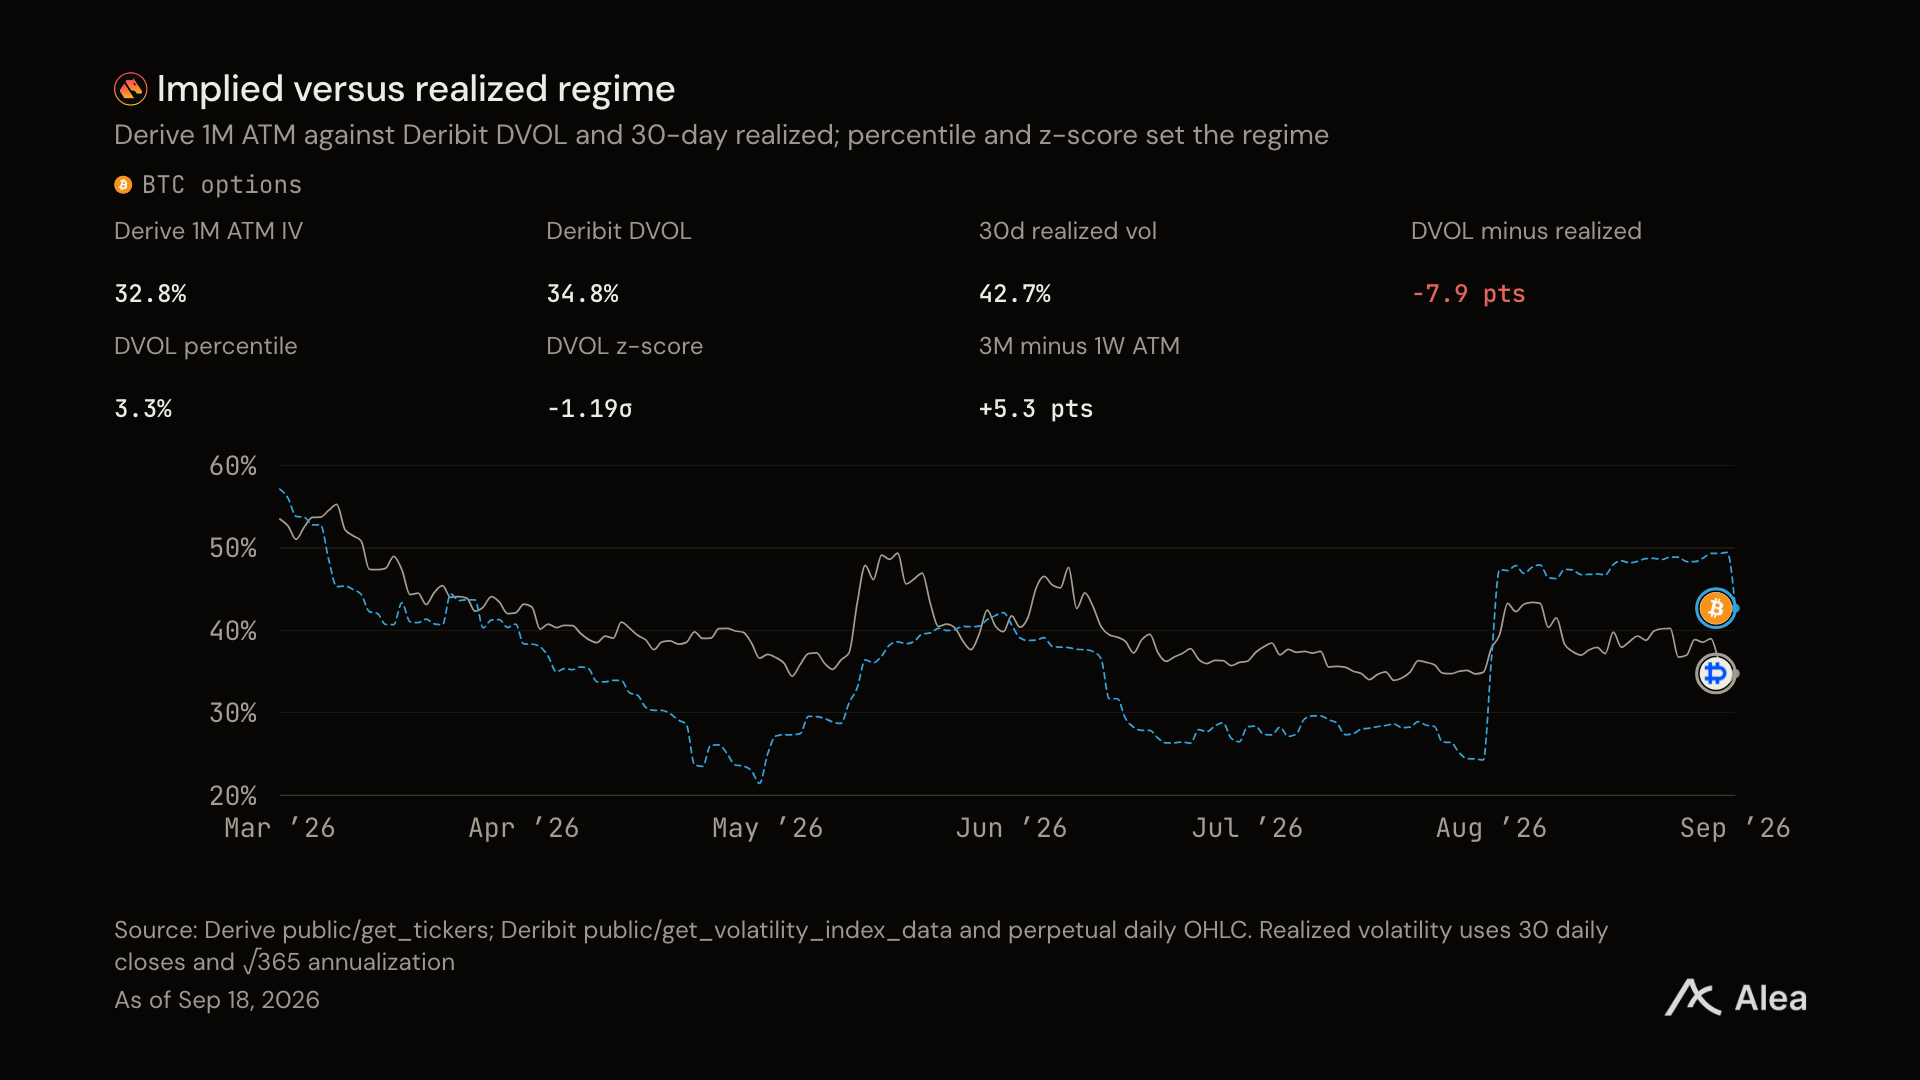
Figure: One month implied volatility vs 30-day realized volatility, in percentage.
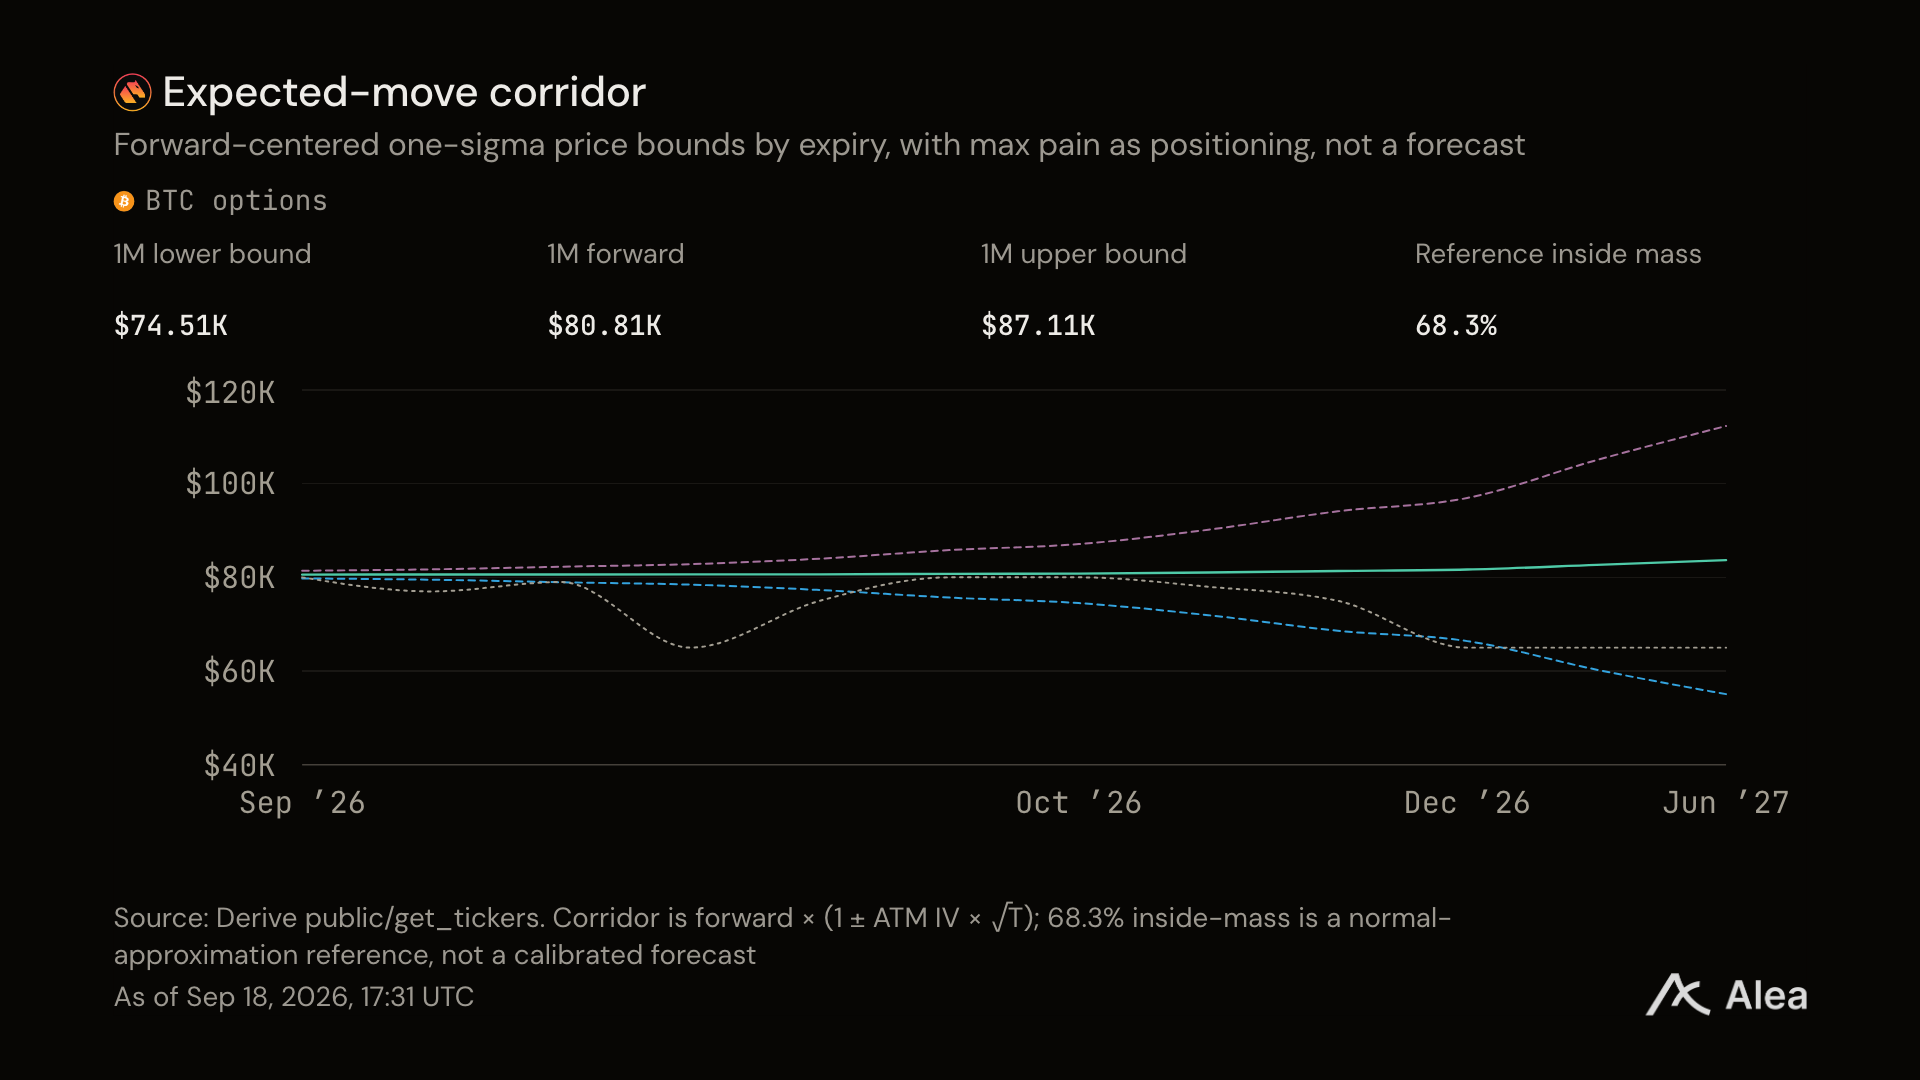
Figure: The curve represents the volatility extent priced for each expiration date, in dollars.
What does the ledger contain?
Open interest represents the dollar value of positions that are still open. People just passing through trading venues look different from those placing positions there.
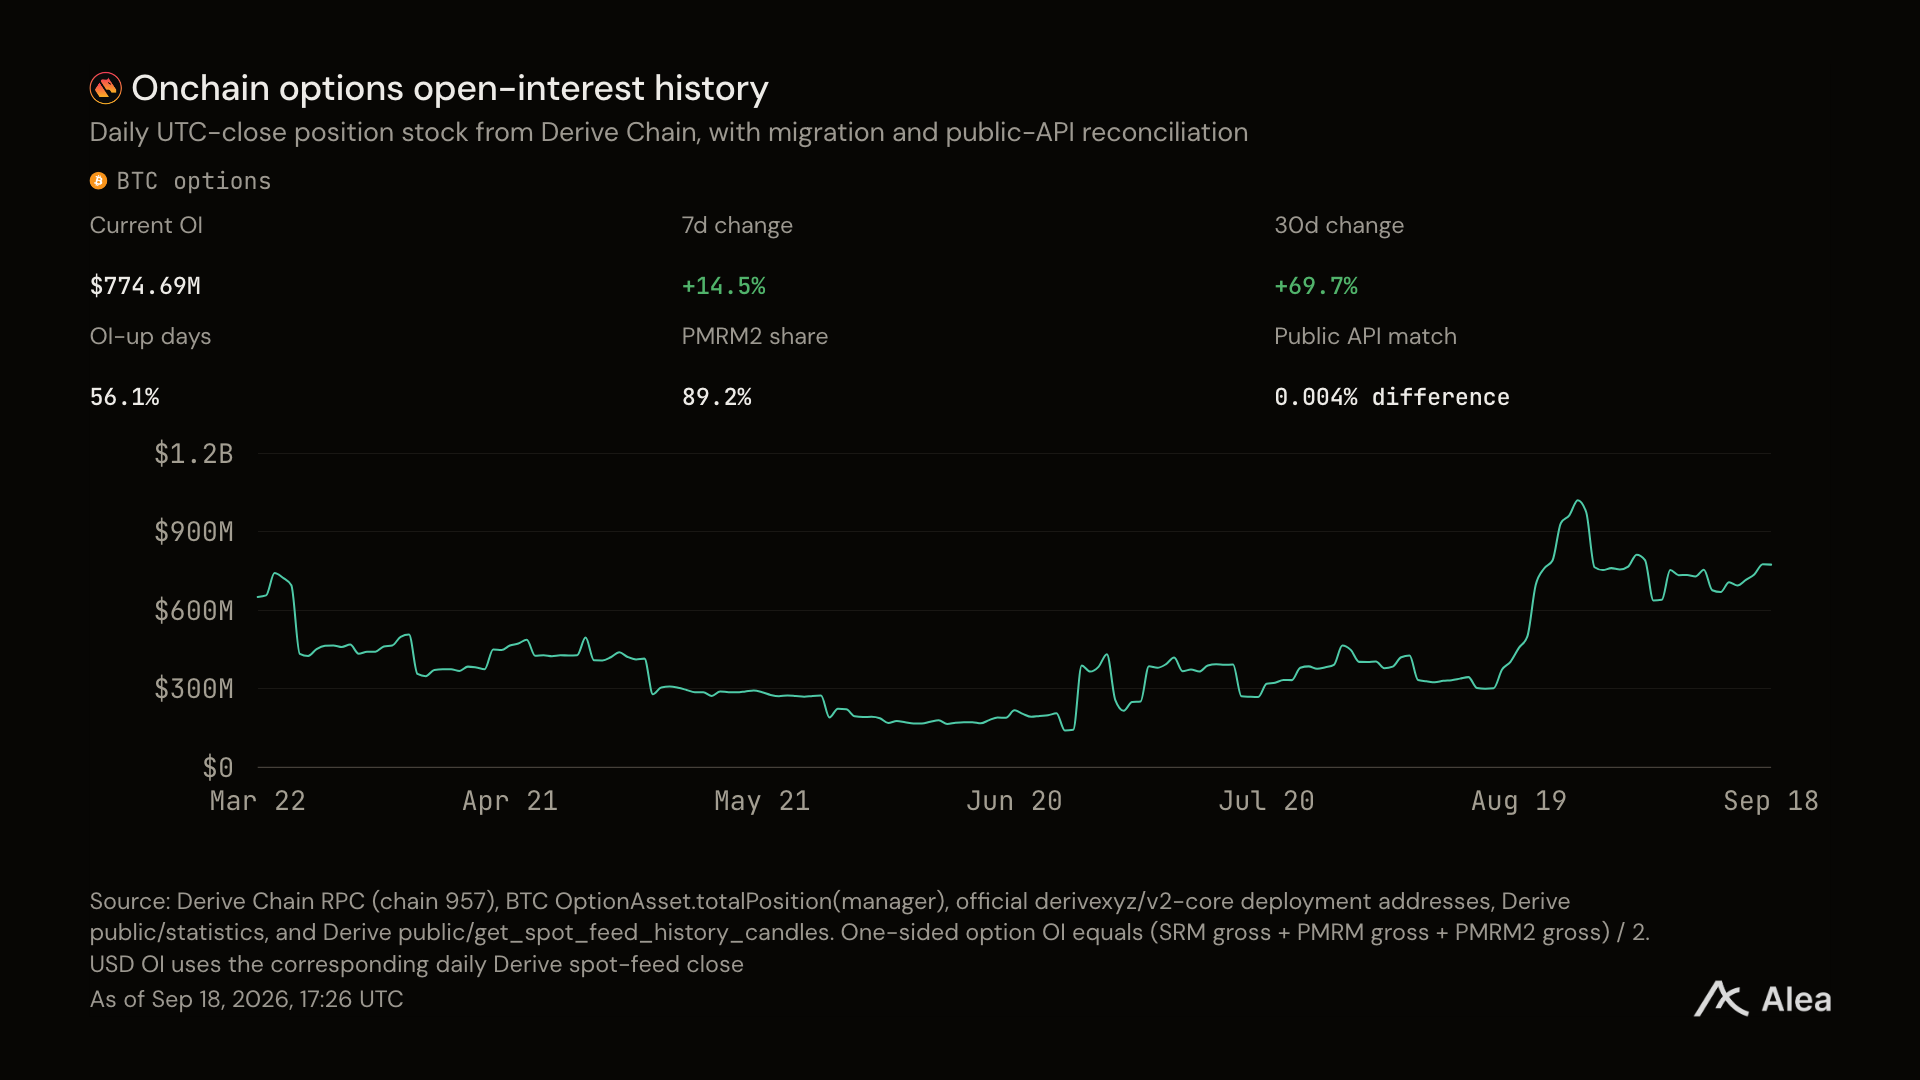
Figure: Option open interest read from Derive Chain, in dollars, for the entire year.
Where are the positions located?
Expiration dates and strike prices determine who will be exposed in the next market wave.
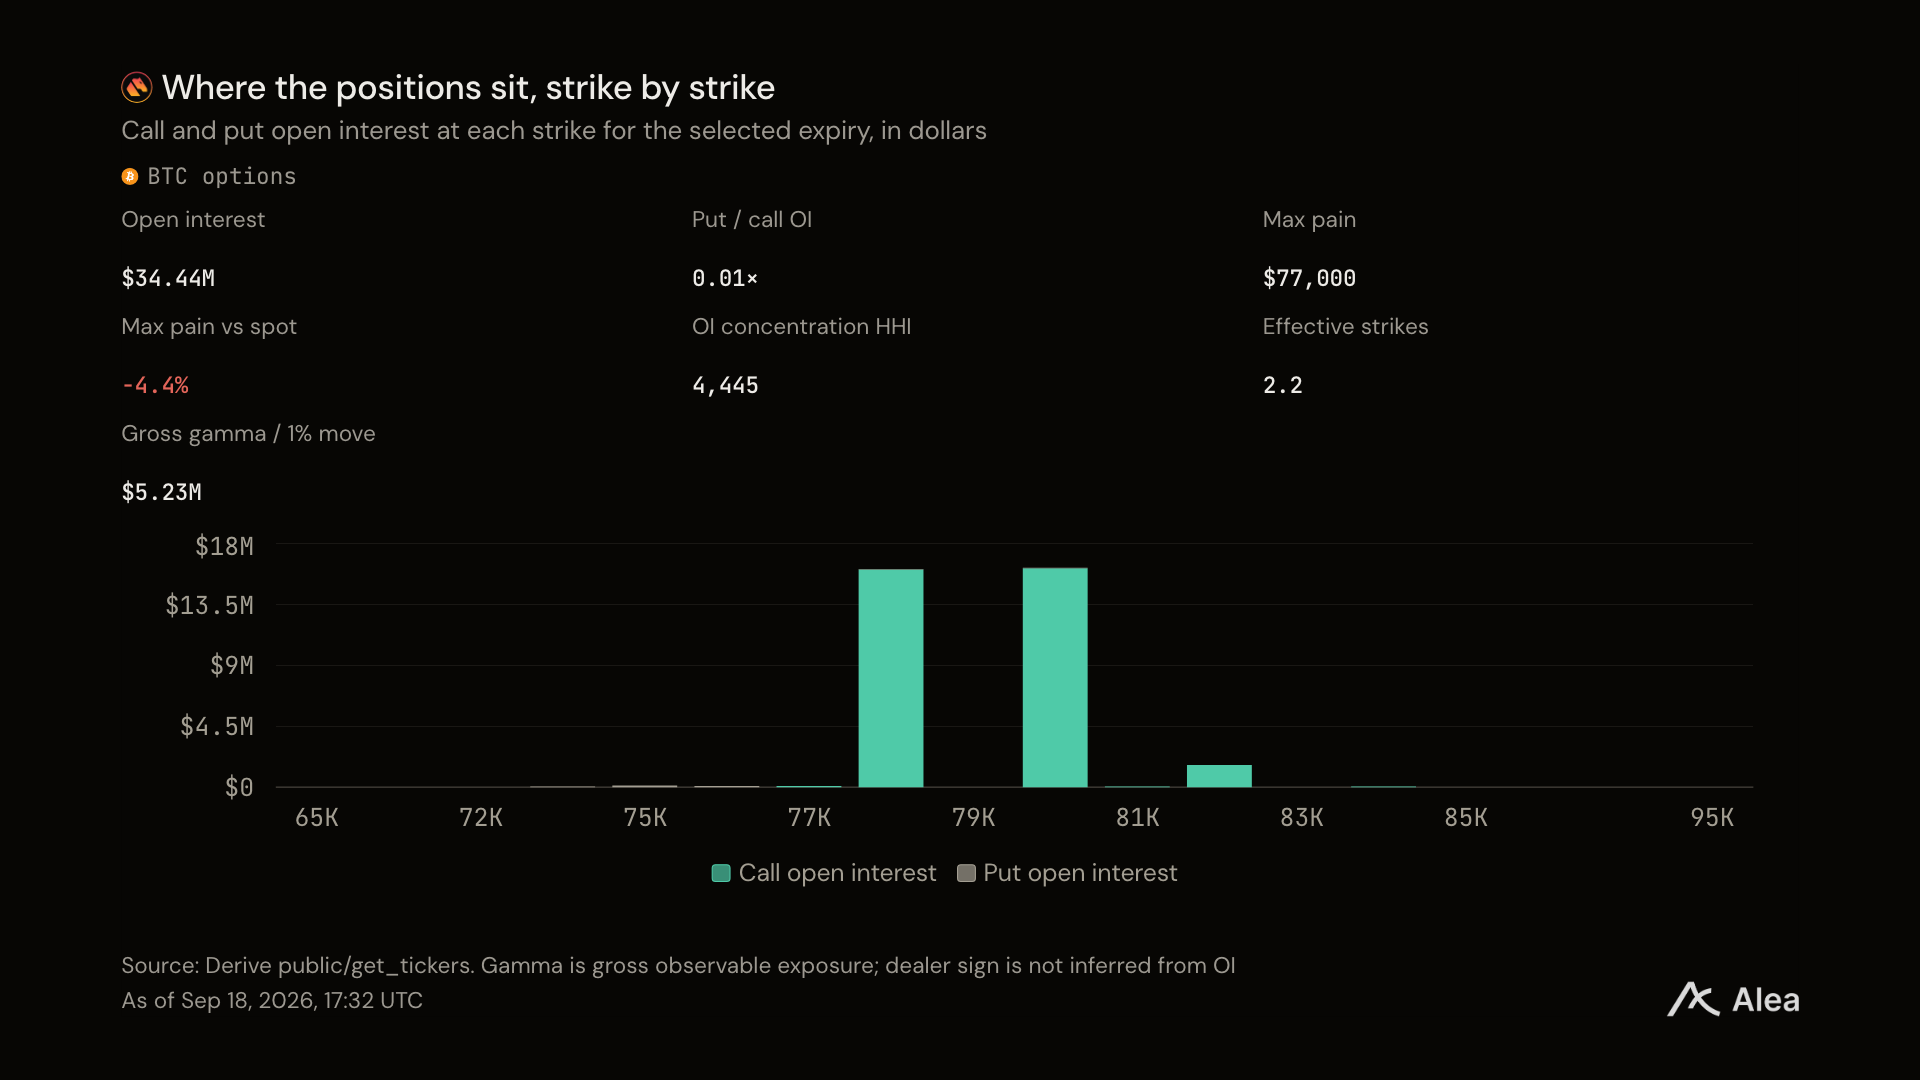
Figure: Open interest in call and put options at each strike price for selected expiration dates, in dollars.
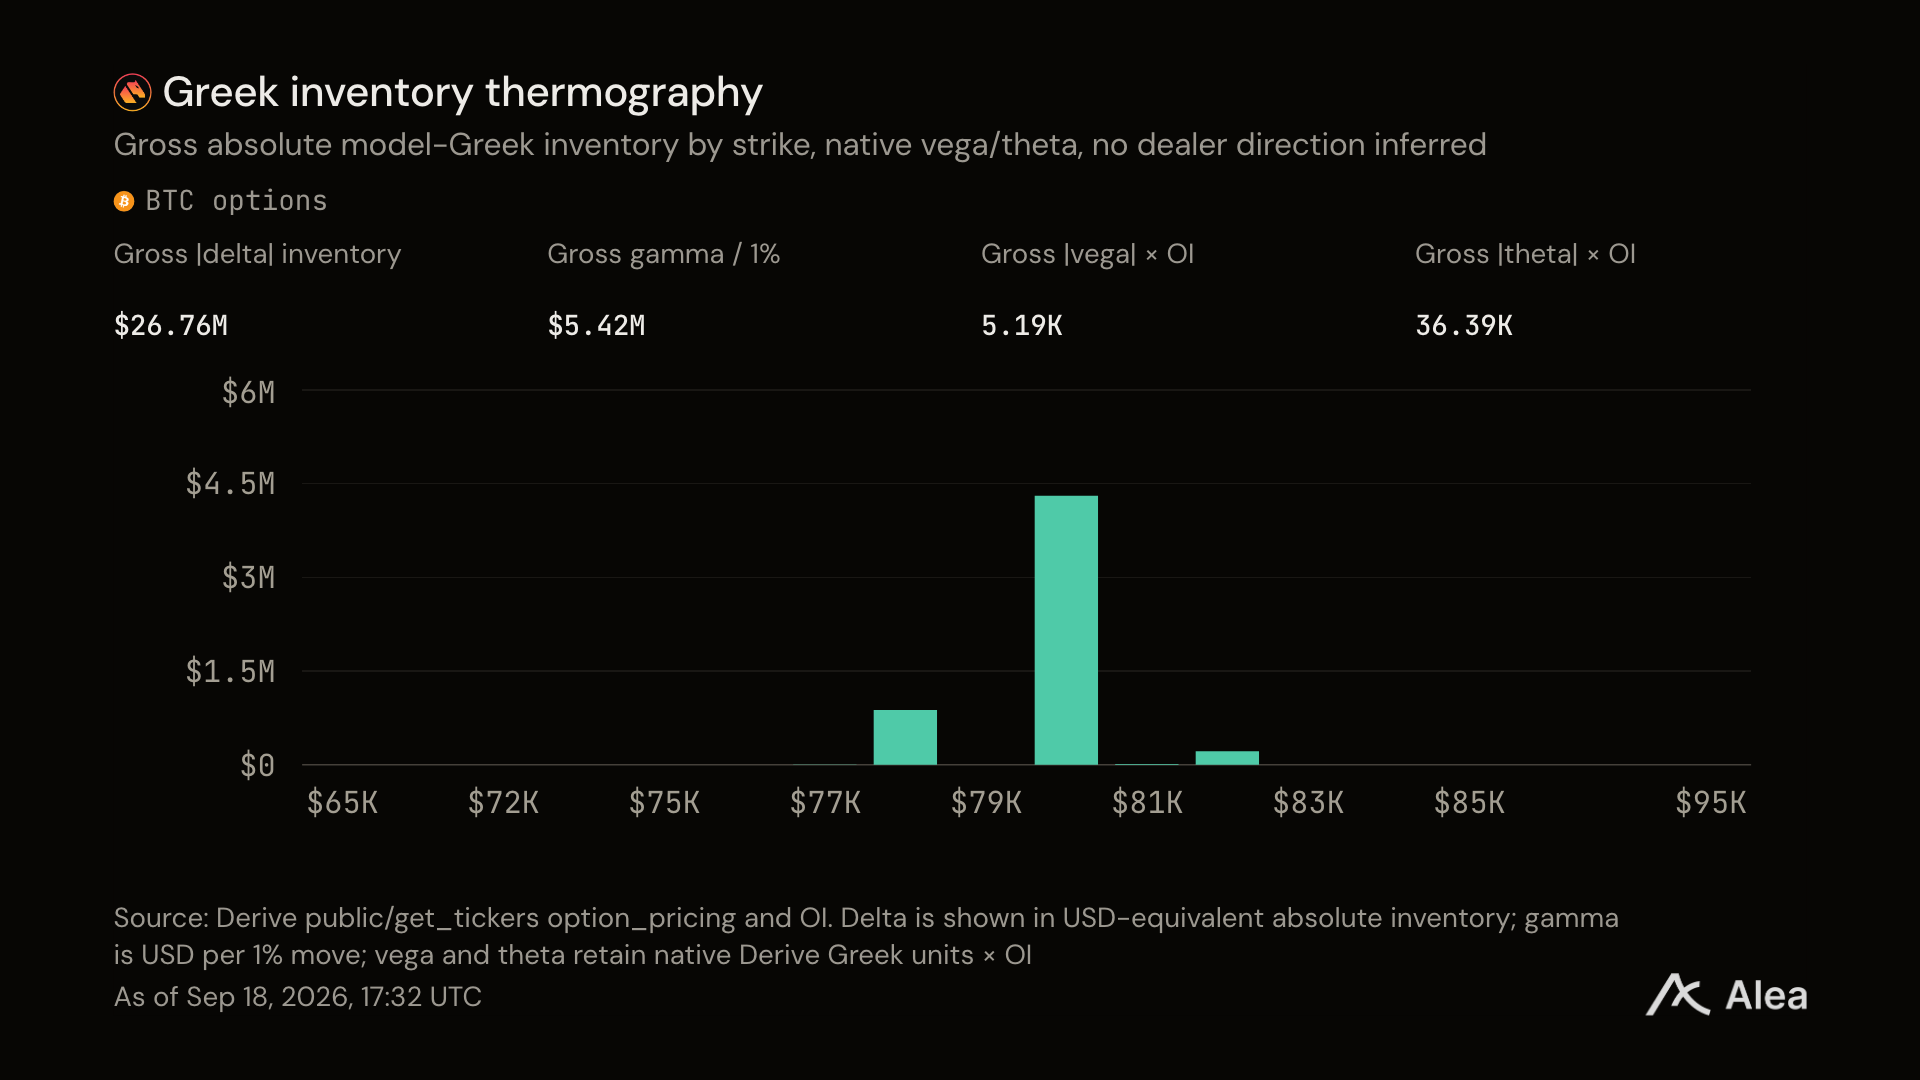
Figure: Gamma ranked by strike price, the dollar amount corresponding to a 1% price movement. Gamma measures how quickly an option's exposure changes with price movements.
Who is actually trading it?
Large trades and negotiated trades are ways for institutions to establish positions without disturbing the market. The proportion of fees they contribute reveals who the counterparties are.
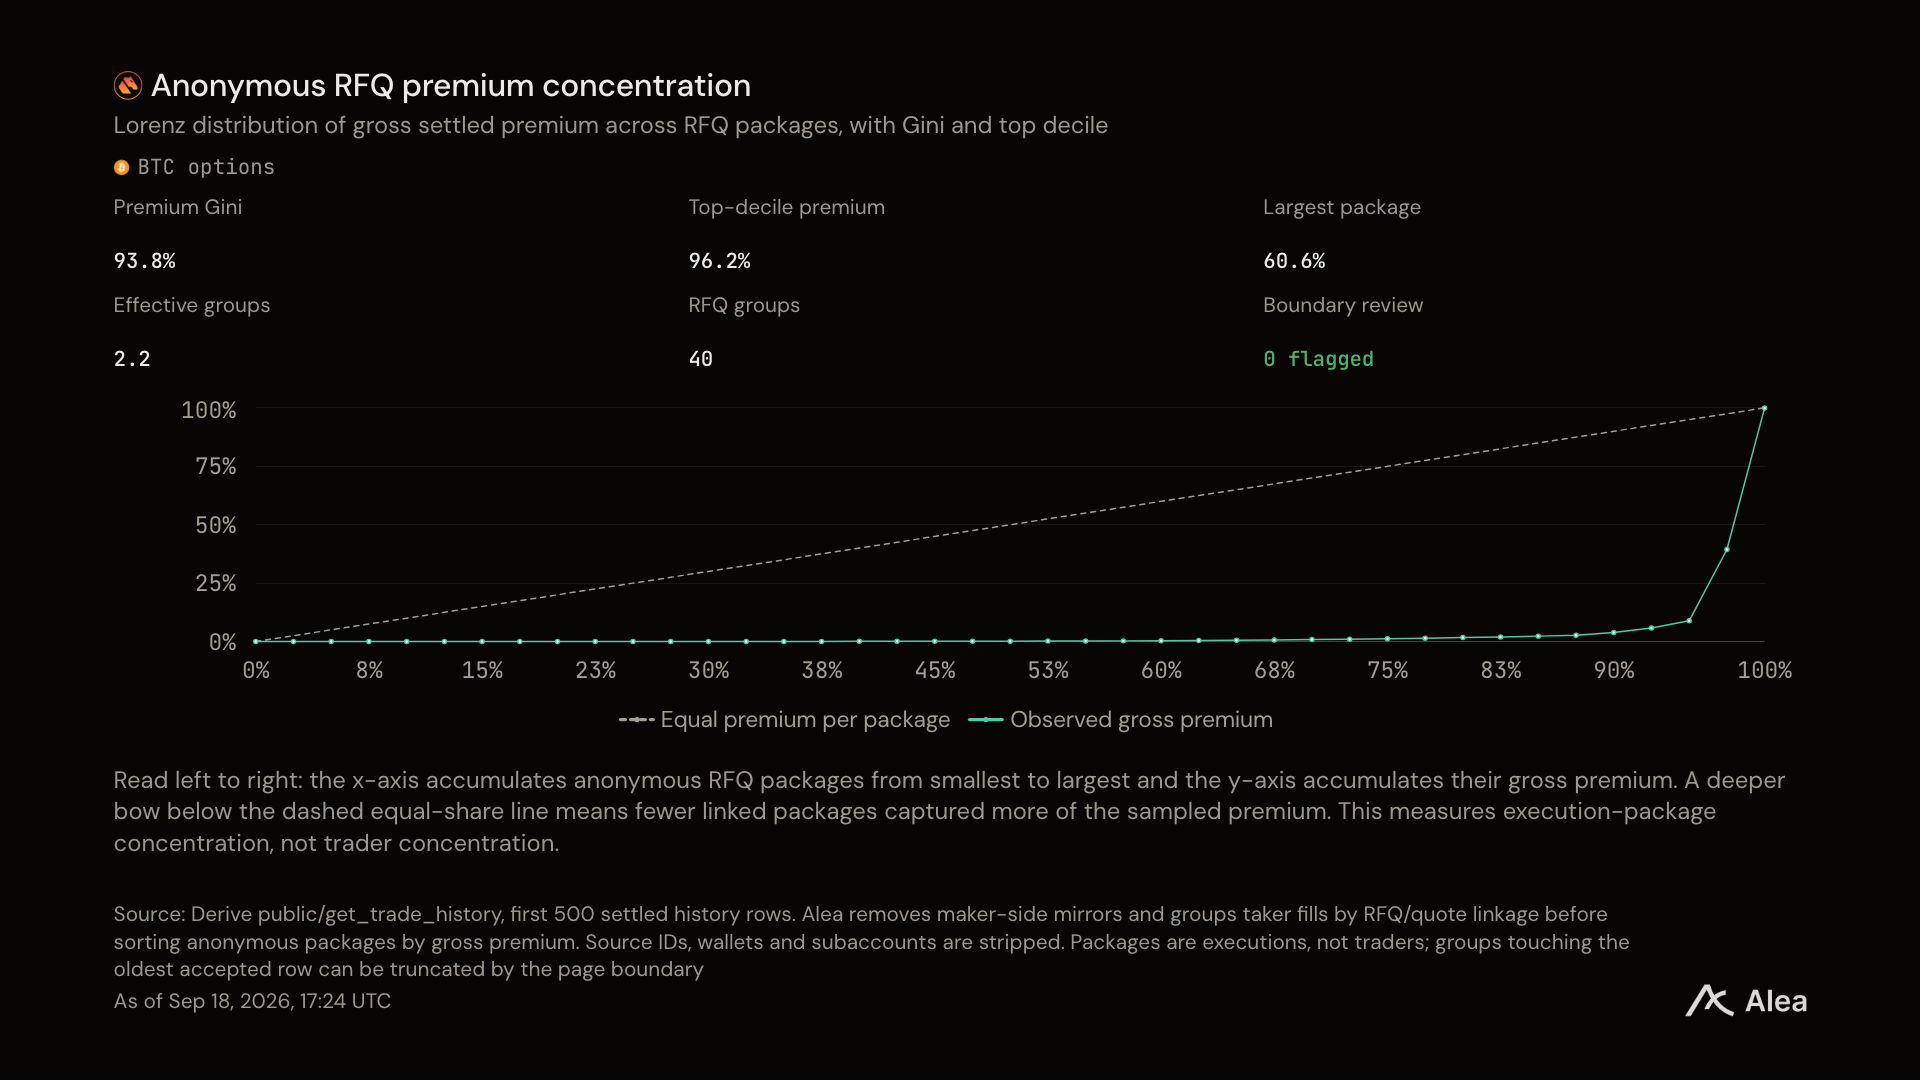
Figure: Proportion of fees contributed by the largest accounts and negotiated trades, in percentage.
Another ledger
Derive also operates perpetual contracts, which are bets on prices that will never settle. This ledger has recorded a nominal transaction amount of 5.2 billion dollars this year, contributing 39.1% of the platform's fees.
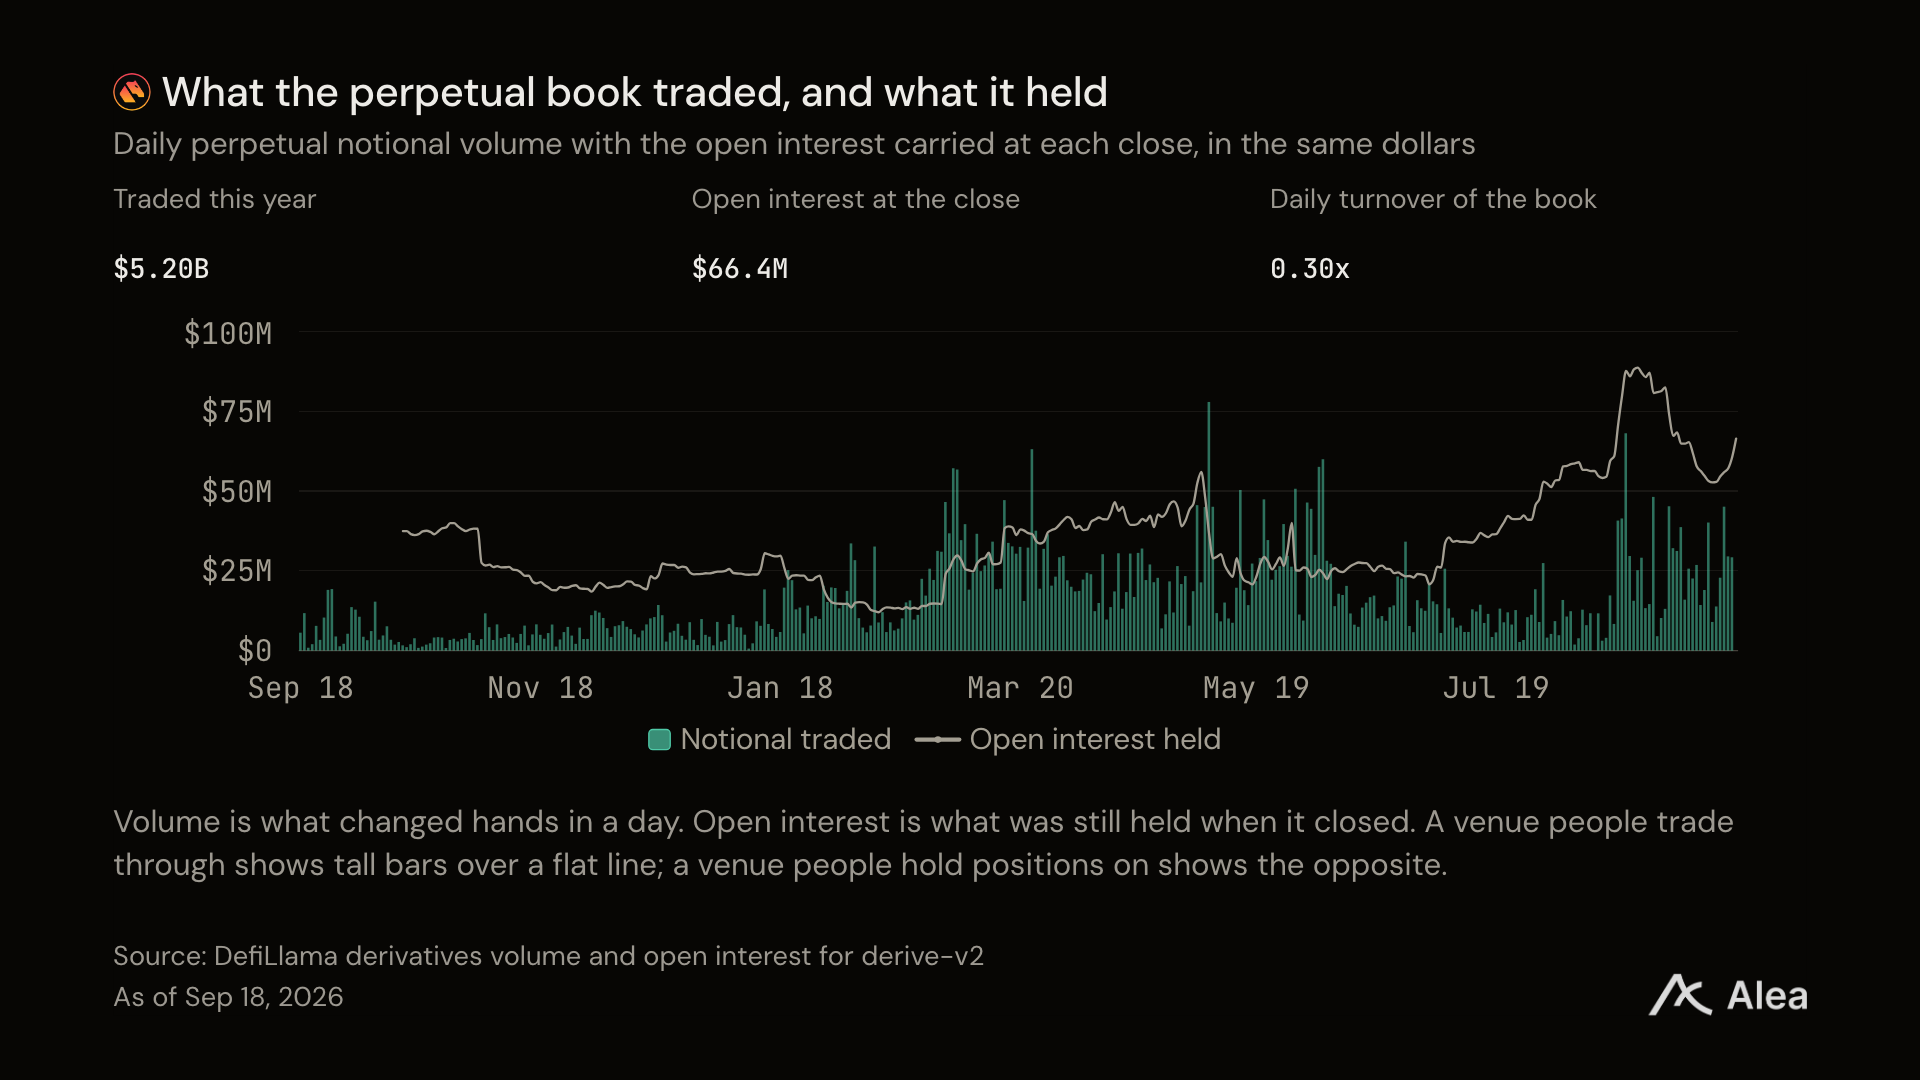
Figure: Daily nominal transaction volume of perpetual contracts and open interest at market close, in dollars; this year, 5.2 billion dollars was transacted, with open interest at 66.5 million dollars at the last market close.
The platform's daily transaction volume is 0.30 times its open interest. Traders here maintain positions instead of frequently trading in and out.
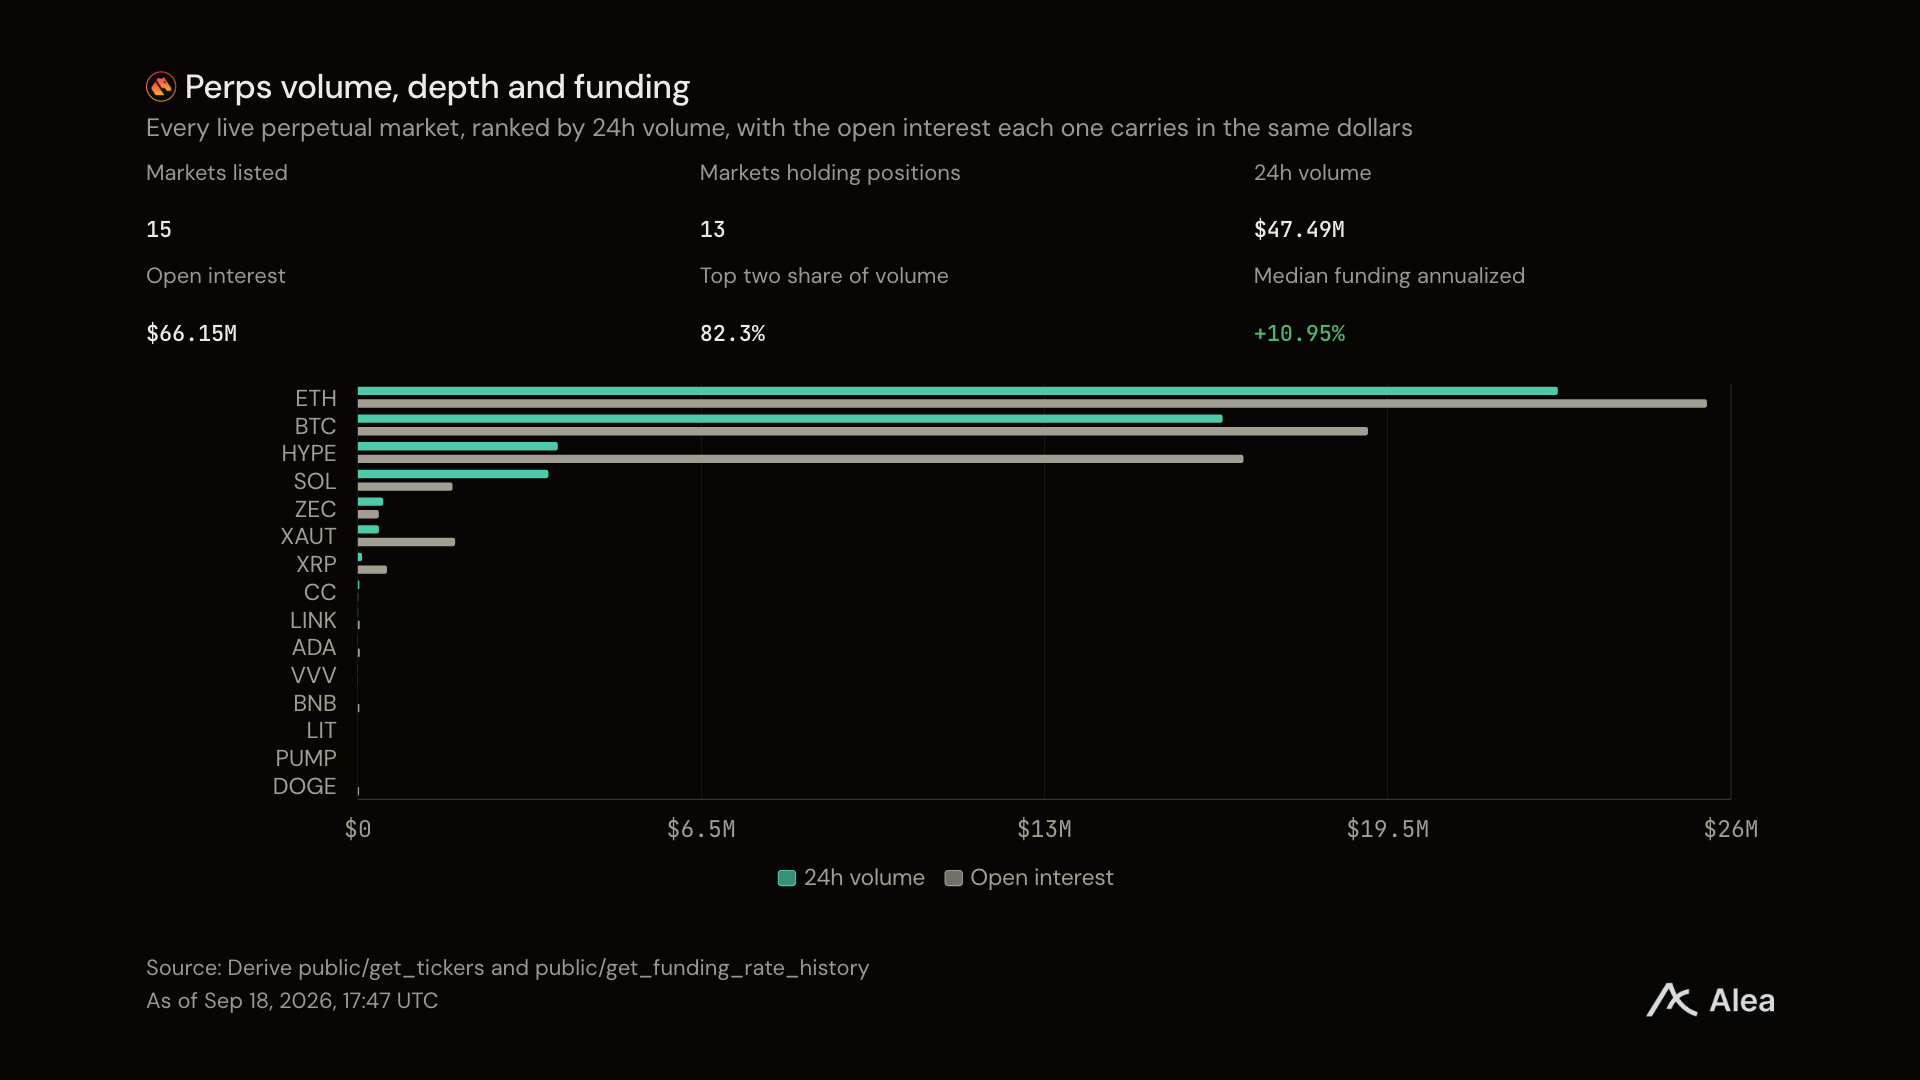
Figure: Each active perpetual market ranked by 24-hour trading volume and its open interest: 15 markets, 47.49 million dollars traded, with 66.12 million dollars open interest.
A total of 15 markets have been launched, with two accounting for 82.3% of the trading volume.
The funding rate involves regular payments between the long and short sides, changing only when one side's position is crowded. In most of Derive's markets, it remains completely unchanged.
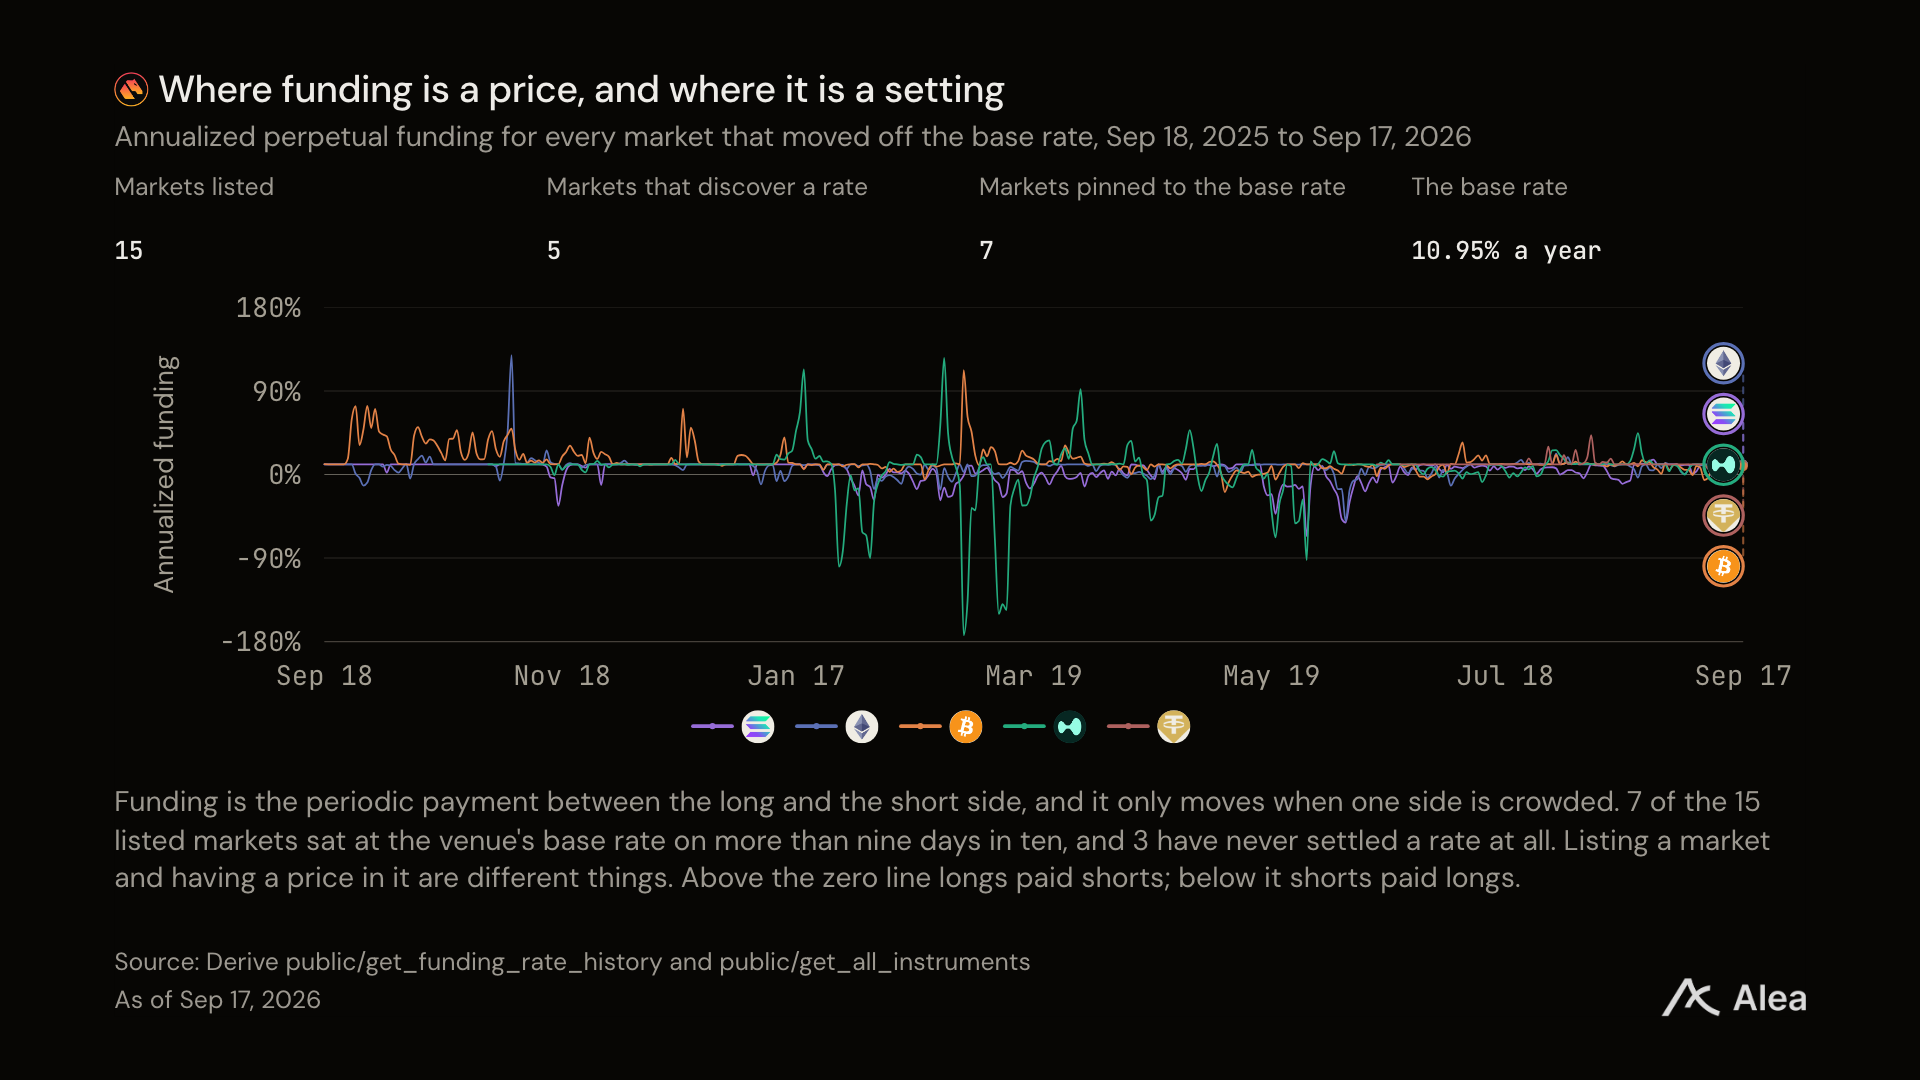
Figure: Annualized funding rates of each market deviating from the benchmark rate, in annualized percentage.
Five markets found their own rates: Bitcoin, Ethereum, Solana, Hyperliquid, and tokenized gold. Seven markets remained at the platform's benchmark annual rate of 10.95% for over 90% of the time. The five markets that discovered rates had also quieted down. These markets saw funding rates reach as high as 128.5% annual before May, then fall to 44.6%, while the deepest negative readings dropped from 173.0% to 92.2%.
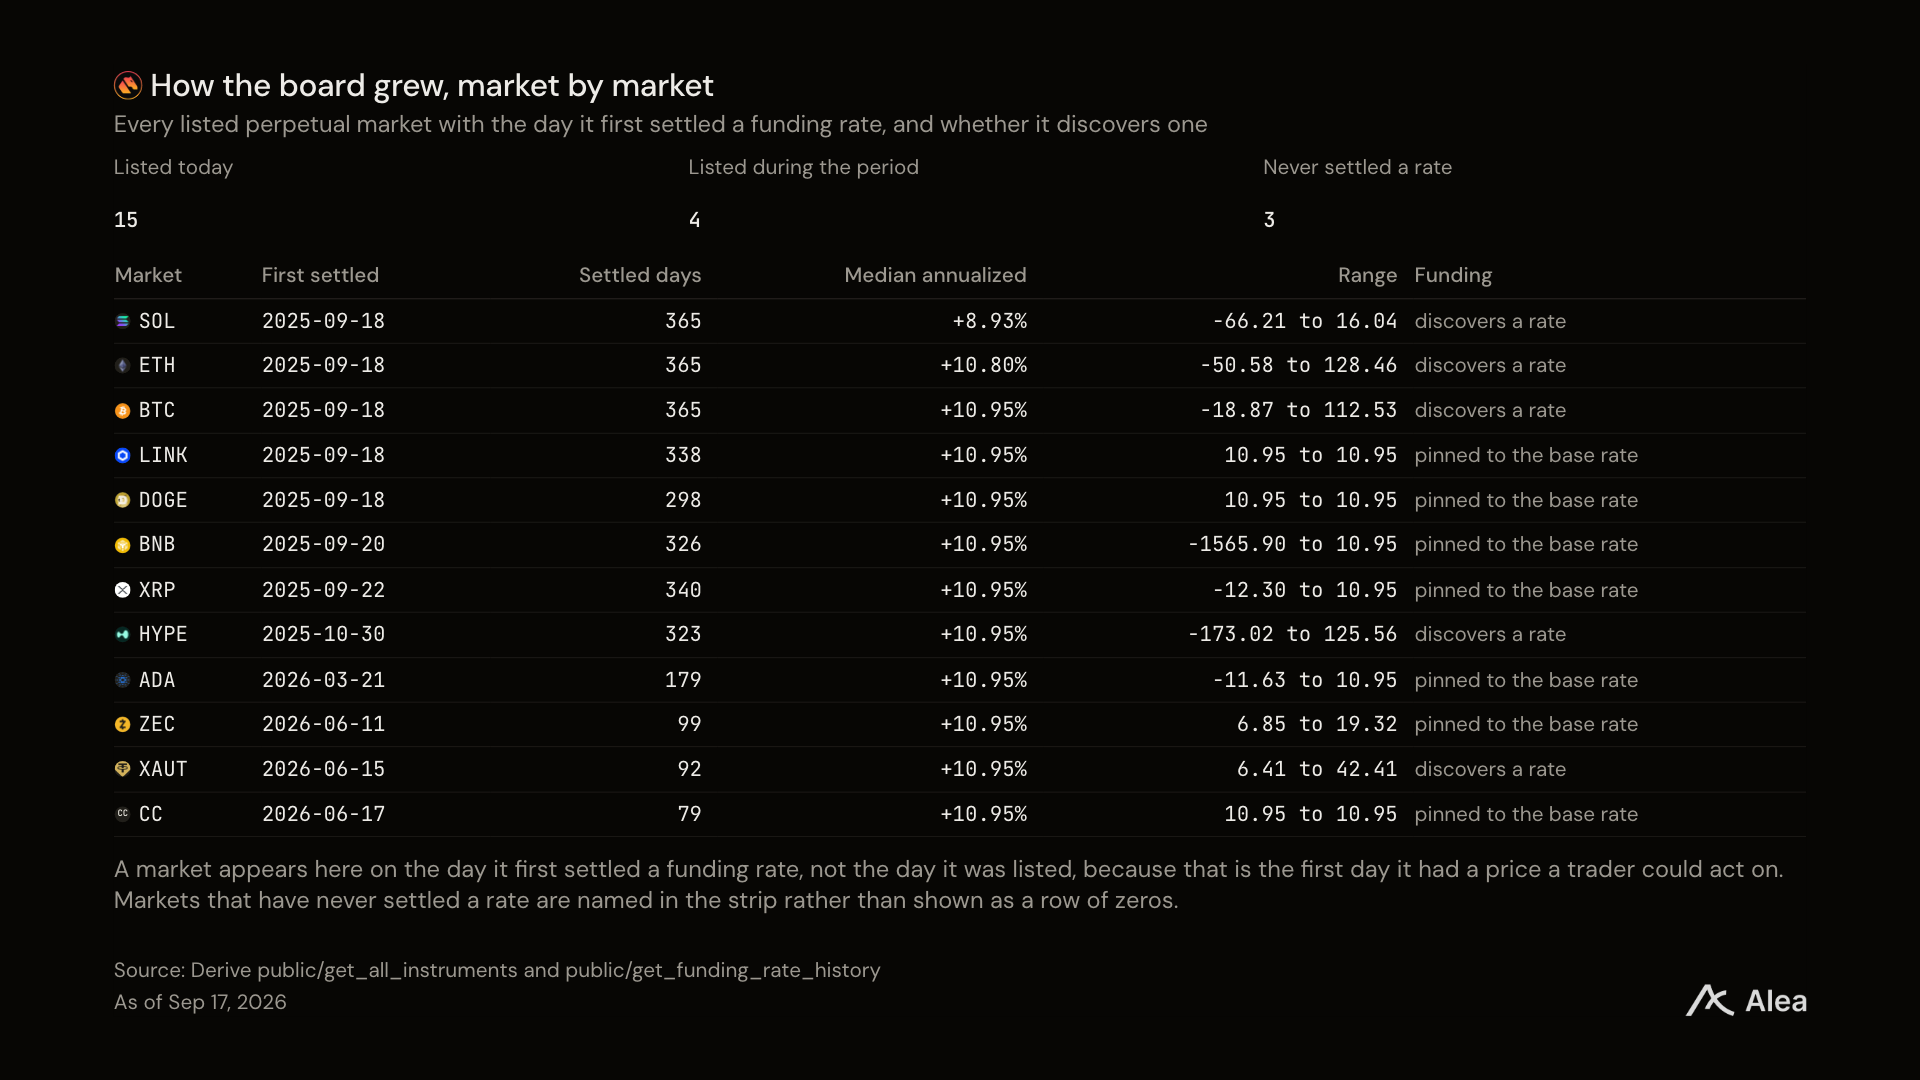
Figure: Each launched perpetual market and the date of its first settled funding rate. As of September 17, 15 markets have been launched, 12 have settled rates, and 3 have never settled.
The speed of the expansion of trading targets has outpaced the speed of liquidity filling, particularly in newer markets.
Where passive capital is headed
Treasuries are where capital wants a platform strategy but does not want to operate personally. On Derive, treasuries only do one of two things: sell options and keep the premiums; or buy assets, short them in the futures market, and profit from the difference between the two prices.
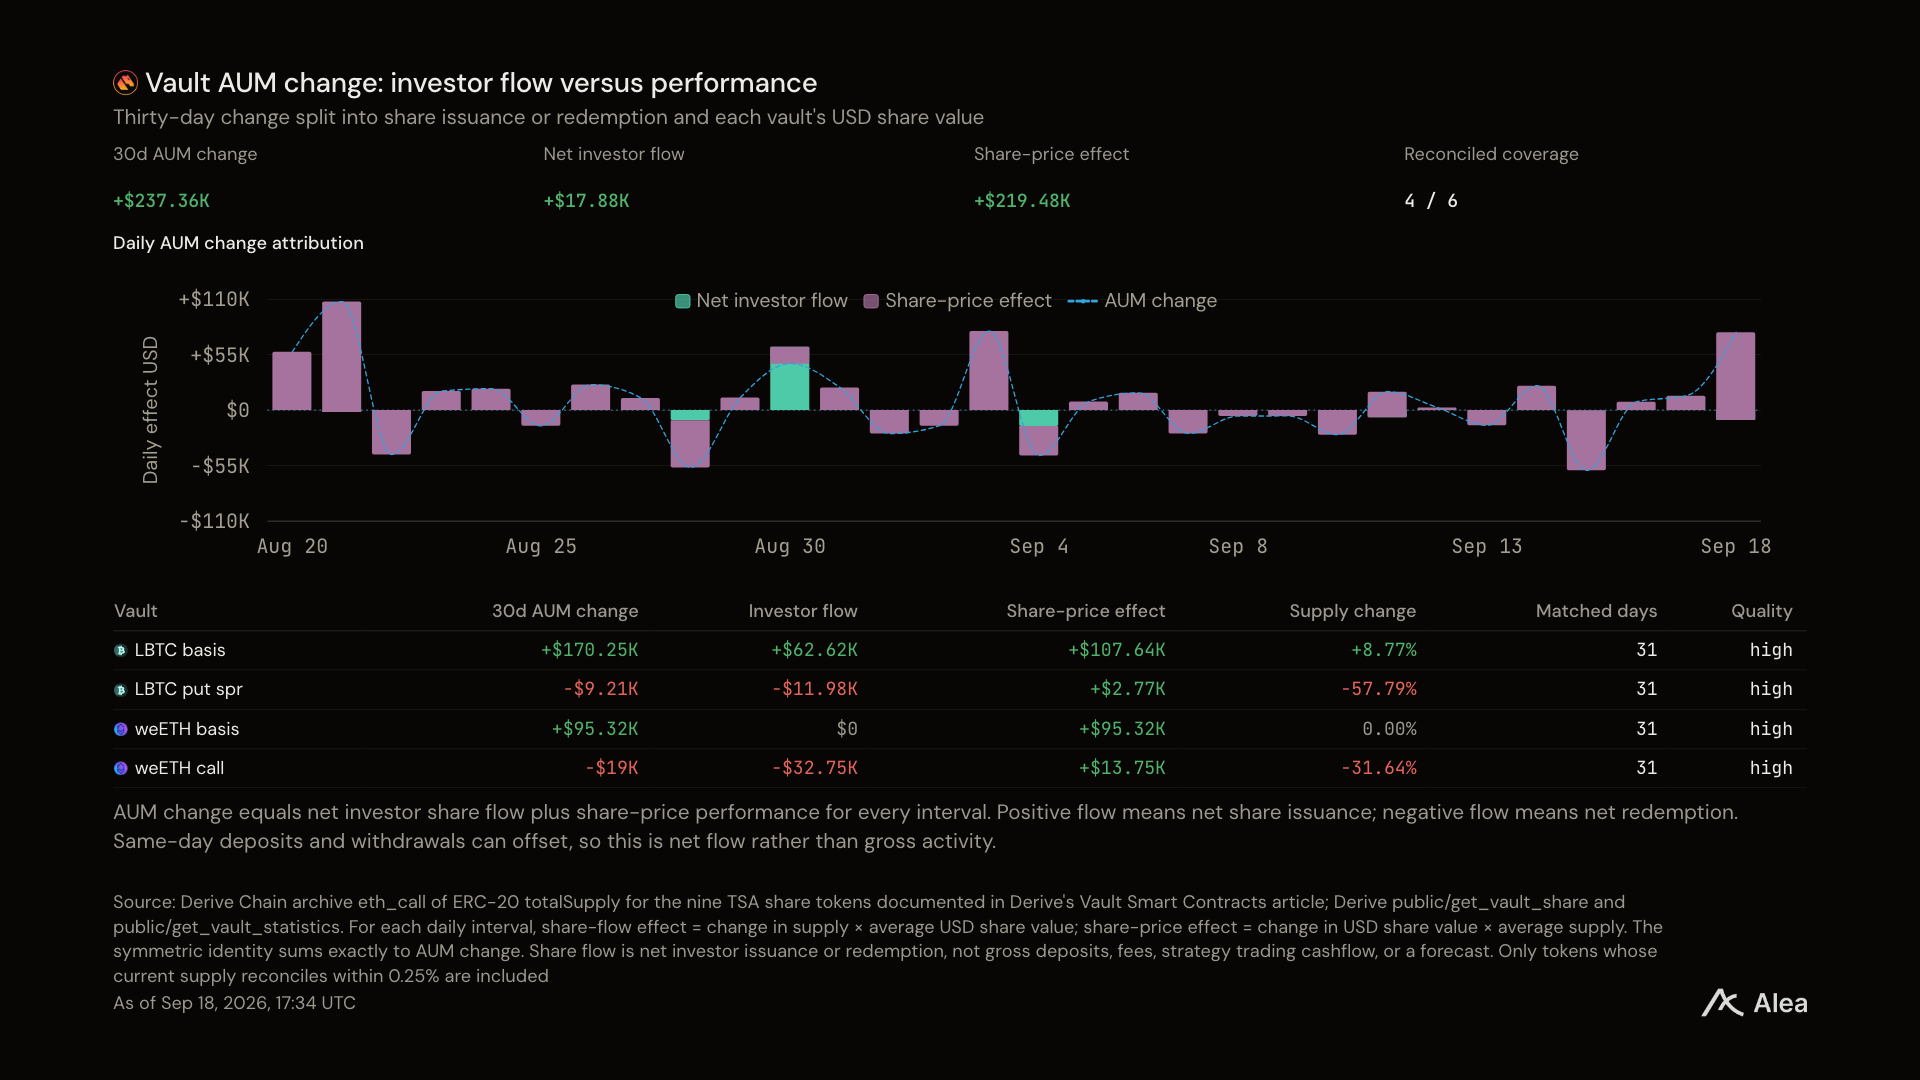
Figure: 30-day changes in treasury assets, in dollars, split into new funds and earnings.
New funds and strategy performance are different reasons for treasury growth, and only one explains that the strategy is working.
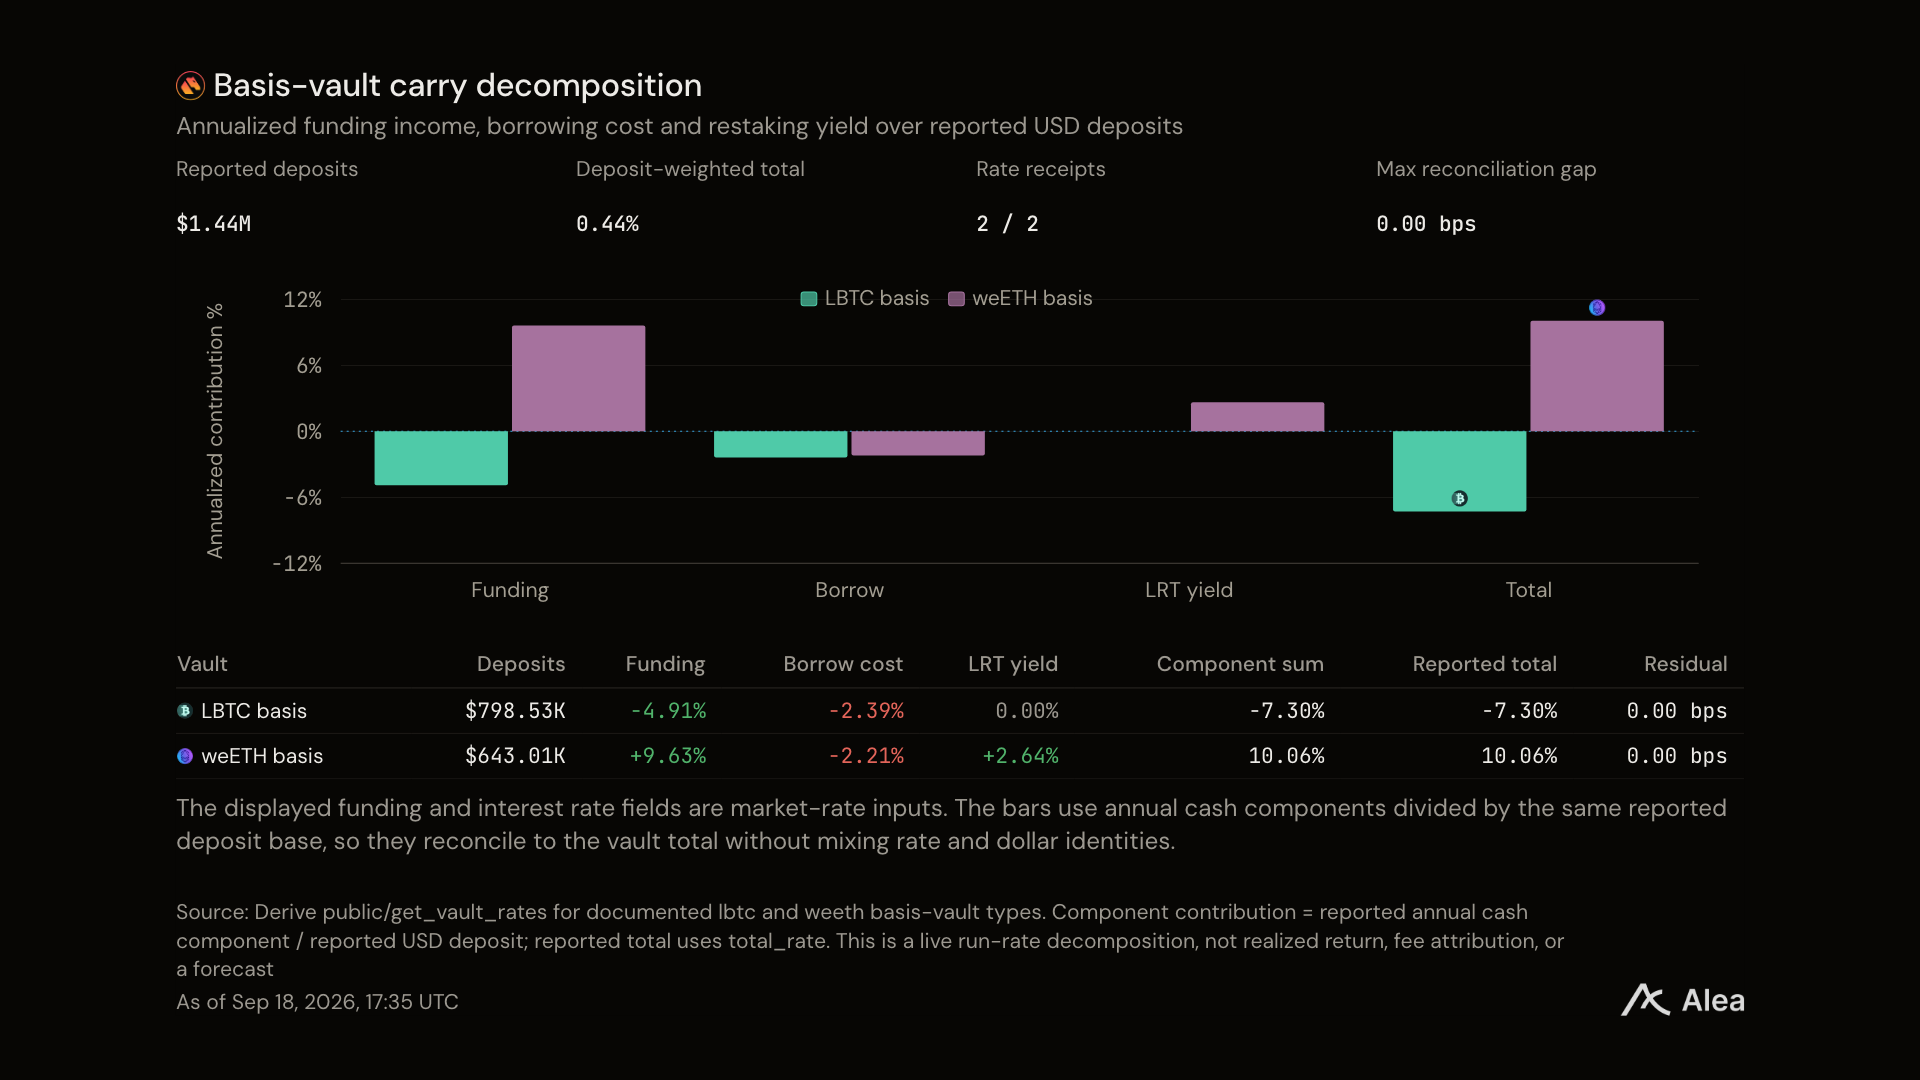
Figure: Earnings of the basis treasury, in annualized percentage, split into funding rate and cash interest.
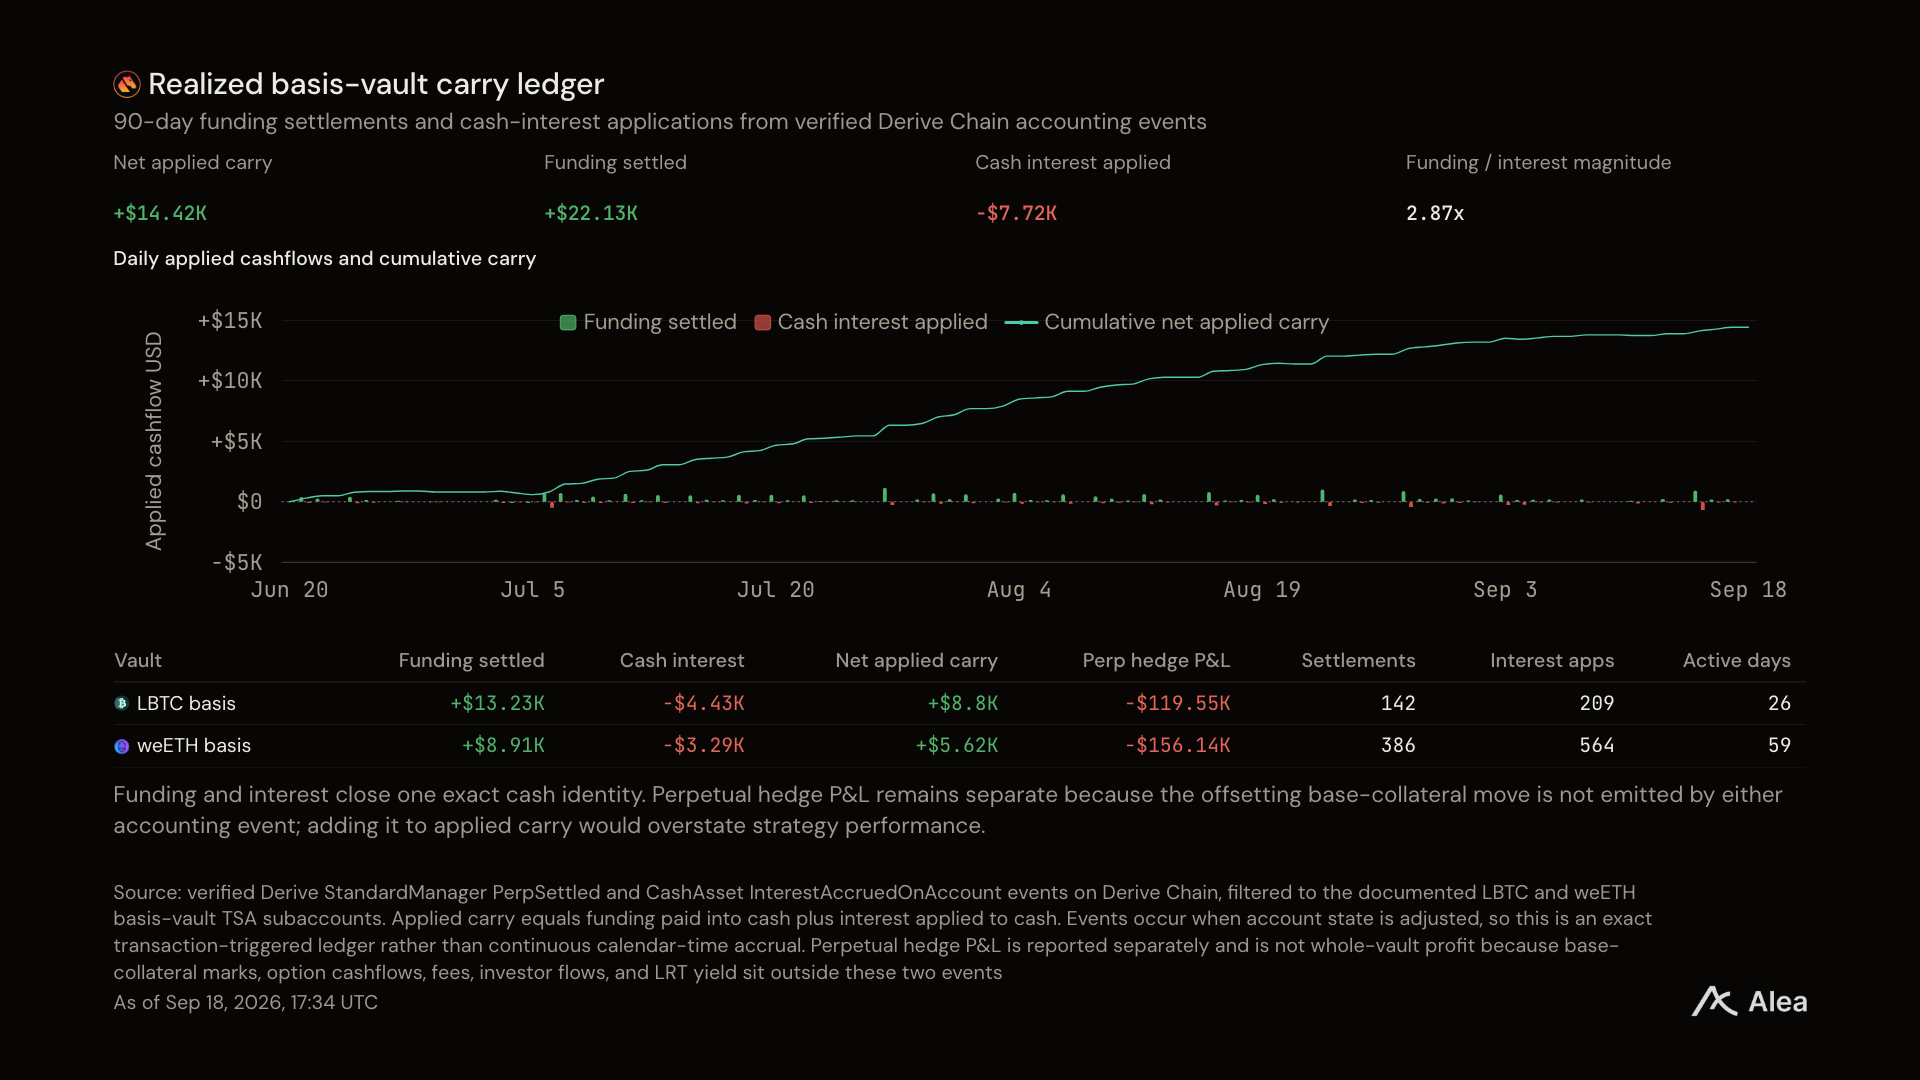
Figure: Spread earnings realized by the basis treasury during the period, in dollars.
How much depositors ultimately take home depends on the treasury's fees and how much capacity remains.
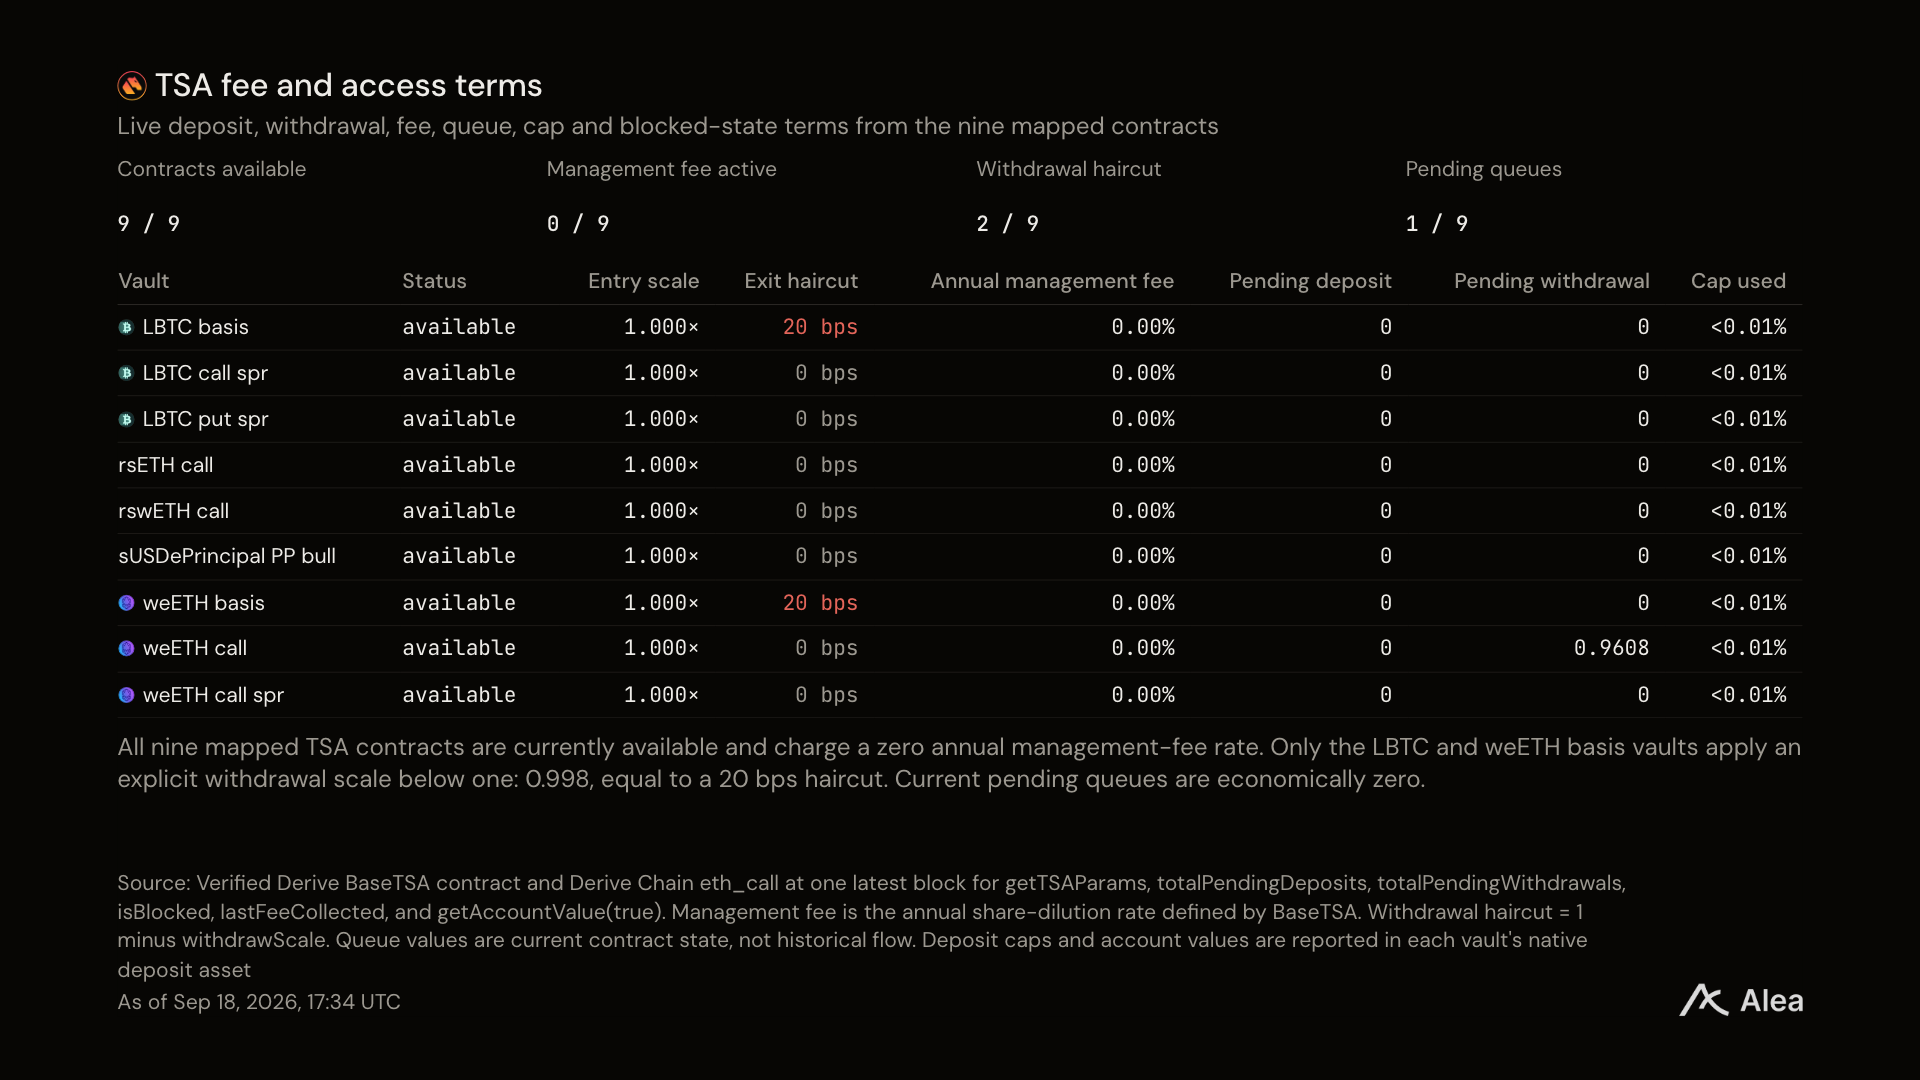
Figure: Management fees, deposit limits, and account value for each treasury, in percentage and dollars.
Some of the platform's trading volume is purchased rather than earned.
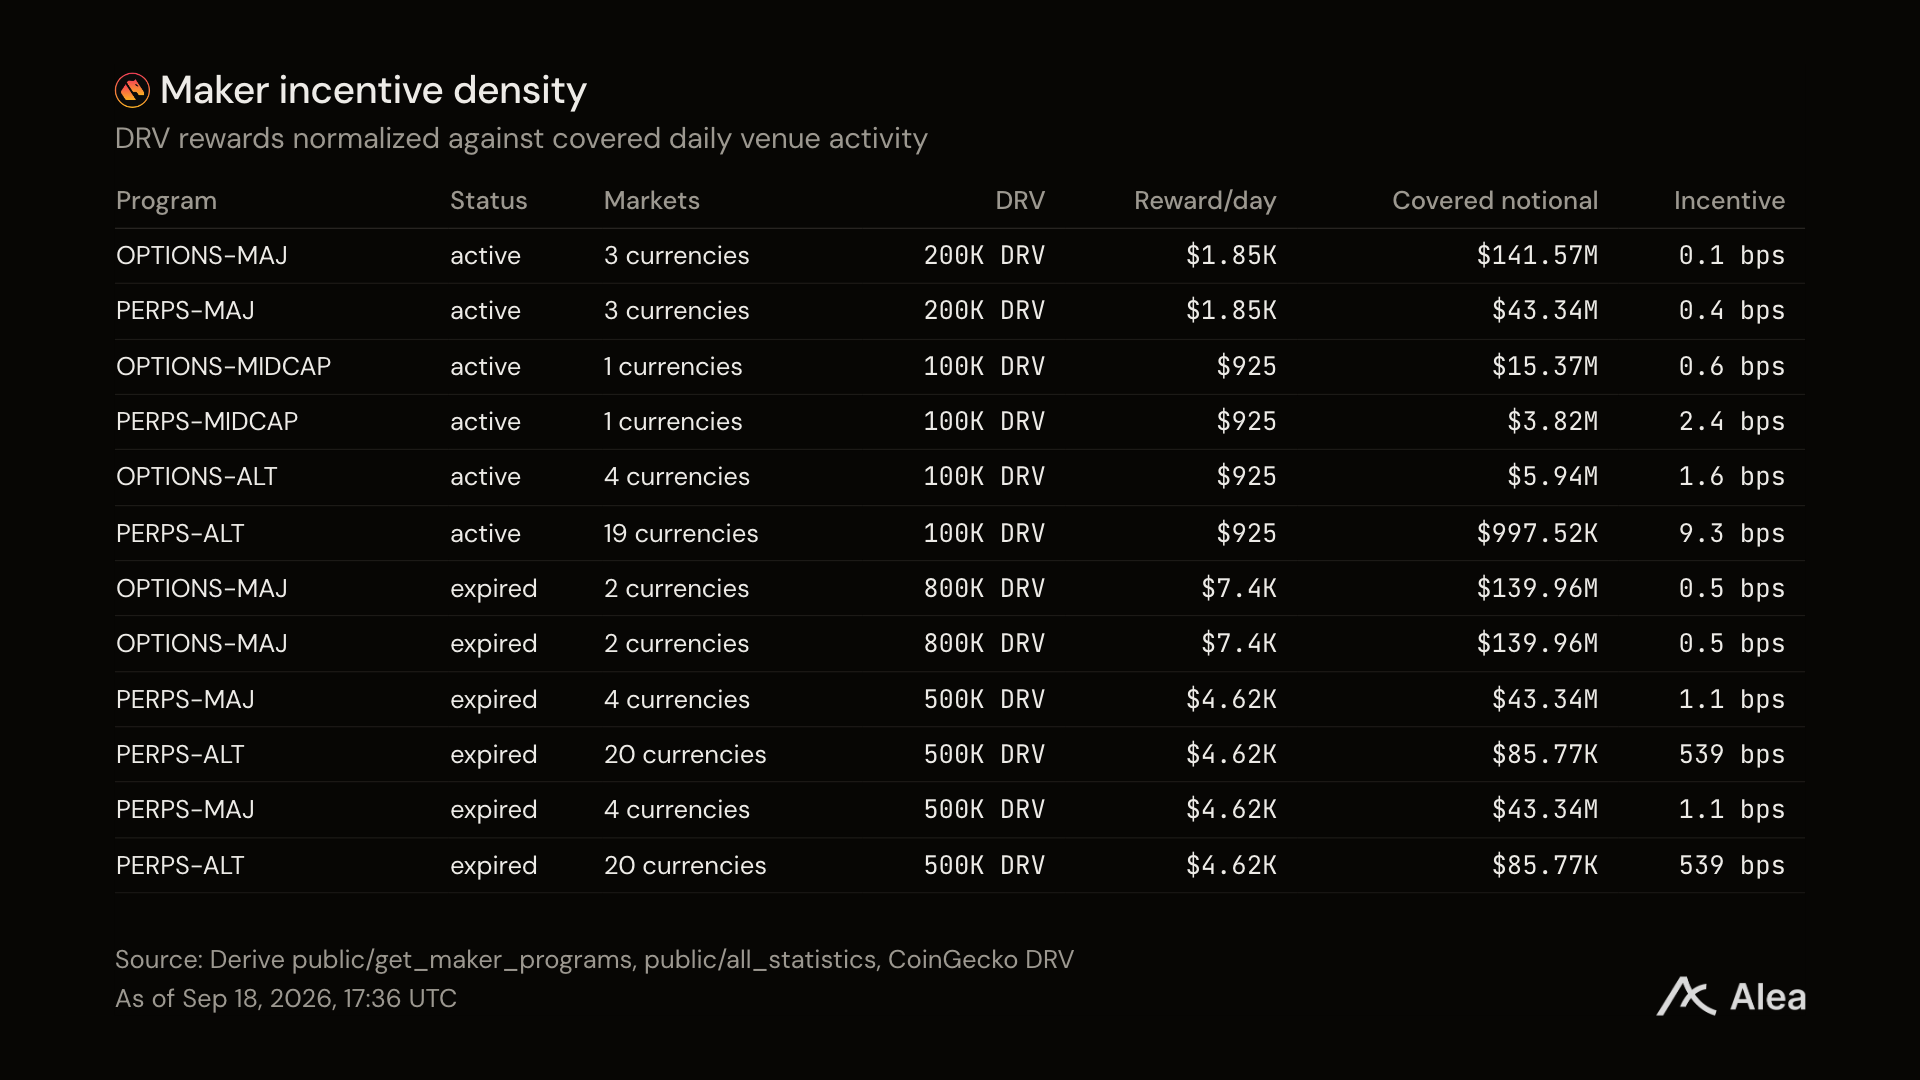
Figure: DRV rewards paid per 100 dollars in trading volume, in cents, over the past 30 days.
What the platform has earned and who received it
Fees are paid by traders. Revenue is the portion left for the platform: 3.37 million dollars this year.
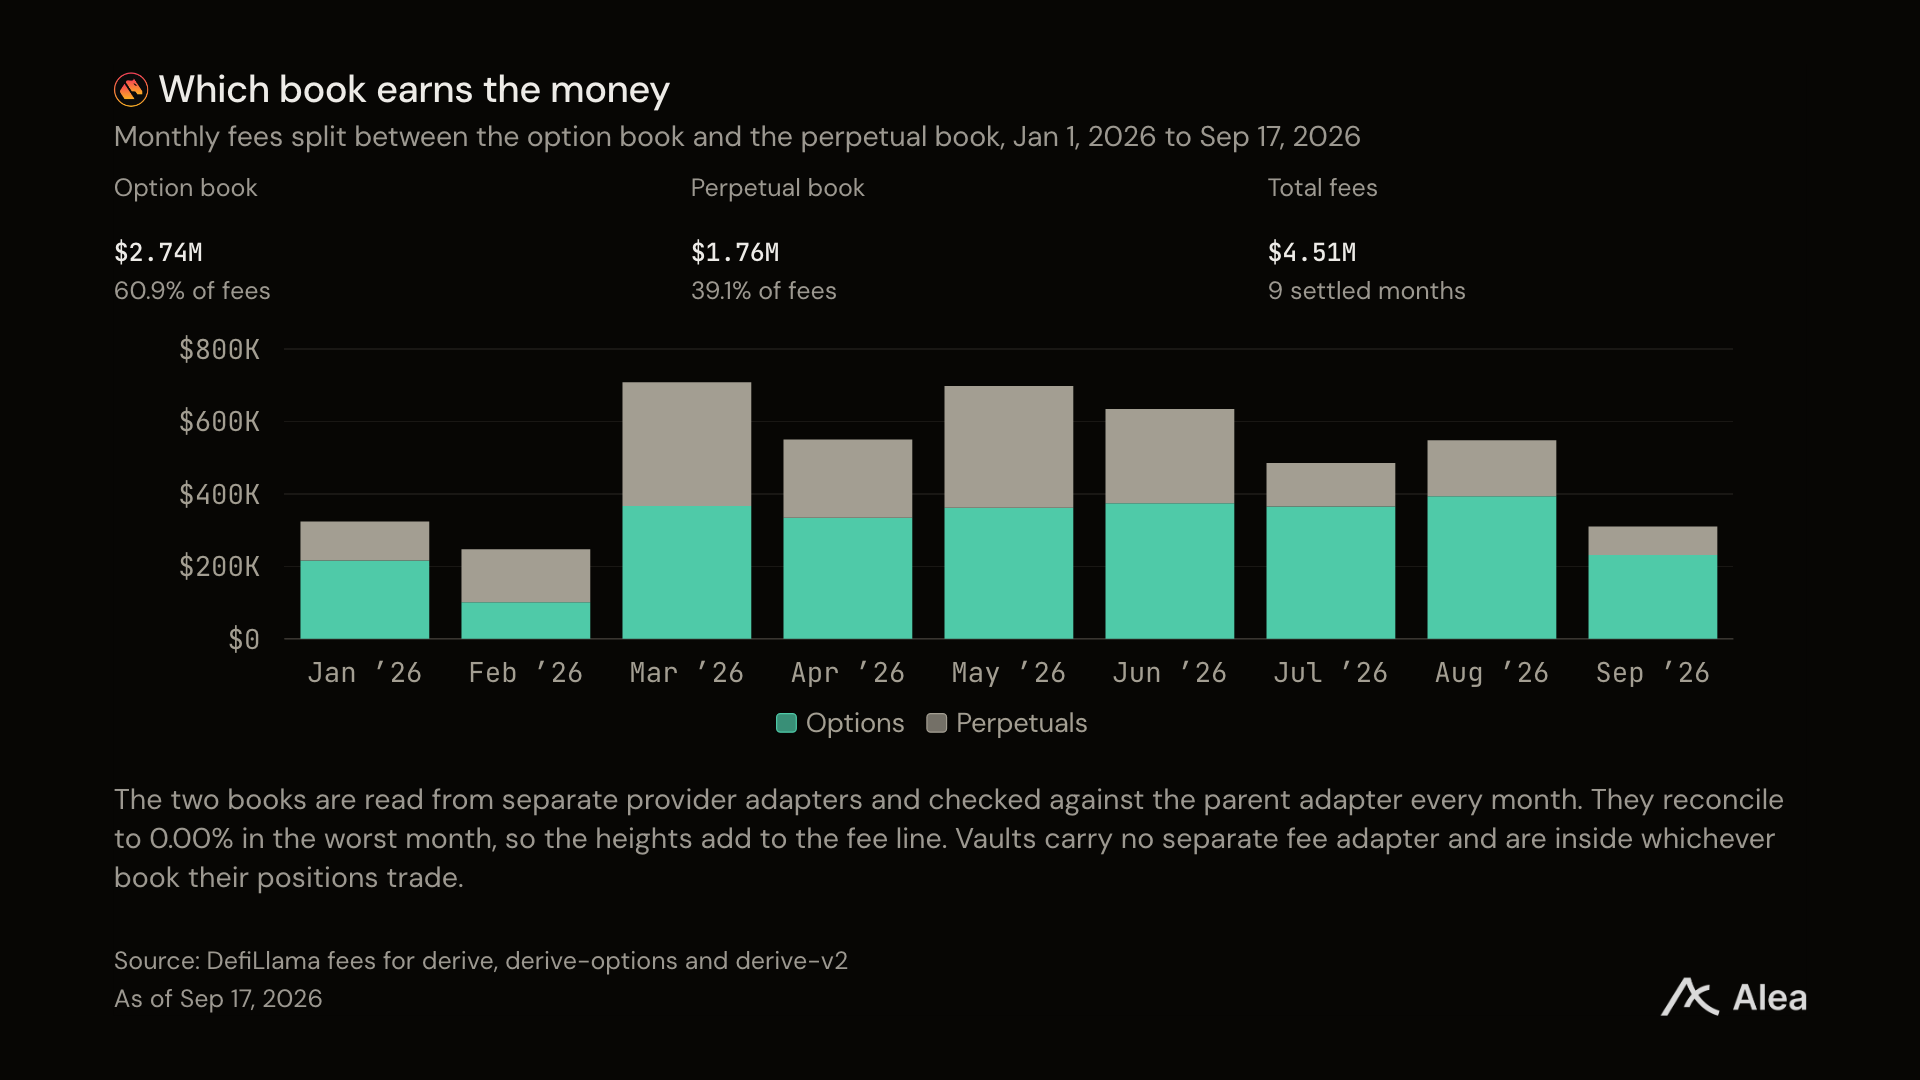
Figure: Monthly fee split between options ledger and perpetual ledger, in dollars.
The options ledger earned 2.74 million dollars, while the perpetual ledger earned 1.76 million dollars, which is 60.9% to 39.1%. In February, the perpetual ledger earned more than the options ledger.
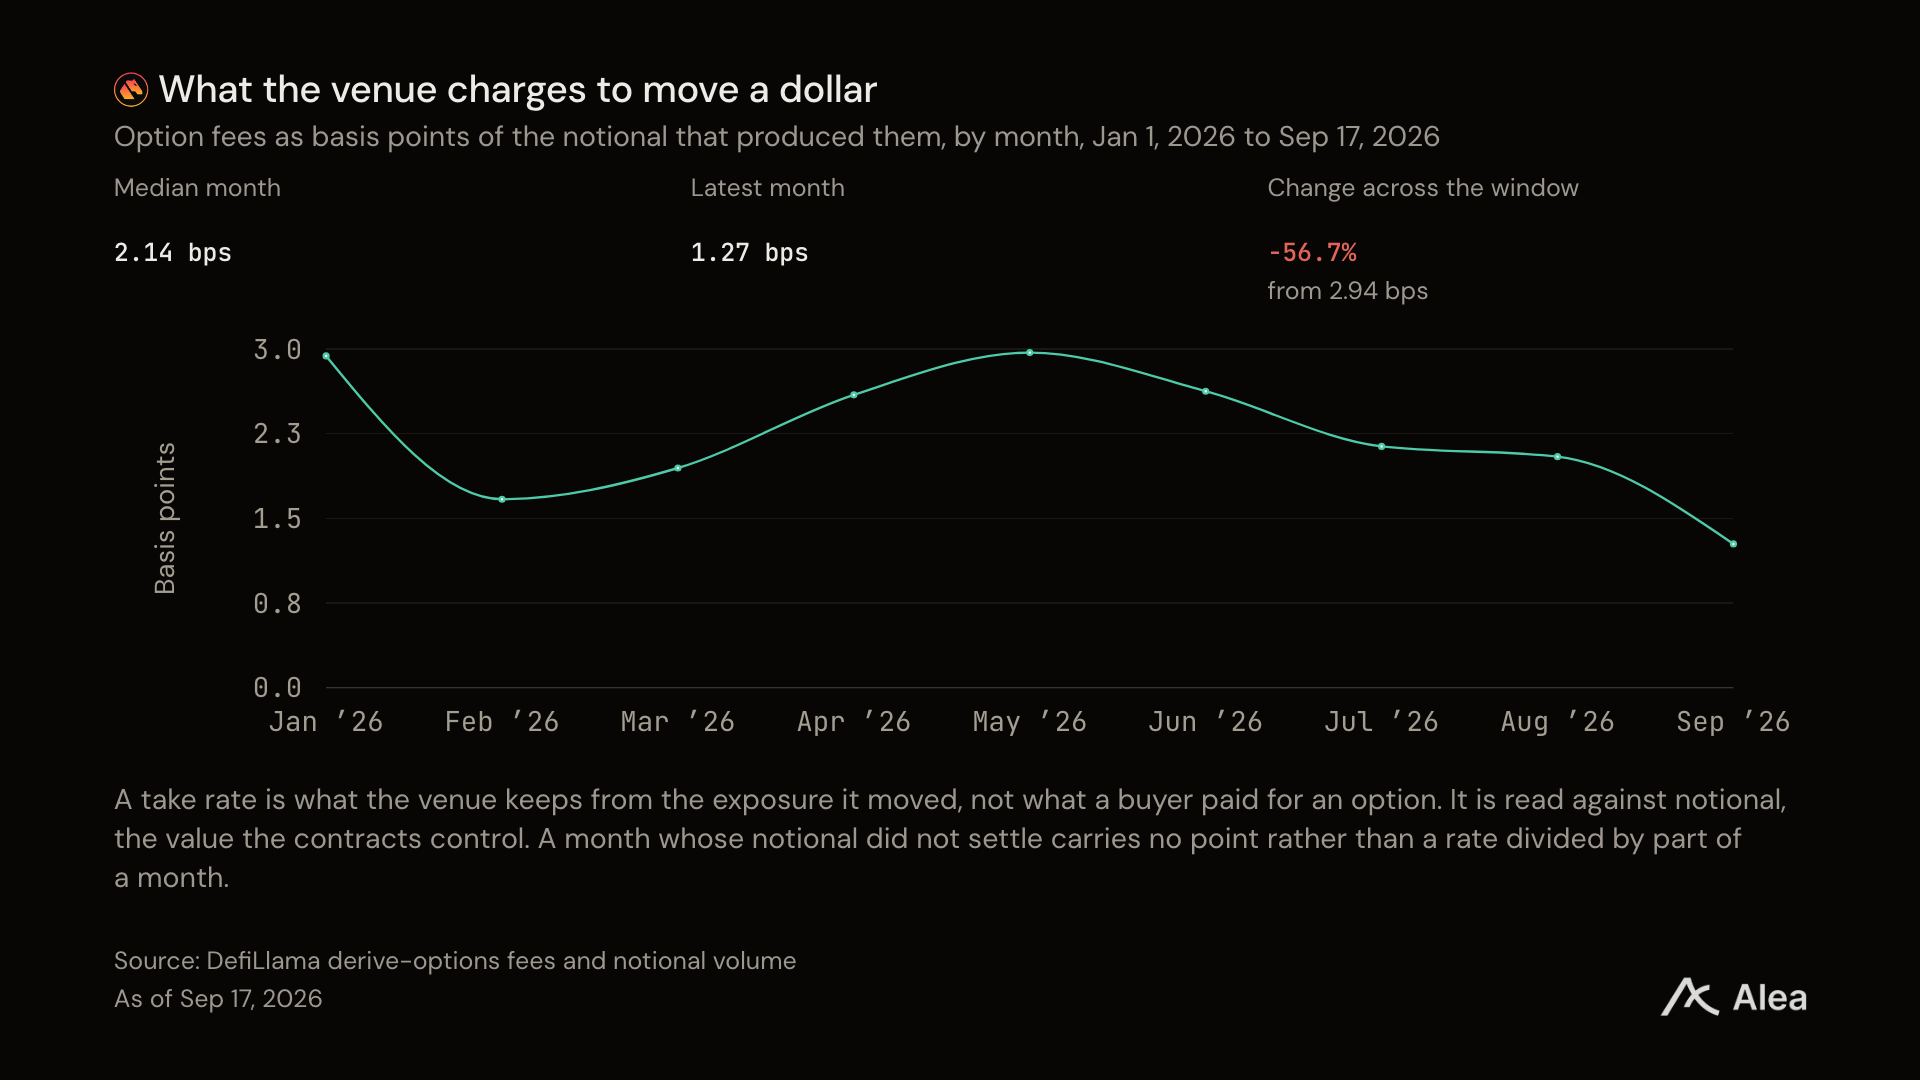
Figure: Proportion of options fees to nominal control amount of the contracts, by month: 2.94 cents for every 100 dollars in January, 1.27 cents in September.
The options fee rate fell from 2.94 cents for every 100 dollars traded in January to 1.27 cents in September, a decrease of 56.7% since the beginning of the year. Meanwhile, trading volume increased, and total fees still grew.
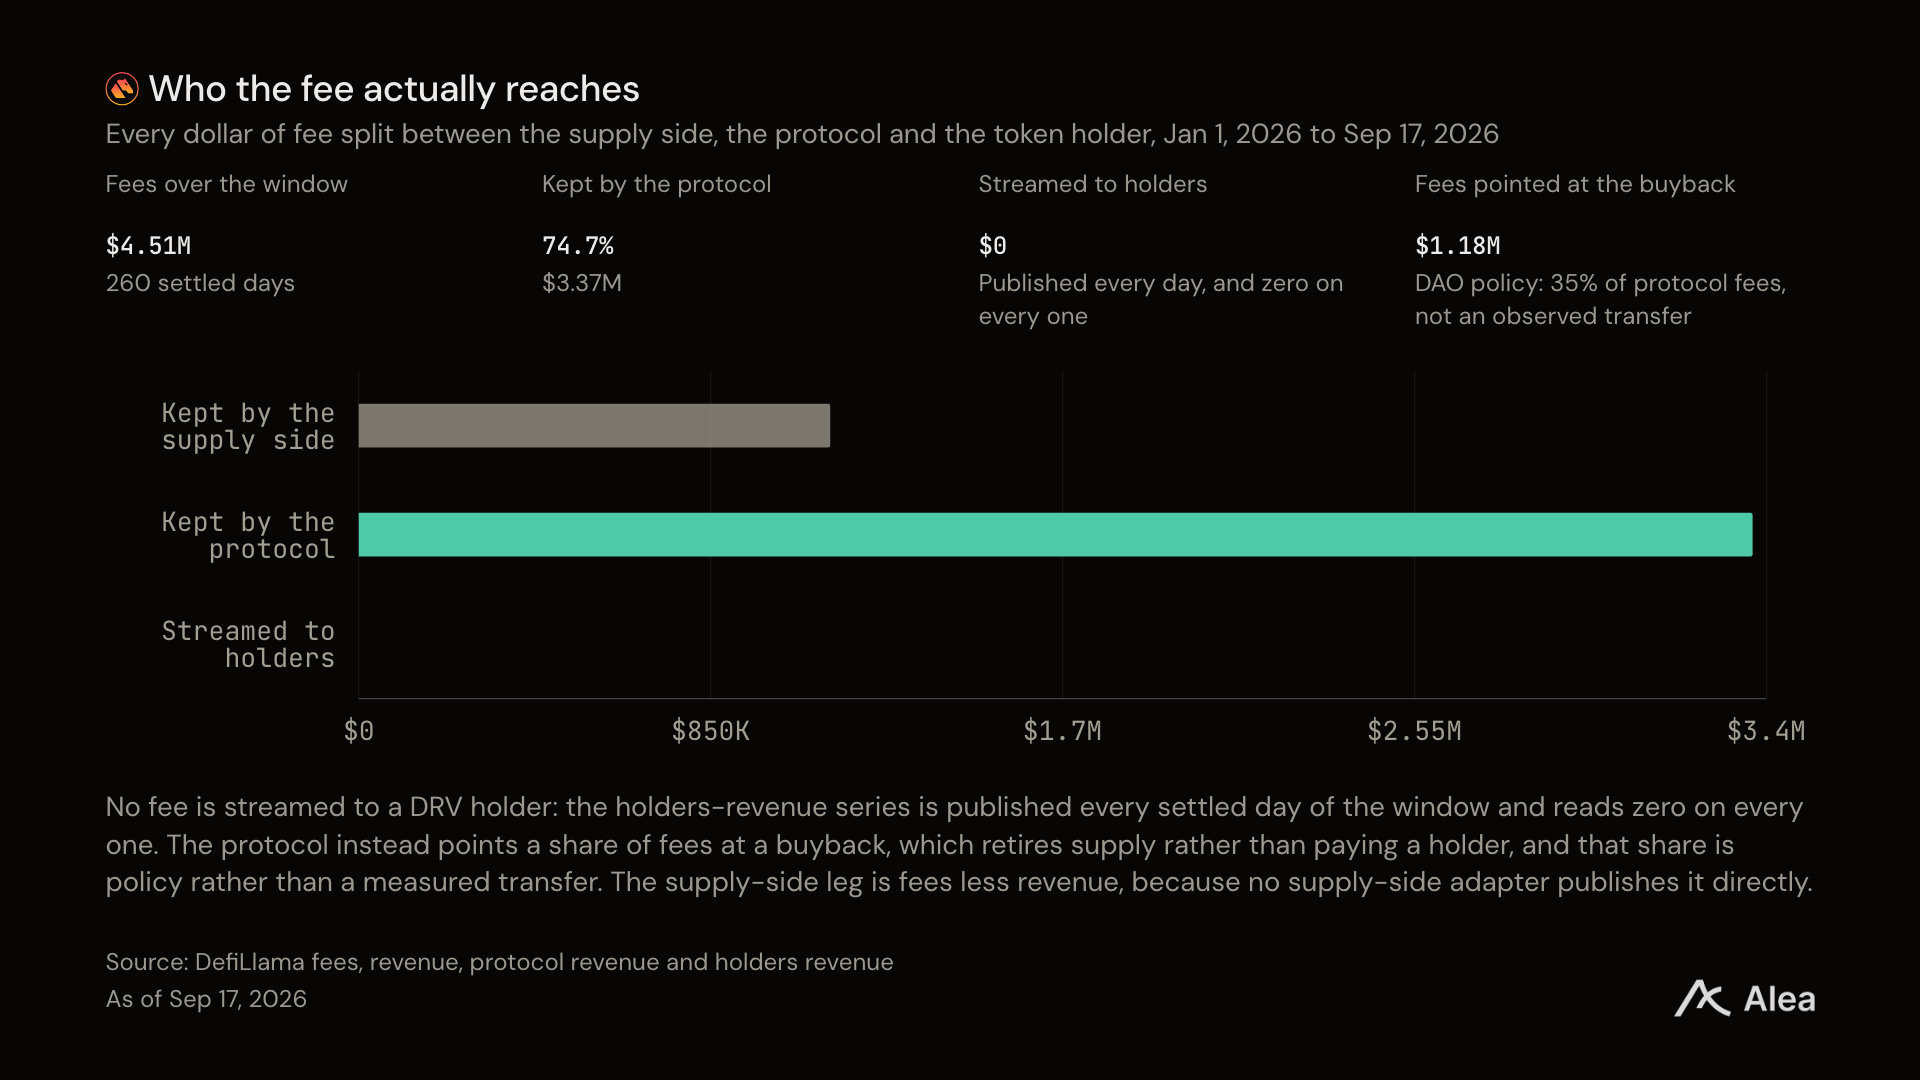
Figure: Distribution of each dollar of fees among quoting traders, the platform itself, and token holders.
Derive uses its share of fees for buybacks instead of distributions. It destroys supply rather than pays money to token holders.
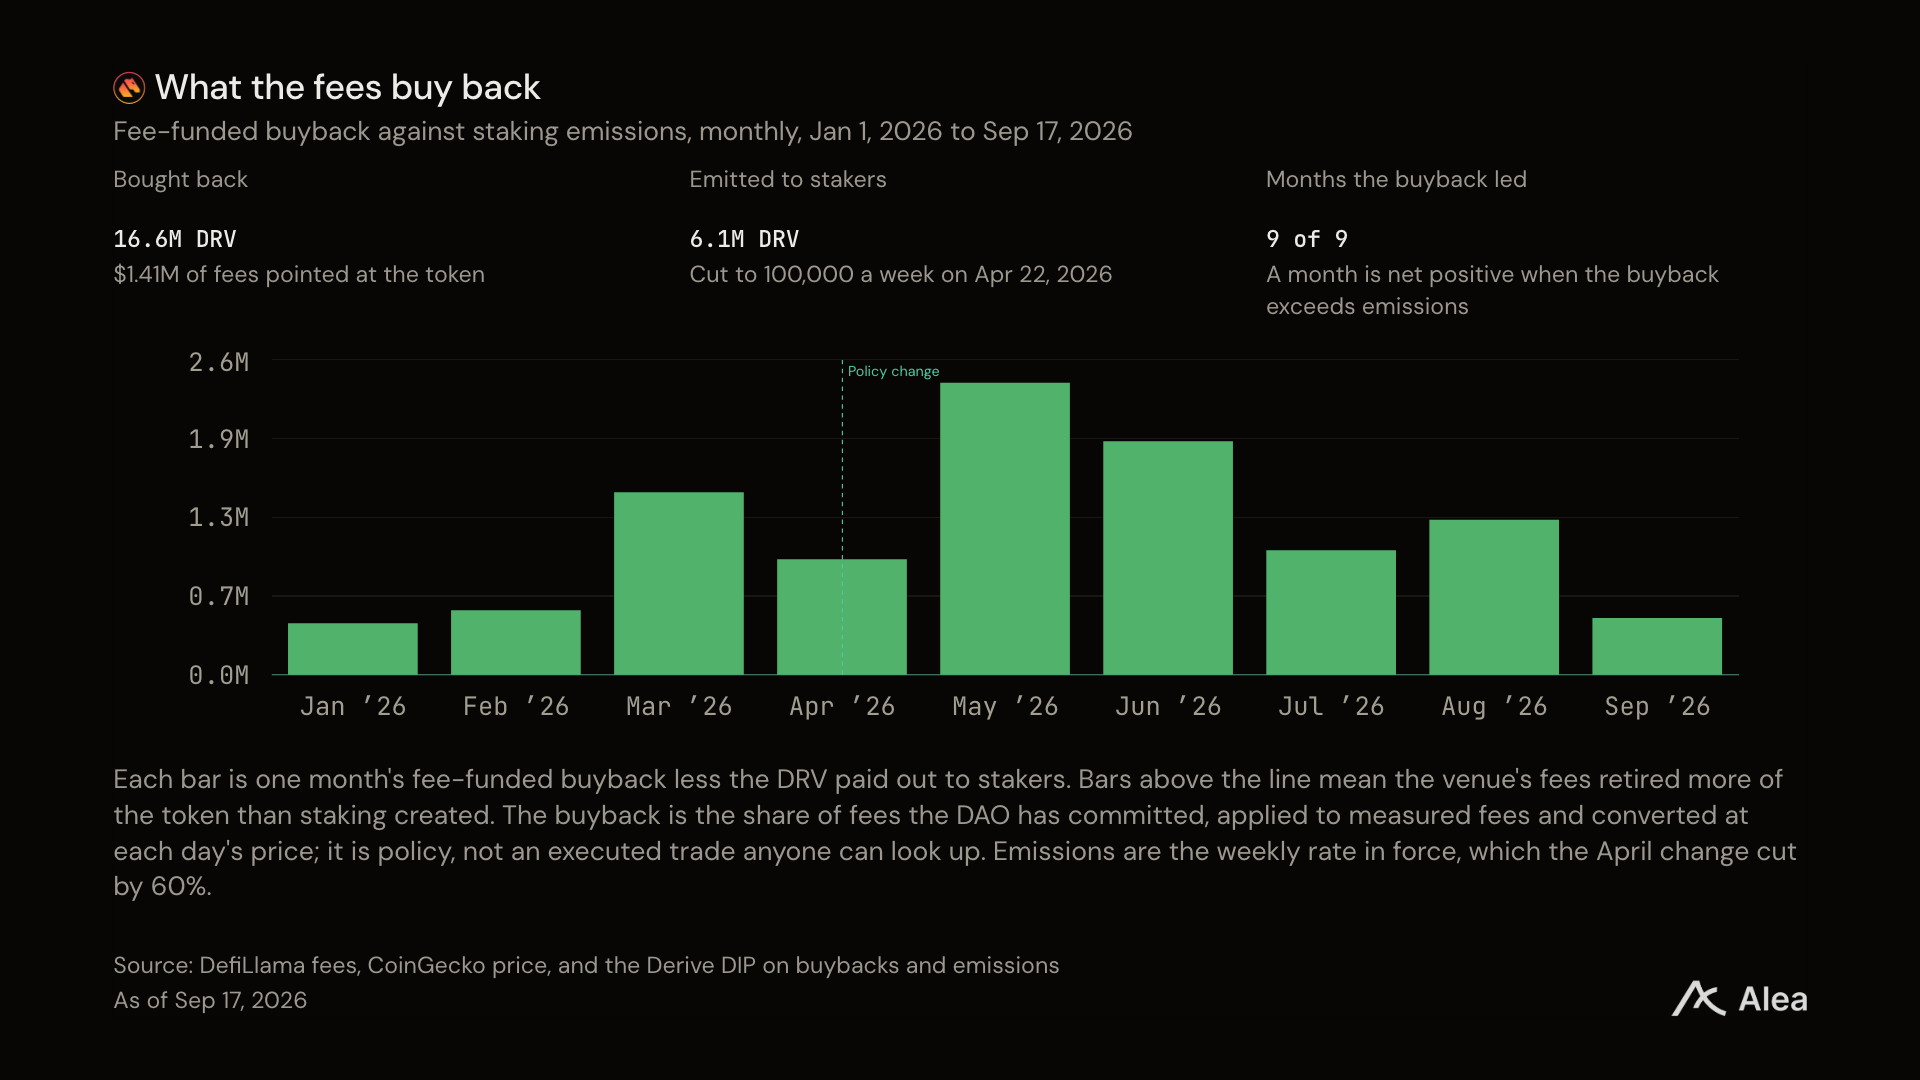
Figure: Each bar represents buybacks driven by fees over a month minus payments to stakers in DRV, in millions of DRV.
All nine months were positive: 16.6 million DRV destroyed, 6.1 million issued. The DAO has destroyed a total of 27,645,461 DRV, accounting for 35% of fees. In April, it raised this proportion from 25% and reduced weekly staking issuance from 250,000 DRV to 100,000, lowering the annual issuance rate from 3.8% to 1.5%. The unbonding period was shortened from 28 days to 7 days.
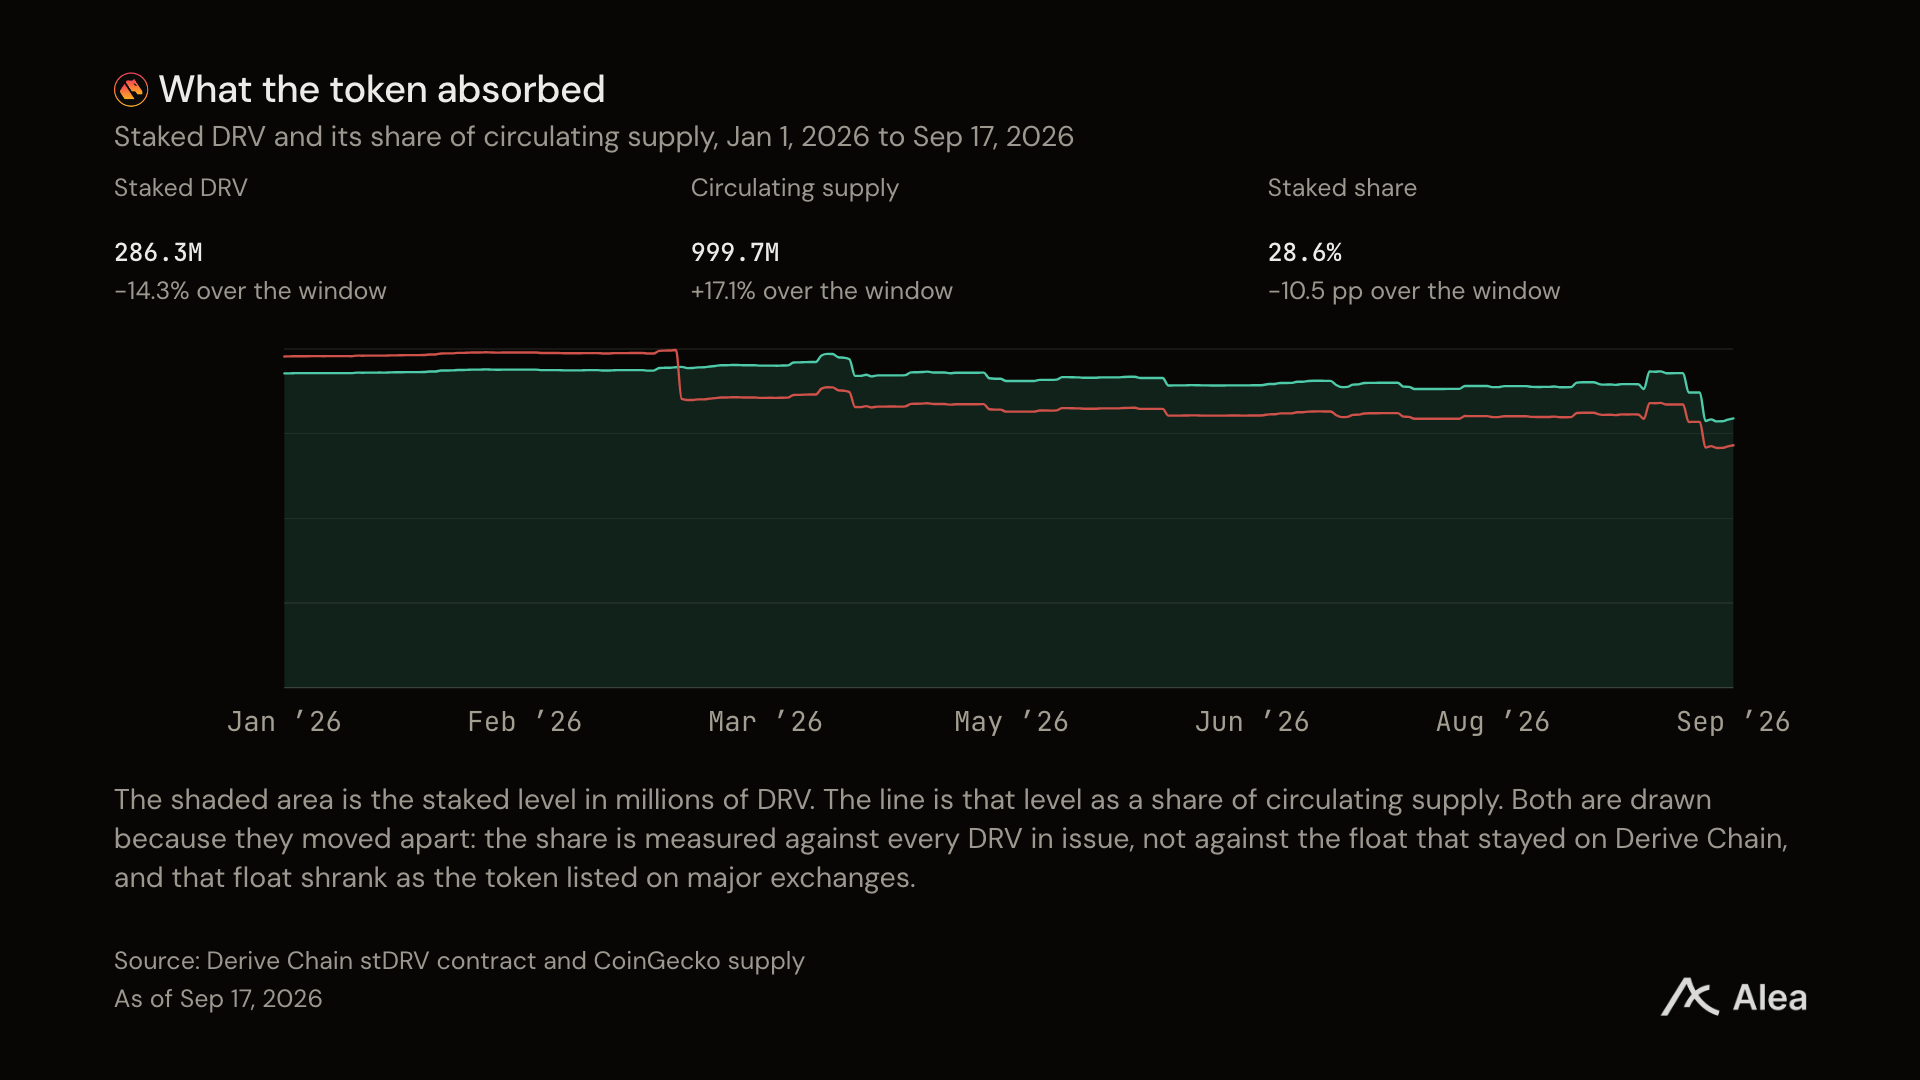
Figure: Staked DRV and its proportion of circulating supply, in DRV and percentage.
This year, circulating supply increased by 17.1%, while the staking proportion dropped from 39.1% to 28.6%.
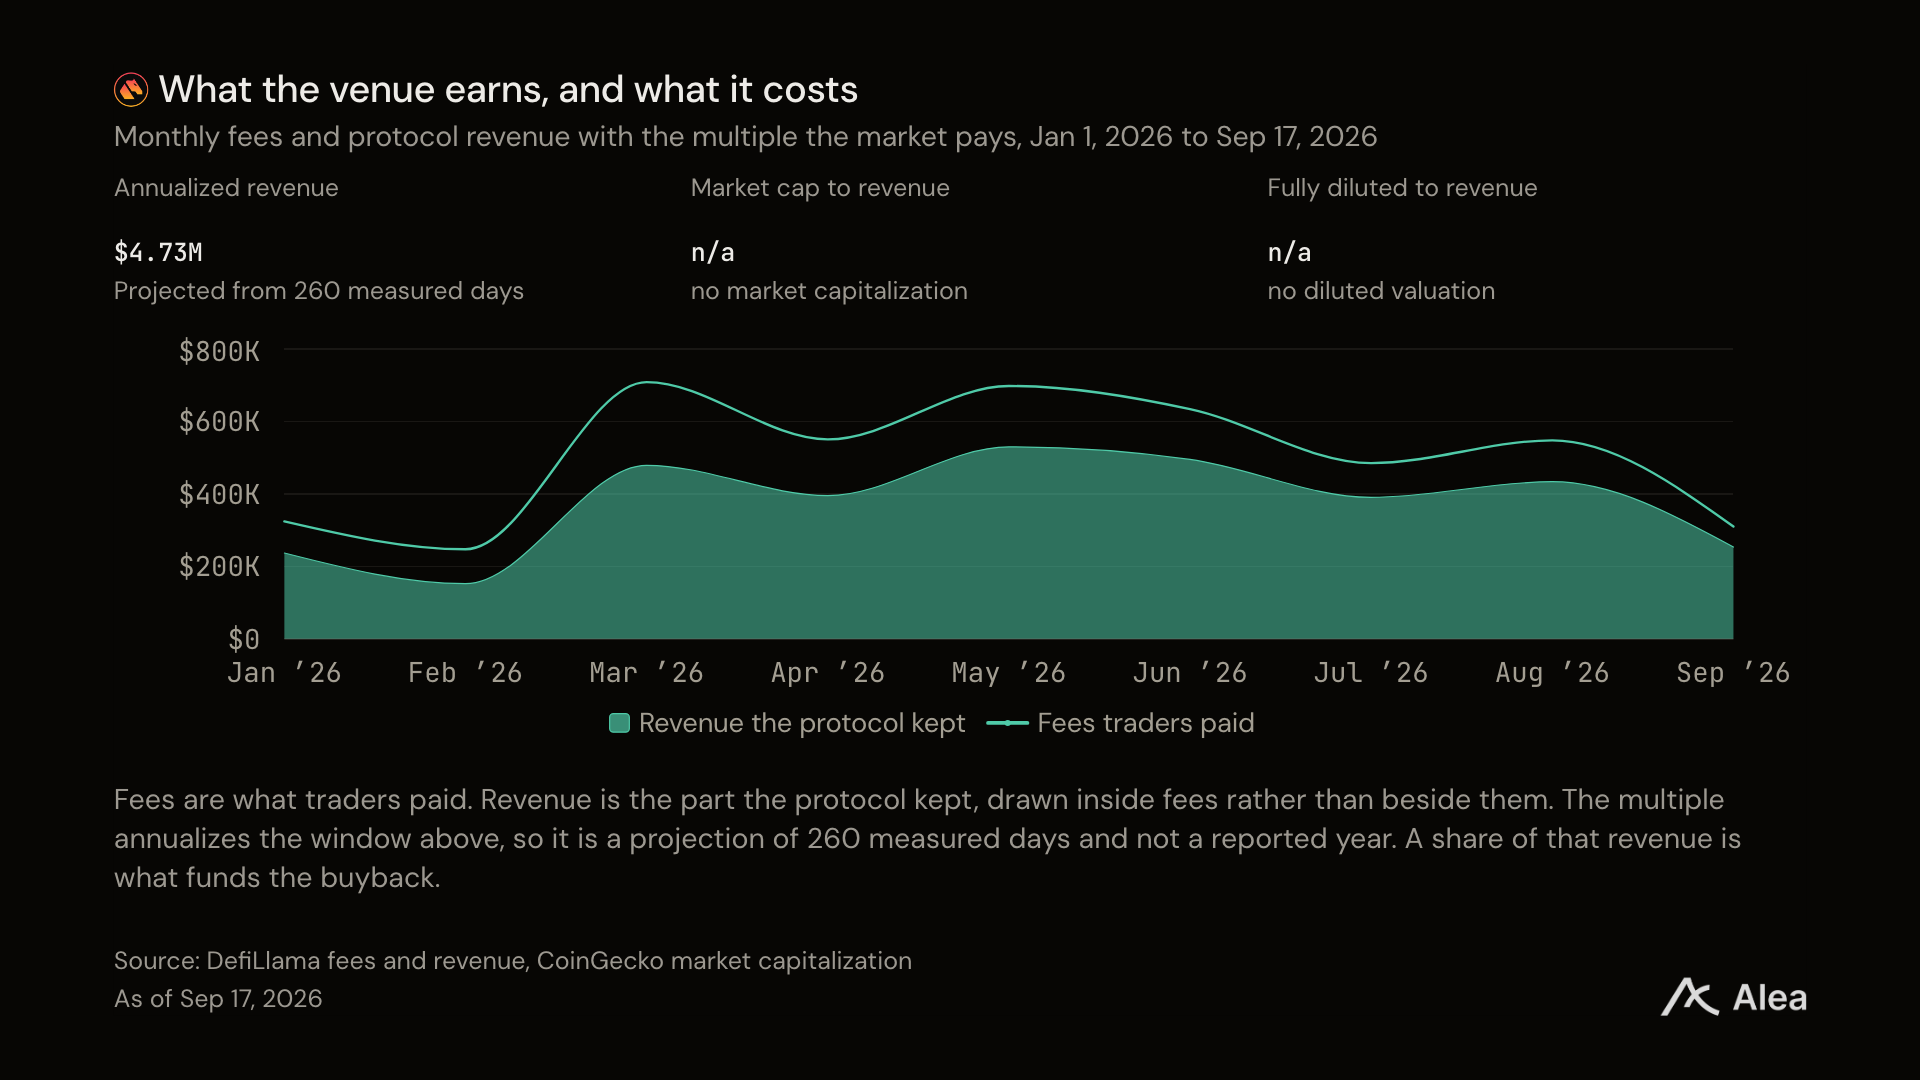
Figure: Monthly fees and the portion of revenue left for the platform, in dollars.
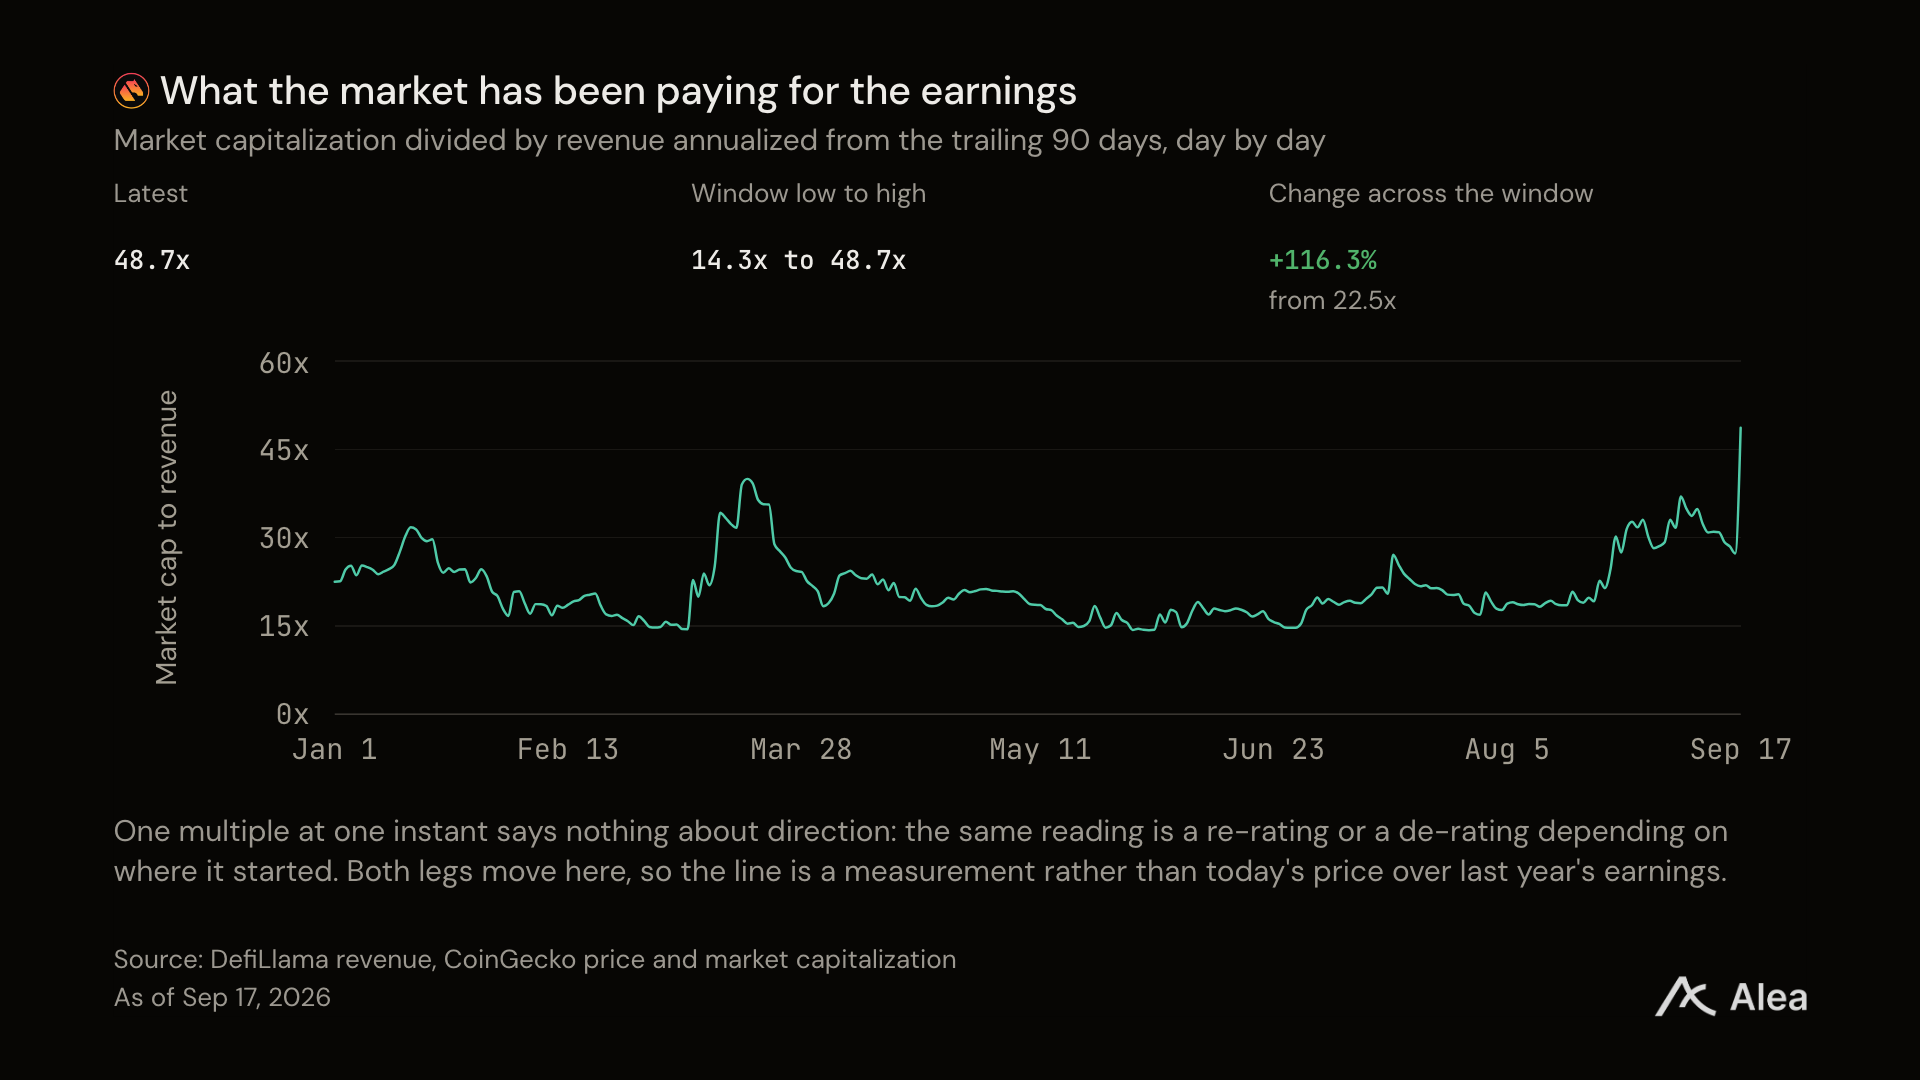
Figure: Market cap divided by annualized revenue over the past 90 days, changing daily.
The fluctuation of this multiple exceeds that of any other number this year. In January, the market paid 22.5 times the platform's annualized revenue, now it pays 48.7 times, an increase of 116.3%. The low point was 14.3 times. Revenue continued to grow in the same months, indicating that the repricing was not due to a shrinking denominator.
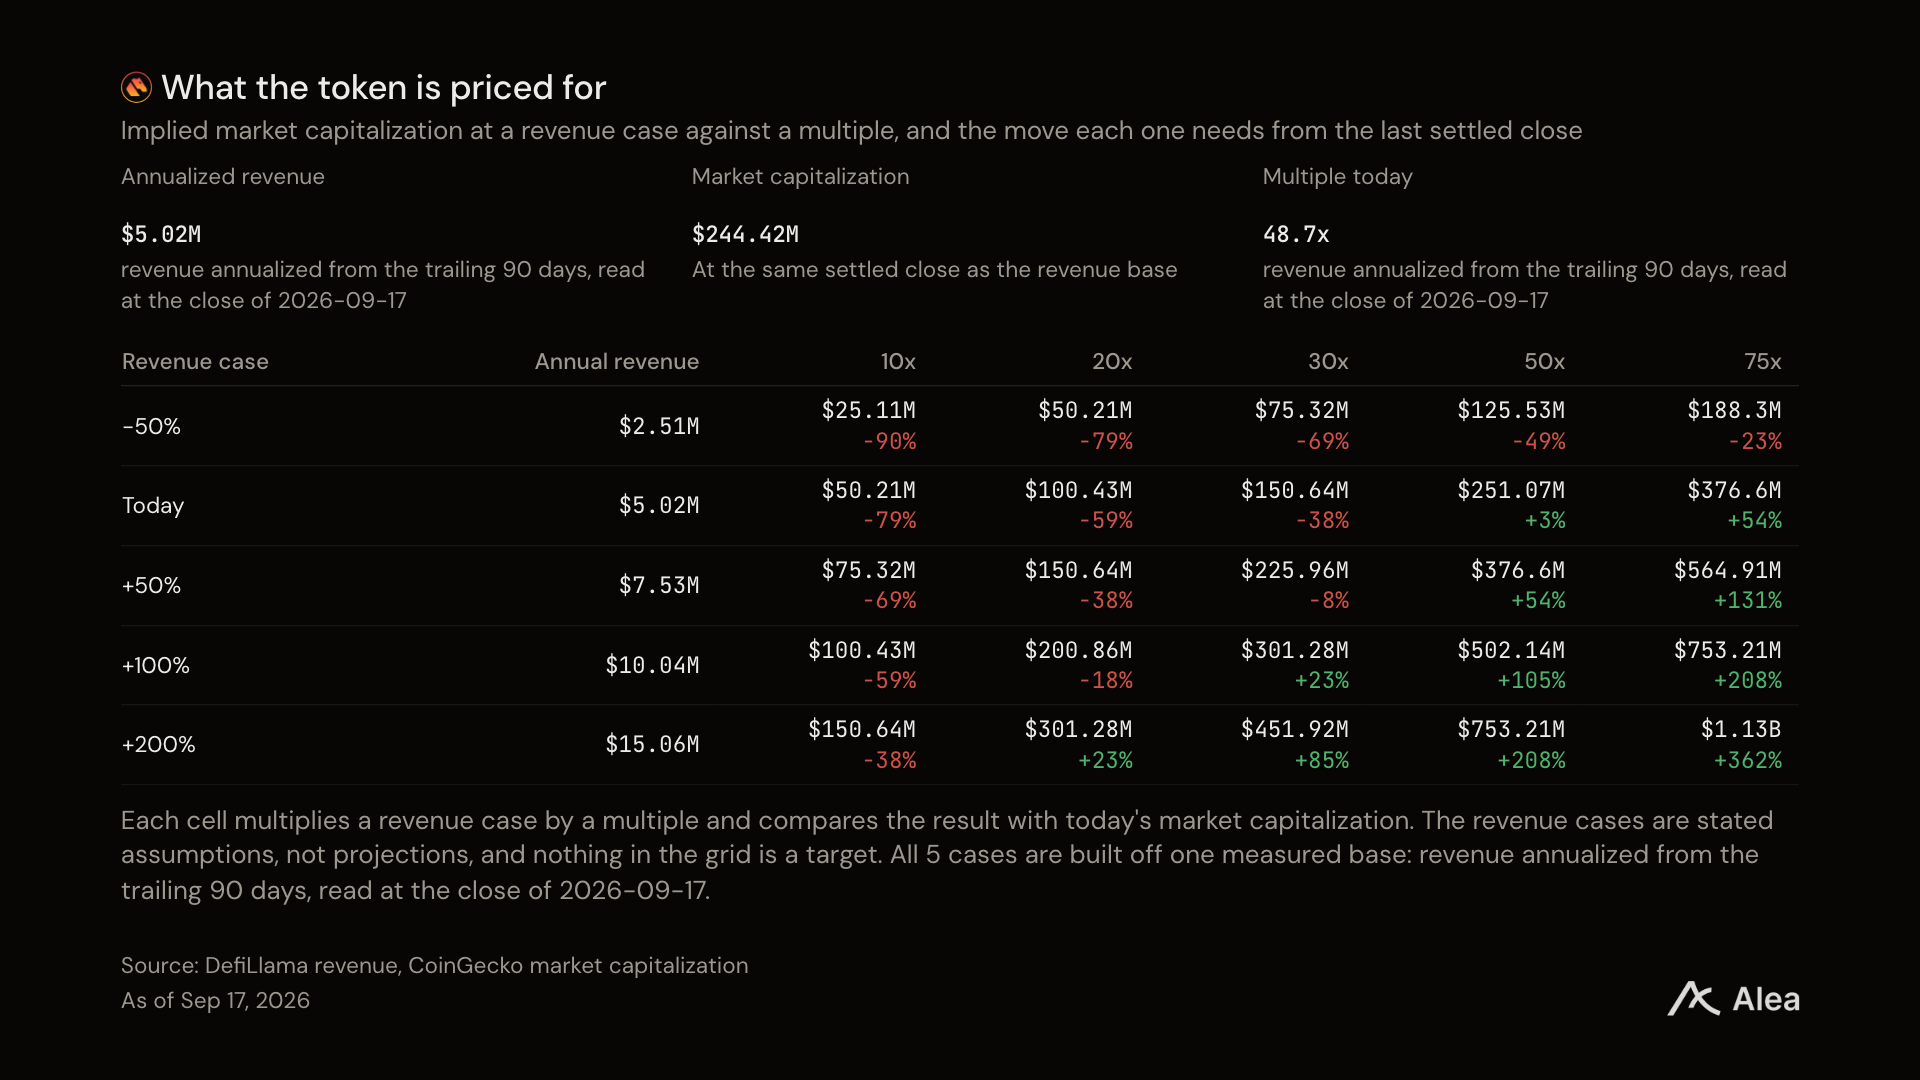
Figure: Implied market cap corresponding to a revenue scenario, multiplied by the multiple, in dollars, and the required price change from the most recent closing price to each scenario.
Below 48.7 times, the revenue corresponding to the price must continue to grow to support the valuation. The table prices each assumption.
Established arrangements
On September 14, a member submitted a proposal to deploy Derive V3. Matching and order status transitions will run inside a zero-knowledge virtual machine and settle to Ethereum. User funds will be stored in Ethereum contracts. Once the positions, balances, and rewards of V2 are migrated to the genesis state of V3, Derive Chain will gradually shut down. The stated goal is to reach L2Beat Stage 1, meaning users can exit without operator assistance.
On September 16, Derive announced the appointment of Alex van Voorhees as Chief Legal and Compliance Officer. He previously came from FalconX, where he was responsible for derivatives legal matters and served as interim compliance officer.
V3 settles on Ethereum, with the ZEC ledger currently running until March 2027. The platform reported that, among 89,100 ETH call options that month, 96% had strike prices of either 5,000 dollars or 7,000 dollars, all positioned in Derive.
免责声明:本文章仅代表作者个人观点,不代表本平台的立场和观点。本文章仅供信息分享,不构成对任何人的任何投资建议。用户与作者之间的任何争议,与本平台无关。如网页中刊载的文章或图片涉及侵权,请提供相关的权利证明和身份证明发送邮件到support@aicoin.com,本平台相关工作人员将会进行核查。


