Cryptocurrency Circle Scholar: September 23 Ethereum (ETH) rising momentum conceals risks, has the trend structure broken yet? Latest market analysis reference
The current price of Ethereum is 2735, feeling uncomfortable for missing out, also hard to hold positions, these are the emotions encountered by several coin friends before the article was published. Trading is a long-term battle, not a one-time game to determine win or loss. Do not envy my consecutive profits going north this time; everyone's trading system and risk tolerance are different. There is no need to force yourself to participate in every wave of the market. Choosing to observe when you do not understand is also a trading strategy. Maintain the bottom line of trading, control your positions, and respect market risks.
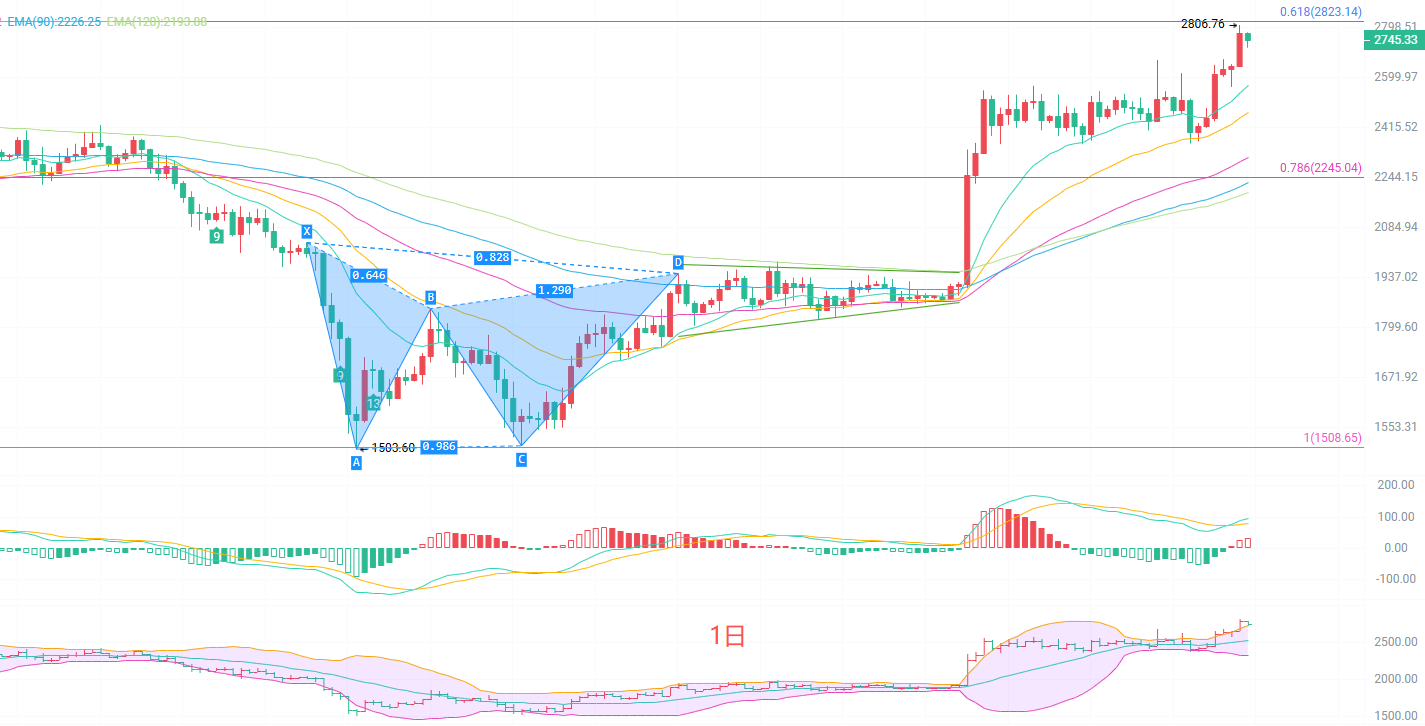
The daily K-line bull trend remains intact. The Bollinger Bands are opening upward, with prices running near the upper band, and there is a short-term demand for pressure and correction. The MACD indicator maintains the red bars, with DIF and DEA in a bullish arrangement; bullish momentum is still present, but the red bars are converging, and the upward strength is slowing down. The first resistance level above is 2823, and strong support below is 2445. The overall structure of the daily line is still an upward trend after a bottom reversal. Before there is an effective breakdown, it is not advisable to easily turn bearish on the larger direction.
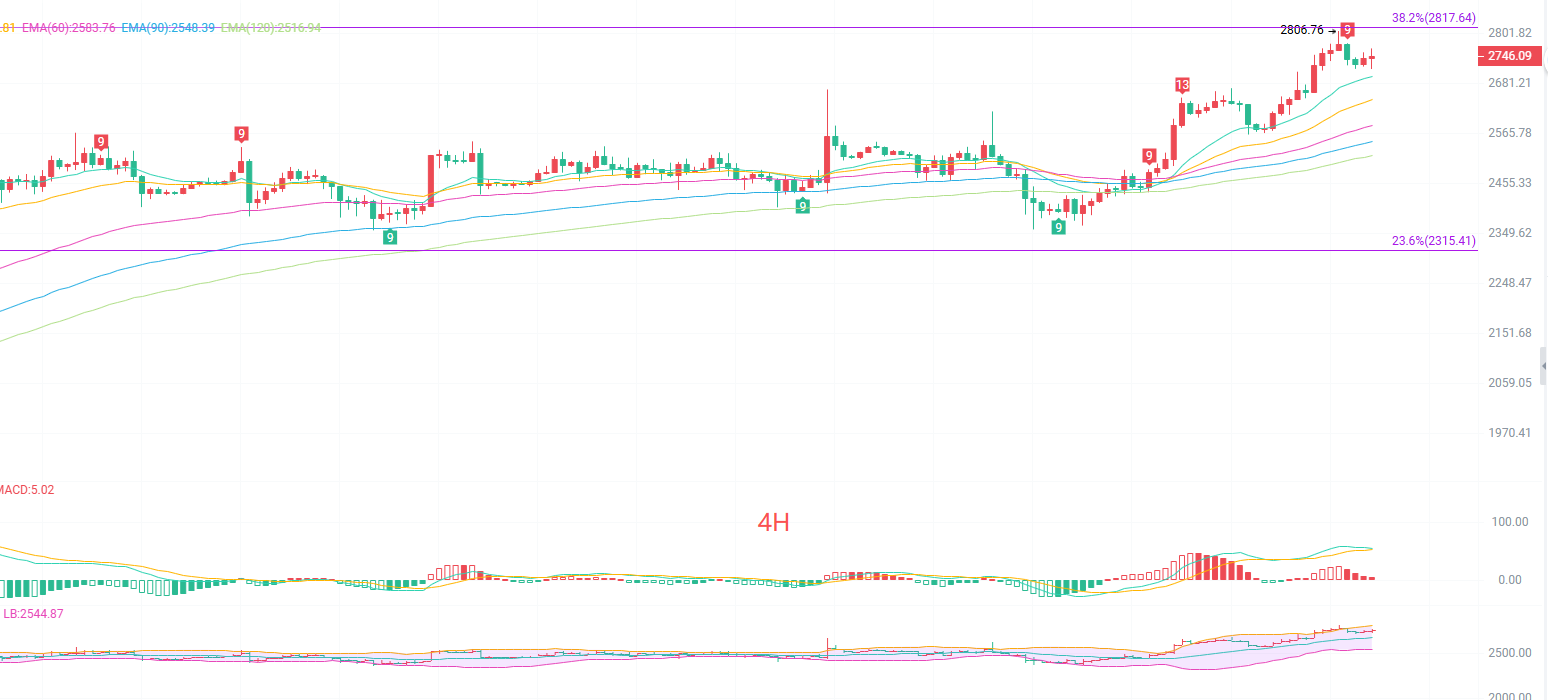
The four-hour K-line represents a normal pullback during the upward process. The moving average system is in a bullish arrangement, and prices are still supported by the EMA moving average. The upper Bollinger Band around 2800 is forming a resistance, and the middle band at 2640 is a key short-term support. The MACD bullish momentum is waning, with an expectation of forming a death cross, indicating a need for short-term oscillation adjustment. The upward structure in this round is clear; as long as the key support does not break during the pullback, it belongs to the bullish accumulation. Once the moving average support is broken, the short-term market will shift into deep oscillation.
Short-term reference: Trying to short can only be a short-term game, not suitable for heavy positions on a long-term basis.
If the price breaks above from 2680 to 2640, stop loss at 40 points, target at 2780 to 2850.
If the price does not break down from 2810 to 2840, stop loss at 40 points, target at 2780 to 2720.
Specific operations should be based on real-time market data; for more information details, you can consult the author. The article may have a posting delay; it is suggested for reference only, risks borne by oneself.

Warm reminder: The above content is solely created by the author of the public account; the advertisements at the end of the article and in the comment area are unrelated to the author, please discern with caution, thank you for reading.
免责声明:本文章仅代表作者个人观点,不代表本平台的立场和观点。本文章仅供信息分享,不构成对任何人的任何投资建议。用户与作者之间的任何争议,与本平台无关。如网页中刊载的文章或图片涉及侵权,请提供相关的权利证明和身份证明发送邮件到support@aicoin.com,本平台相关工作人员将会进行核查。