Crypto Circle Academician: After the main upward wave of Bitcoin (BTC) on September 23, the accumulation phase, in-depth interpretation of the high-level volatility structure? Latest market analysis and operational advice interpretation.
Current Bitcoin price is 86,200. The market will never simply move in the direction we expect; technical analysis is just a judgment of probabilities, not a standard answer. Now, the high-level market fluctuations will become very fierce, and before entering a position, one must think about the bottom line of loss and not hold onto the idea of enduring a loss. Do not envy my profits; preserving your own capital should always be the priority. Opportunities are always there; I have been heading north all the way.
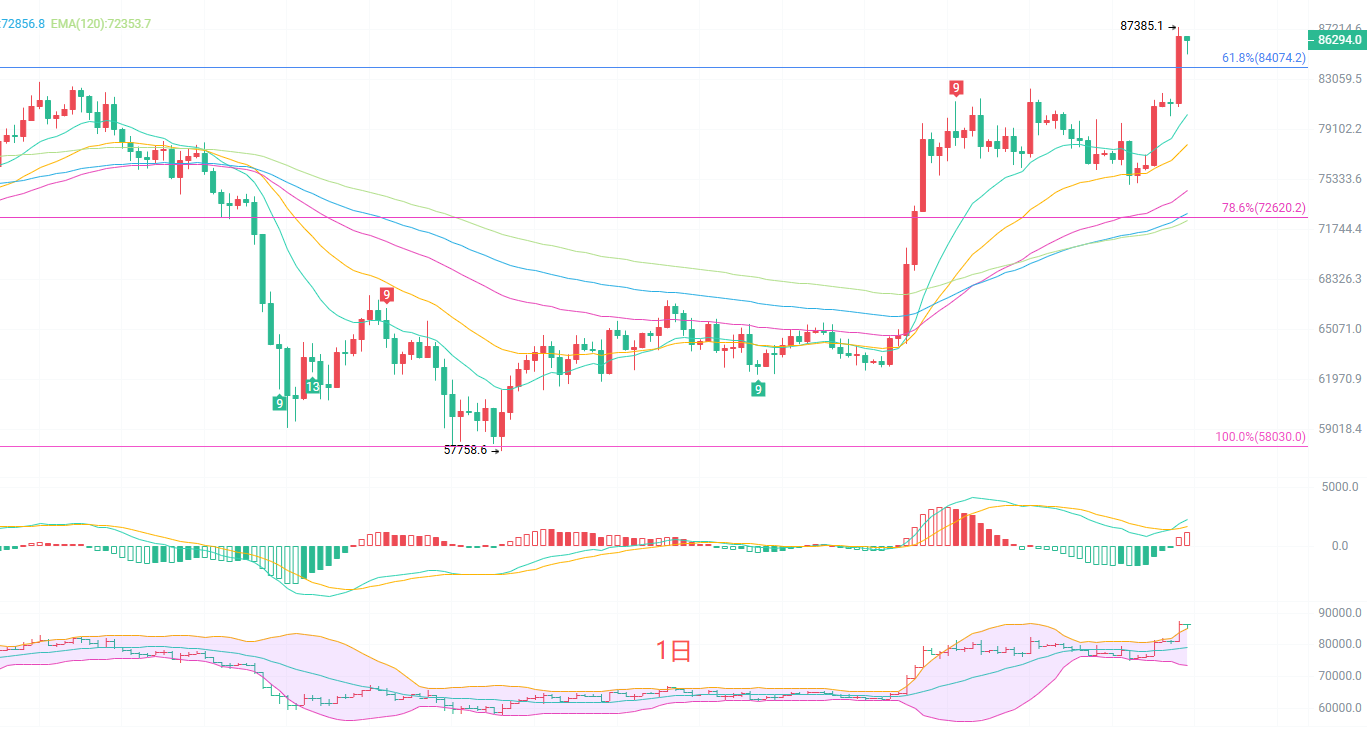
The overall trend of the daily K-line remains dominated by bulls. The EMA moving average system is fully diverging upwards, and the short-term moving averages are continuously supporting the price from below, indicating that the medium-term upward momentum has not completely waned. The MACD bullish trend structure is intact; the Bollinger Bands are opening upwards, and the price operates near the upper band, which is a characteristic of strong market. However, it is necessary to note that after a continuous rise on the daily line, there are signs of gradual shrinking of the red bars, indicating that the upward strength is slowing down, and there is a possibility of a volatile pullback for accumulation at any time; one should not blindly chase high prices.
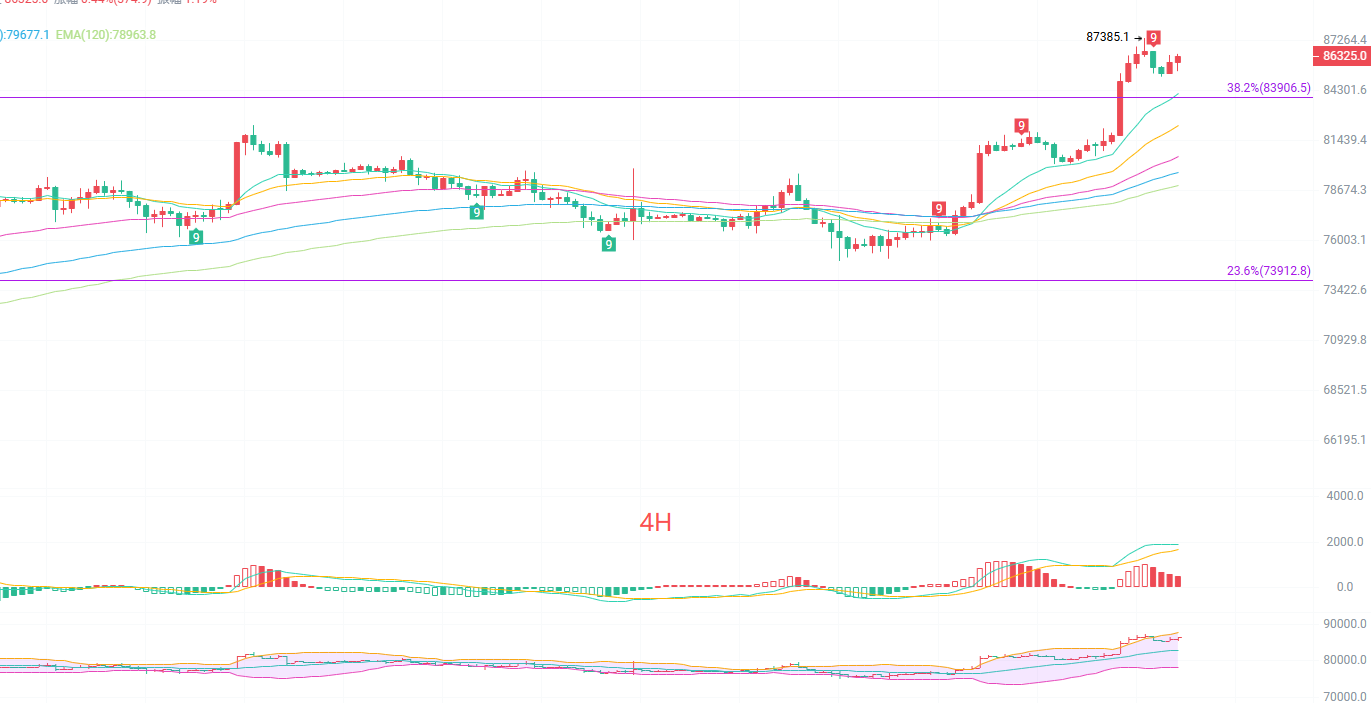
The four-hour K-line is in a high-level volatility range. The EMA short, medium, and long-term moving averages are still in a bullish arrangement, and the price remains steadily above all the moving averages. The key support below is 83,906. The MACD red bars continue to shorten, indicating a weakening bullish momentum and a warning signal of a top divergence; the upper Bollinger Band is under pressure, and the K-line begins to form upper shadows, indicating a gradual emergence of short-term pullback demand. As long as the four-hour level does not effectively break below the moving averages, the overall structure remains bullish, but short-term views should prioritize digesting the high-level volatility and wait for a pullback to support before reassessing the opportunity.
Short-term reference
For buying at 84,200 to 83,900, with a stop loss of 500 points, target looking at adding positions after breaking 87,400 and continuing to look north.
For selling at 87,000 to 87,400, with a stop loss of 500 points, the counter-trend short positions should be very small; once a new high is broken, one must decisively exit.
Specific operations should be based on real-time data from the market. For more detailed information, you can consult the author. There may be delays in the publication of the article; it is suggested to consider as reference with risks taken on personal responsibility.

Kind reminder: The above content is solely created by the author on the public account. The advertisements at the end of the article and in the comments section are unrelated to the author. Please discern carefully, thank you for reading.
免责声明:本文章仅代表作者个人观点,不代表本平台的立场和观点。本文章仅供信息分享,不构成对任何人的任何投资建议。用户与作者之间的任何争议,与本平台无关。如网页中刊载的文章或图片涉及侵权,请提供相关的权利证明和身份证明发送邮件到support@aicoin.com,本平台相关工作人员将会进行核查。