Author: Insightful Conversations
We start with an industry-leading gold outlook of $2,000 per ounce for 2024, feeling that we were nearing peak levels. By mid-2025, we delved deeper into gold and proposed a new industry-leading outlook, adding nearly $2,000 per ounce to our expectations. In February, we believed we had identified a path to reach $6,100 per ounce by 2030. Since then, rate expectations have shifted from 1-2 rate cuts to multiple rate hikes. 
In this report, we revisit the relationship between gold and interest rates, assess the evolving stance of the U.S. Treasury and the Federal Reserve on inflation, and examine how potential rate hike cycles might affect gold prices.
We have lowered our gold price forecast for 2030 to $5,600 per ounce, but emphasized a key finding: gold can rise in an environment of slowly increasing real rates – which is the trajectory we currently seem to be on.
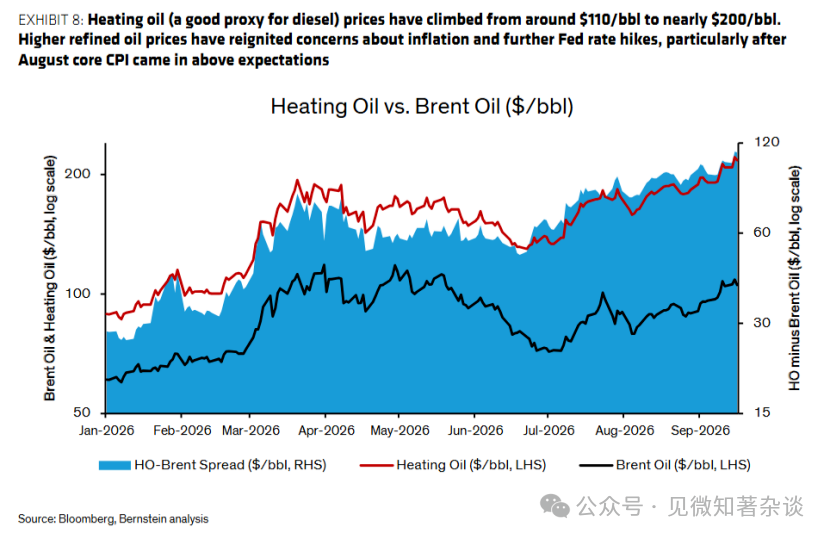
The war in the Middle East and the attack on Russian refineries by Ukraine have driven up diesel prices (Chart 8), intensifying inflationary pressures. The Federal Reserve raised its inflation expectations in June and again at the recent Federal Open Market Committee meeting (Chart 6).
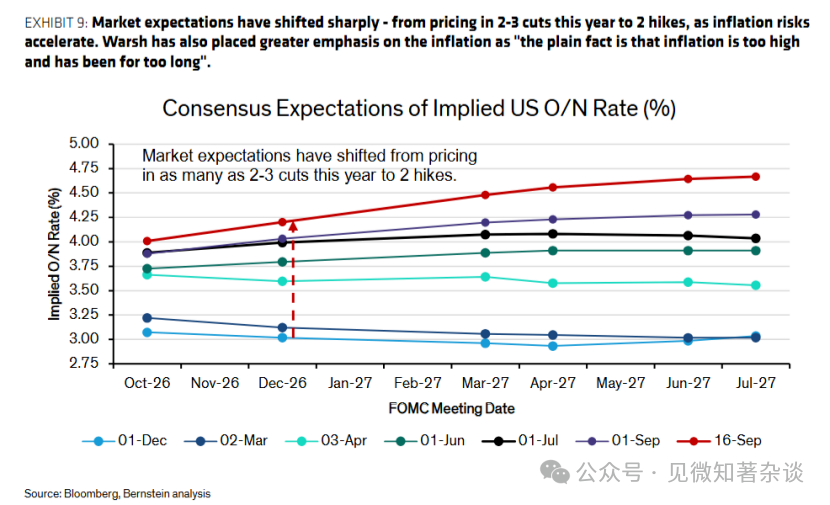
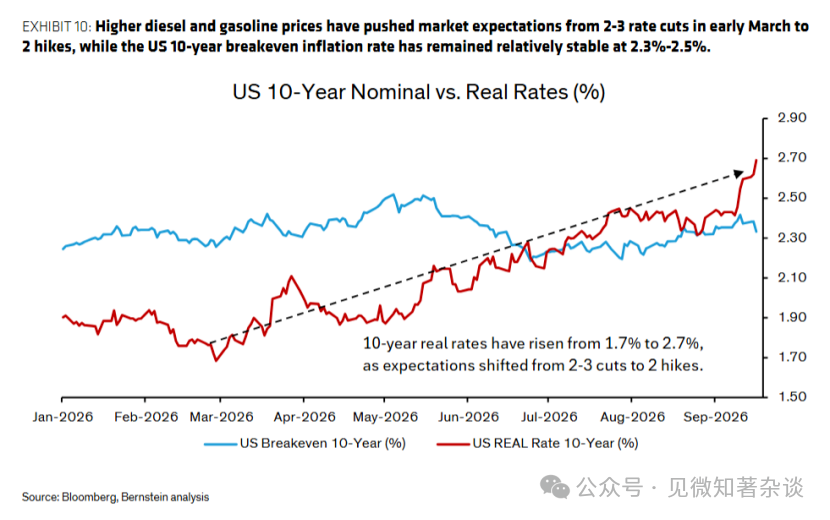
As a result, market expectations have shifted from 1-2 rate cuts at the beginning of the year to 2-3 rate hikes before 2027 (Chart 9). Real rates have correspondingly risen, from 1.7% in early March to around 2.7% now (Chart 10).
Trump believes U.S. rates should be at 1% or lower; Bessent hopes for lower long-term rates; while Waller wants to curb inflation.
So far, Waller seems to be in a dominant position; the Federal Reserve has raised rates and hinted at further hikes by 2027 (Chart 2). The vast majority of Federal Open Market Committee participants believe at least one more hike of 25 basis points is appropriate.
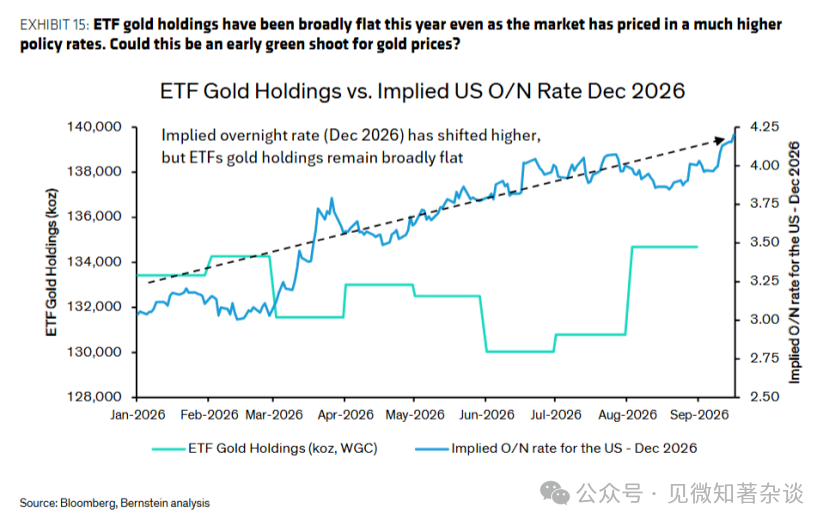
Historically, gold has had a negative correlation with real rates, and this relationship is evident in the flow of gold ETFs (Chart 14). However, despite significant rises in real rates, gold ETF holdings remained essentially stable in August (Chart 15).
Some data even show an increase in holdings following the latest Federal Open Market Committee meeting. This echoes gold's performance during 2023-2025, when gold prices continued to climb amid rising real rates (Chart 1).
Gold also unexpectedly weathered last week's rate hike, rising slightly throughout the week. Overall, the recent trends in ETF flows and gold's price performance post-Federal Open Market Committee meeting suggest that even if the market's expected 2-3 rate hikes are realized, gold may still show resilience.
We still believe that central banks have not yet completed the process of diversifying reserves from USD and other G7 currencies into gold (Chart 16). Several countries with substantial foreign exchange reserves, including China, Japan, Saudi Arabia, South Korea, Singapore, Brazil, Mexico, and the UAE, still have gold comprising less than 10% of total reserves (Chart 13), allowing plenty of room for future accumulation.
What factors could go wrong? A slowdown in central bank gold purchases remains the primary risk.
Global refining capacity constraints could keep diesel and other refined oil prices elevated, further exacerbating inflation pressures into 2027. This could, in turn, drive further rate hike expectations and higher real rates, which historically have pressured gold ETF inflows, although this relationship has significantly weakened this year. Lastly, if Trump loses his Congressional majority in the midterms, investors may perceive reduced geopolitical risks, thus weakening safe-haven demand for gold.
The Future of U.S. Interest Rates
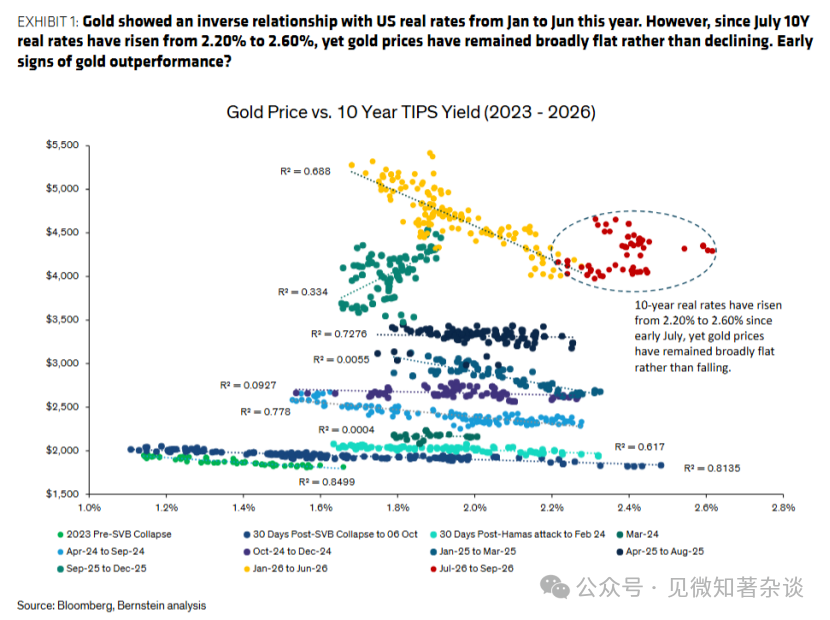
There is a clear negative correlation between gold and real rates (Chart 1). Since 2023, due to safe-haven sentiment (the collapse of Silicon Valley Bank, Israel/Hamas conflict) and central bank gold purchases, gold prices have been re-rated, making this relationship less straightforward.
Therefore, aside from ongoing central bank purchases of gold, the future of U.S. interest rates might be the second most important variable in our gold bull market theory.
Chart 1: Gold Price vs. 10-Year Inflation-Protected Bond Yields (2023-2026)
From January to June of this year, gold prices were negatively correlated with U.S. real rates. However, since July, the 10-year real rate has risen from 2.20% to 2.60%, while gold prices have remained stable rather than falling. Is this an early signal of gold's price performance exceeding expectations?
Trump wants to lower rates.
After the recent rate hike decision, Trump commented, “U.S. rates should be at 1% or even lower, as we are clearly the world’s highest quality credit… Lower U.S. rates, and act quickly!” However, he subsequently publicly supported Waller, who he has had a long-standing private relationship with, while criticizing the broader Federal Open Market Committee. Current Federal Reserve Board members include former Chair Jay Powell (whom Trump criticized for not cutting rates in a timely manner) and board member Lisa Cook (whom Trump sought to fire).
Bessent hopes for lower long-term rates.
The U.S. Treasury announced on August 19 that it would double its long-term buyback scale, increasing from $2 billion at a time to at least $4 billion, covering bonds from 10 to 30 years, from September 9 to November 4. Within a day of the announcement, Bessent further stated that the operation scale could exceed $4 billion. On August 24, two senior Treasury officials said the Treasury could use its General Account (TGA) to help fund government bond purchases. Yields initially dropped on August 19, but had rebounded to starting levels by August 24.
Waller, on the other hand, takes the opposite stance, wanting to curb inflation.
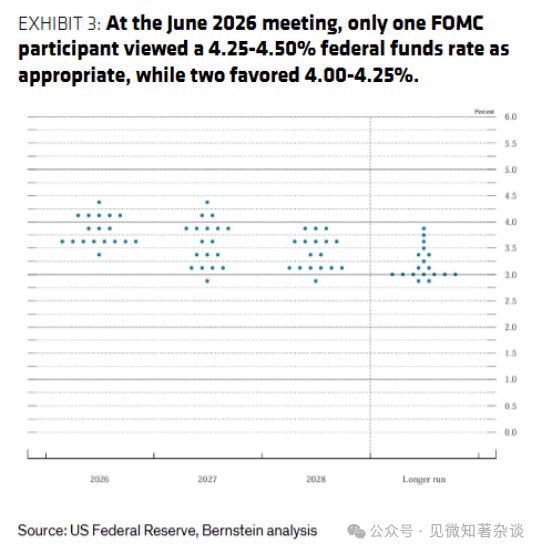
He emphasized that the current greatest concern for the Fed is inflation, rather than a weak labor market. The CPI released on September 11 was higher than expected, further confirming his worries. The Federal Reserve raised rates by 25 basis points last Wednesday, and officials initially planned another rate hike of 25 basis points in 2026. In the latest dot plot (Chart 2), eight Federal Open Market Committee participants believe keeping the federal funds rate between 4.25%-4.50% by the end of 2027 is appropriate, significantly higher than only one participant in June (Chart 3). Meanwhile, six leaned towards 4.00%-4.25%, up from just two in June.
Chart 2: Eight Federal Open Market Committee participants believe an additional 50 basis points hike is appropriate by 2027, while six expect a hike of 25 basis points.
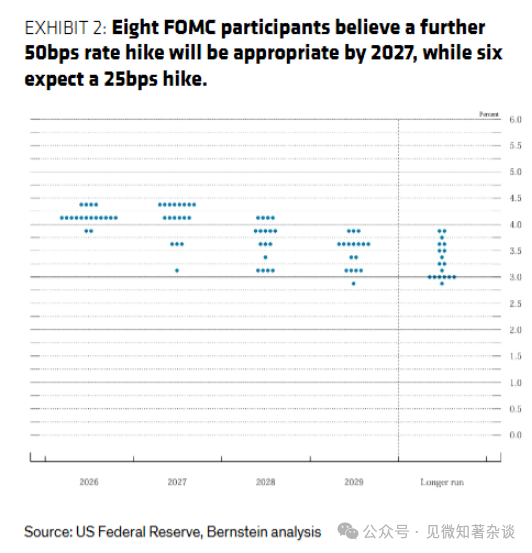
Chart 3: At the June 2026 Federal Open Market Committee meeting, only one participant deemed 4.25%-4.50% federal funds rate appropriate, with only two supporting 4.00%-4.25%.
The latest GDP growth, unemployment rate, and median inflation forecasts (Charts 4 to 7) help explain the shift in the dot plot. Federal Open Market Committee participants have raised their GDP growth expectations for 2026 and 2027 compared to June. More importantly, they now project core PCE inflation to reach 3.7% in 2026 (up from 3.6% in June) and to stay at 2.3% in 2027, while the unemployment rate forecast has been lowered from 4.3% in June to 4.1%.
If refining capacity continues to tight (since early March, diesel futures have risen by about 90%, see Chart 8), core PCE inflation expectations for 2027 may be further raised, potentially pushing up dot plot forecasts.
Chart 4: Fed officials' expectations for real GDP in 2026 and 2027
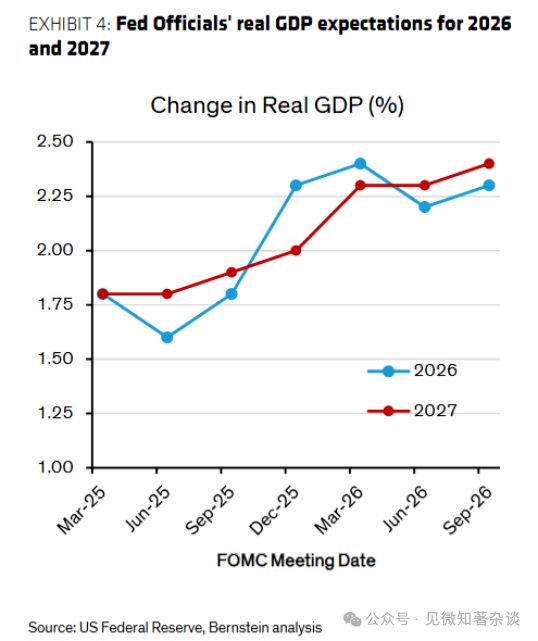
Chart 5: Fed officials' expectations for unemployment rates in 2026 and 2027
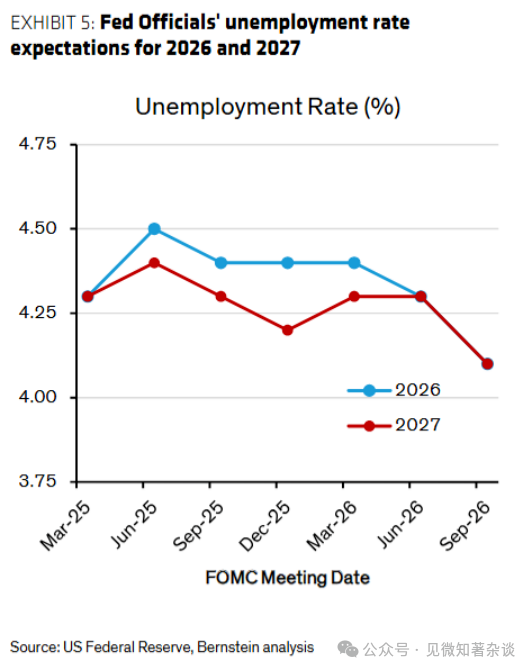
Chart 6: Fed officials' expectations for core PCE inflation in 2026 and 2027
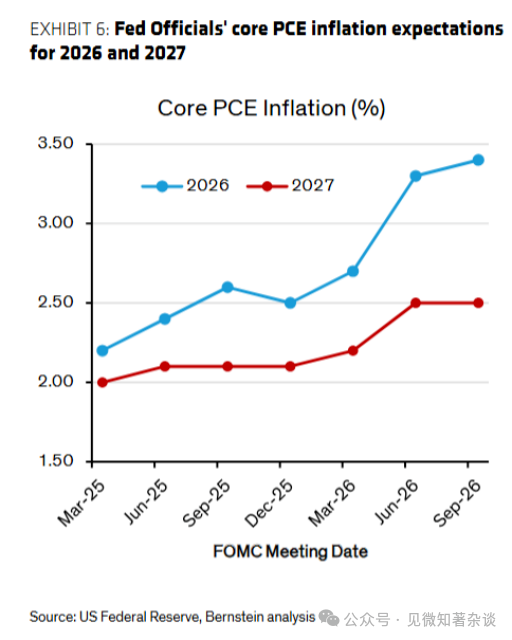
Chart 7: Fed officials' expectations for PCE inflation in 2026 and 2027
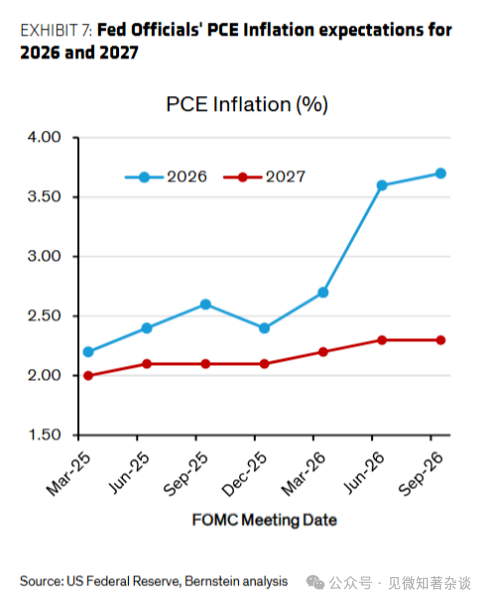
Chart 8: Heating Oil vs. Brent Crude (USD/barrel)
The price of heating oil (a good proxy for diesel) has climbed from about $110/barrel to nearly $200/barrel. The rise in refined oil prices has reignited market concerns about inflation and further rate hikes from the Federal Reserve, particularly after the August core CPI was higher than expected.
Combining the latest dot plot with Waller's comments – he found it "hard" to describe current rates as restrictive enough to slow the economy – we, like the market, believe there is room for further rate hikes in 2026 and 2027.
Federal Open Market Committee participants deem that two more hikes of 25 basis points by 2027 are appropriate (Chart 2), while the market currently prices in 2-3 hikes by mid-2027 (Chart 9).
Chart 9: Market Expectations for Implied U.S. Overnight Rates (%)
Market expectations have drastically shifted—from pricing in 2-3 rate cuts this year at the year's start to pricing in 2 rate hikes as inflation risks accelerate. Waller has also increasingly emphasized inflation, stating, "The fact is that inflation is too high and has been for too long."
Higher inflation expectations have raised market expectations for federal funds rates, in turn increasing real rates (Chart 10). While some attribute the rise in rates to concerns about U.S. fiscal outlook, we believe this year's fluctuations have primarily been driven by higher near-term inflation expectations.
Chart 10: U.S. 10-Year Nominal Rates vs. Real Rates (%)
Rising diesel and gasoline prices have shifted market expectations from expecting 2-3 rate cuts in early March to anticipating 2 rate hikes, while the U.S. 10-Year Breakeven Inflation Rate has remained relatively steady at 2.3%-2.5%.
Is Rising Rates Bad for Gold?
Yes, rising real rates are typically unfavorable for gold—we expect rates to go up from now on—but:
(1) We still see demand from central banks as increasing; (2) ETF inflows in July and August 2026 were quite optimistic. August ETF holdings reached their highest levels of the year, even as the market had priced in higher policy rates.
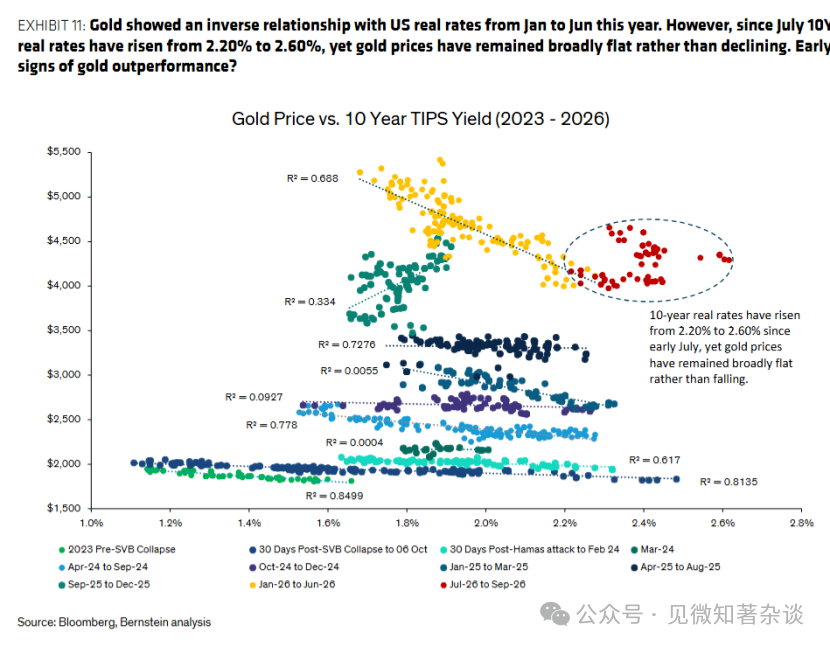
As shown in Chart 11, the relationship between gold and real rates is not linear.
In the short term (days, weeks), rising rates often lead to lower gold prices. However, in the medium term (months), even in the face of rising rates, gold may still see repricing or maintain its levels.
For instance, despite the 10-year real rate rising from 2.25% in early July to 2.65% in September, gold prices nonetheless increased slightly from $4,030 per ounce to nearly $4,300 per ounce. This is indicated by the red points in Chart 11.
Chart 11: Gold Price vs. 10-Year Inflation-Protected Bond Yields (2023-2026)
From January to June this year, gold prices were negatively correlated with U.S. real rates. However, since July, as the 10-year real rate rose from 2.20% to 2.60%, gold prices remained stable rather than dropping. Is this an early signal of gold's price performance exceeding expectations?
Central Bank Gold Purchases
We believe central bank gold purchases and gold ETF purchases explain this anomalous phenomenon.
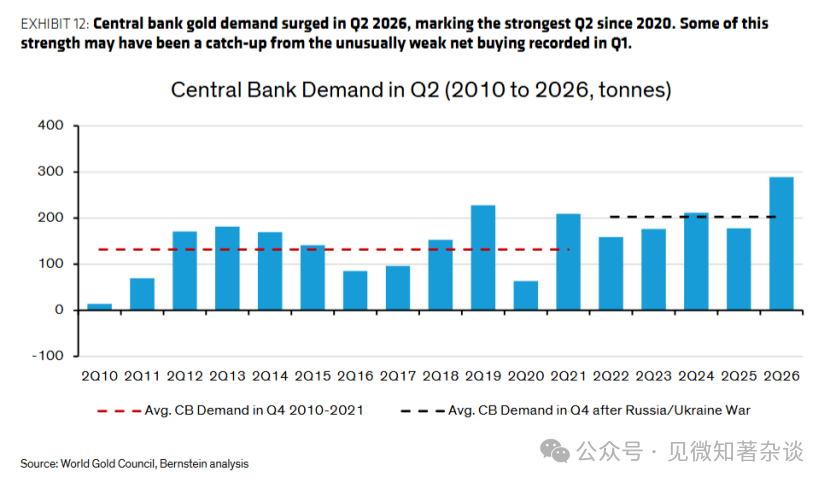
Reports indicate that central bank demand was strong in the second quarter of 2026 (Chart 12), possibly due to relatively low gold prices. The average price in the second quarter of 2026 was $4,500 per ounce, lower than the first quarter's $4,873 per ounce. Given the average in the third quarter so far is around $4,260 per ounce, we may again see strong central bank demand in the third quarter.
Chart 12: Central Bank Demand in the Second Quarter (2010-2026, Tons)
Central bank gold demand surged in the second quarter of 2026, marking the strongest second quarter since 2020. Part of the strong performance may be driven by a temporary catch-up from the unusually weak net purchases in the first quarter.
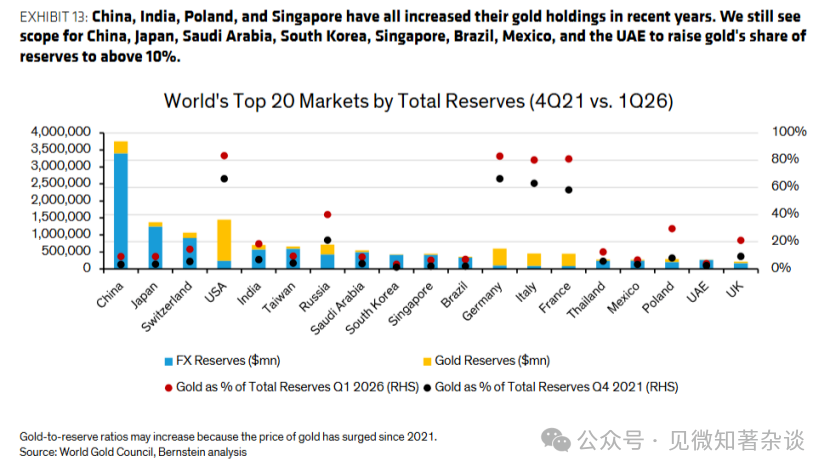
We continue to believe that central banks have not yet finished diversifying reserves from USD and other G7 currencies into gold. Several countries with significant foreign exchange reserves, including China, Japan, Saudi Arabia, South Korea, Singapore, Brazil, Mexico, and the UAE, have gold comprising less than 10% of total reserves (Chart 13, Q1 2026), indicating room for further accumulation in the future.
Moreover, the World Gold Council’s 2026 Central Bank Gold Reserve Survey (released mid-June) shows that central banks remain distinctly optimistic about gold, consistent with previous surveys. About 89% of central banks expect global gold reserves to increase over the next 12 months; while a record 45% of central banks this year indicated they would increase their own holdings – with most other central banks expecting to maintain their levels and nearly no one expecting reductions.
The reasons are well-known: gold performs well in crises, aids in portfolio diversification, and serves as a hedge against inflation. Furthermore, gold is increasingly viewed as a tool for combating geopolitical risks and a means of broader reserve diversification. Reserve preferences are also shifting notably. Roughly 74% of central banks expect their holdings of USD to decrease over the next five years, while gold's share is expected to rise. Other currencies like the euro and the yuan are expected to remain relatively stable.
Regarding funding sources, it's roughly evenly split—about half of central banks plan to buy gold using their domestic currency from domestic projects, while about 38% expect to finance purchases by selling other reserve assets.
Chart 13: Global Top 20 Reserve Markets (Q4 2021 vs. Q1 2026)
China, India, Poland, and Singapore have all increased their gold holdings in recent years. We continue to believe that China, Japan, Saudi Arabia, South Korea, Singapore, Brazil, Mexico, and the UAE have the capacity to increase their gold reserves to over 10%.
ETF Fund Flows
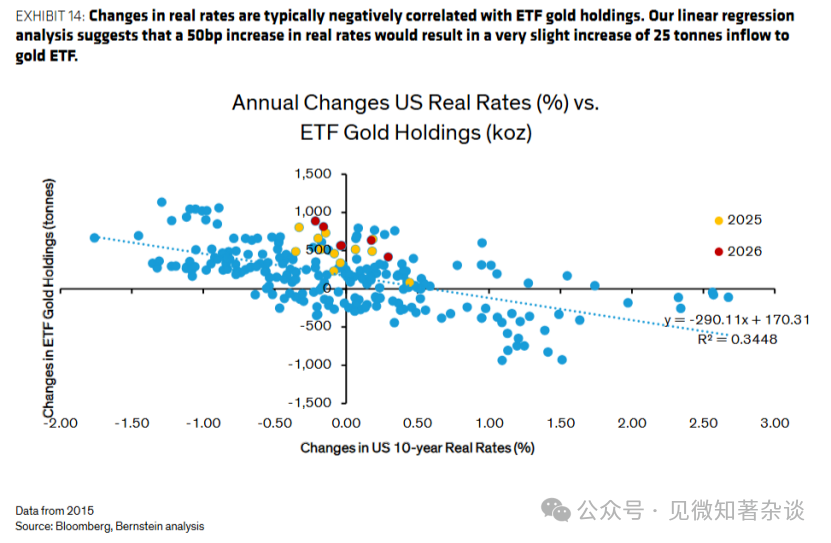
While ETF fund flows typically show a negative correlation with changes in real rates (Chart 14), this relationship still leans positively.
For instance, our analysis shows that unchanged real rates would still result in an inflow of about 170 tons into gold ETFs. Using the same regression framework, an increase of 50 basis points in U.S. 10-year real rates over the next 12 months would still imply a moderate inflow of about 25 tons, or roughly 6 tons per quarter.
As discussed later, our price forecast is more conservative, assuming an outflow of about 50 tons from gold ETFs each quarter, roughly equivalent to the outflow seen in the second quarter of 2026. Therefore, if, as indicated by the following regression analysis, gold ETFs actually show moderate inflows, there is an upside risk to our estimates.
Chart 14: Annual Change in U.S. Real Rates (%) vs. Change in ETF Gold Holdings (thousand ounces)
Changes in real rates typically have a negative correlation with gold ETF holdings. Our linear regression analysis shows that a 50 basis point rise in real rates would only induce a moderate inflow of about 25 tons into gold ETFs.
The World Gold Council's ETF fund flow data for July and August show net inflows into gold ETFs. In fact, despite rising real rates and an increasing market expectation for further Fed rate hikes, gold ETF holdings in August reached their highest levels of the year (Chart 15). This resilience in ETF demand may help explain gold's strength in August, and its ability to continue rising even after the Fed's September rate hikes.
Chart 15: ETF Gold Holdings vs. Market Implied U.S. Overnight Rates (December 2026)
This year, gold ETF holdings have remained relatively stable, even as the market has priced in higher policy rates. Could this become an early green signal for rising gold prices?
Revisiting Our Gold Price Forecasts
Unlike industrial commodities, gold prices are not determined by traditional annual supply-demand relationships. Rather, gold behaves more like a currency, driven mainly by real rates and central bank purchases (especially since Russian assets were frozen in 2022).
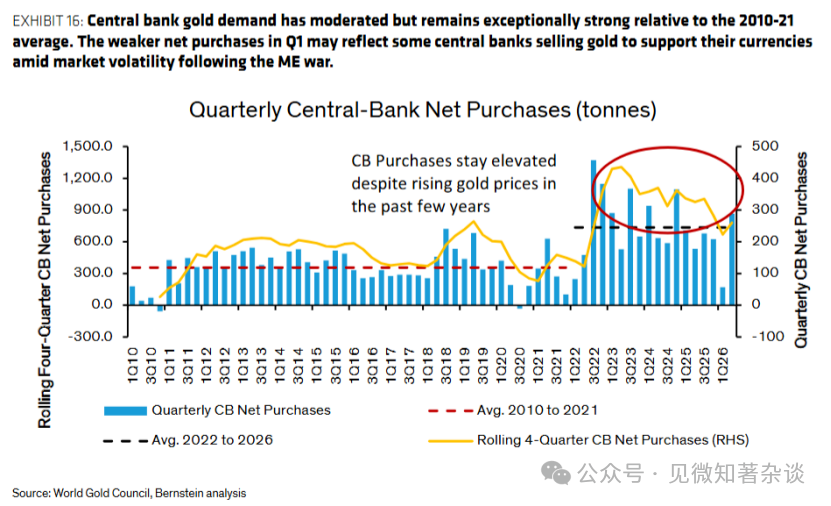
Mechanistically, rising real rates drive ETF outflows (Chart 14), in turn pulling down gold prices (Chart 16). The exceptions observed from 2022 to mid-2024 are attributable to strong central bank buying.
Chart 16: Quarterly Net Purchase Volumes by Central Banks (tons)
Central bank gold demand has eased, but remains exceptionally strong relative to the averages of 2010-2021. Weaker net purchases in the first quarter may reflect some central banks selling gold to support their currencies amid market volatility triggered by the Middle East war.
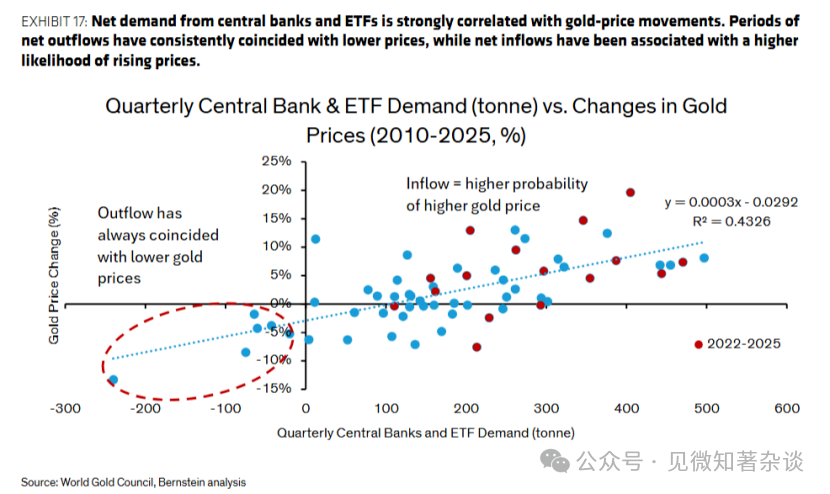
Comparing quarterly net demand from central banks and ETFs since 2010 with gold price changes reveals a strong positive linear correlation (Chart 17).
Chart 17: Central Bank and ETF Quarterly Demand (tons) vs. Gold Price Changes (2010-2025, %)
The net demand from central banks and ETFs is highly correlated with changes in gold prices. Prolonged net outflow periods corresponded with lower prices, while net inflow periods were more likely associated with price increases.
As gold ETF holdings (as of August) have remained stable, even while the market has priced in higher policy rates, we have reason to expect ETF holdings to remain stable throughout the year.
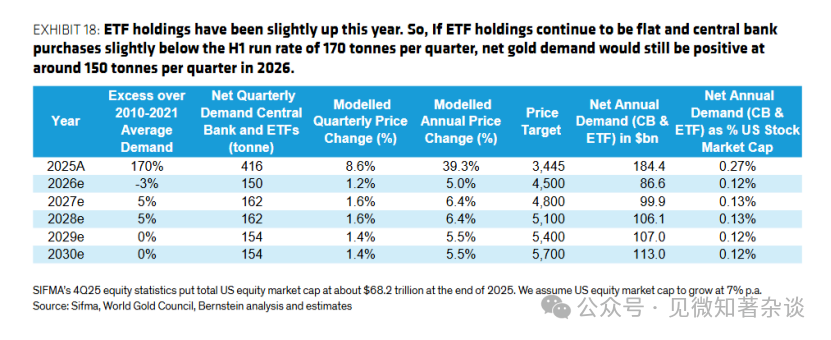
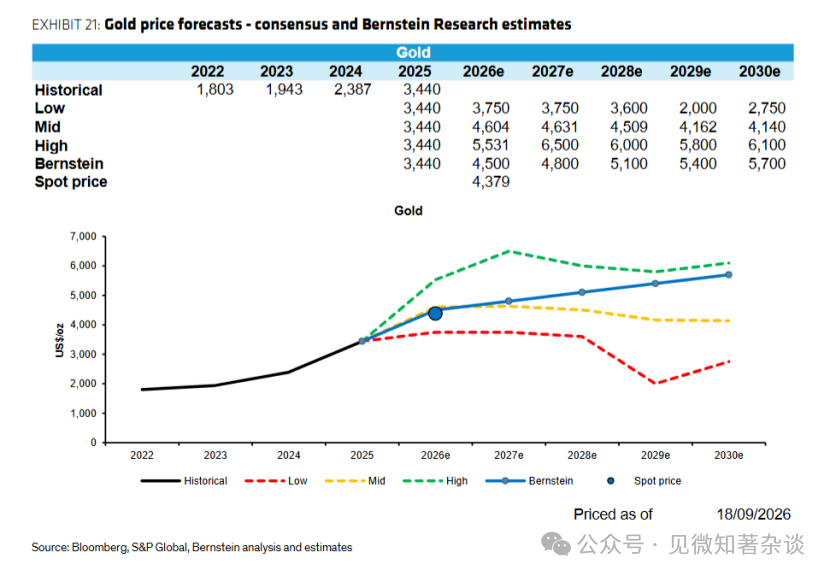
Assuming central banks' quarterly purchasing volumes are slightly lower than the average levels of 170 tons from Q1 and Q2 2026, the average quarterly demand for 2026 would be 150 tons. Integrating this quarterly demand into our linear regression model implies an average nominal price for gold in 2026 of about $4,500 per ounce (Chart 18).
We then assume that quarterly net demand gradually normalizes in 2027 and 2028, stabilizing before 2030. Applying the historical relationship between net demand and gold price changes yields a forecast for gold prices in 2030 of $5,700 per ounce.
Finally, the implied annual demand amount is about $100 billion. Although this is not insignificant, it remains small relative to the scale of global financial markets (for example, compared to the market capitalization of U.S. equities).
Chart 18: This year, ETF holdings have seen slight increases. Thus, if ETF holdings remain stable and central bank purchase volumes are slightly lower than the quarterly pace of 170 tons in the first half of the year, net gold demand for 2026 will still be positive, around 150 tons per quarter.
In the long term, the sustained widening of the U.S. fiscal deficit – partly driven by rising net interest costs (Chart 19) – suggests that the pressure for de-dollarization is unlikely to dissipate quickly. This structural theme should continue to provide a supportive backdrop for gold demand.
Chart 19: Total Deficit, Underlying Deficit, and Net Interest Expenditures as a Percentage of GDP
The U.S. total deficit could reach 7.3% of GDP by 2055, with net interest expenditures nearly doubling (as a share of GDP). By 2055, net interest will account for 74% of the total U.S. deficit.
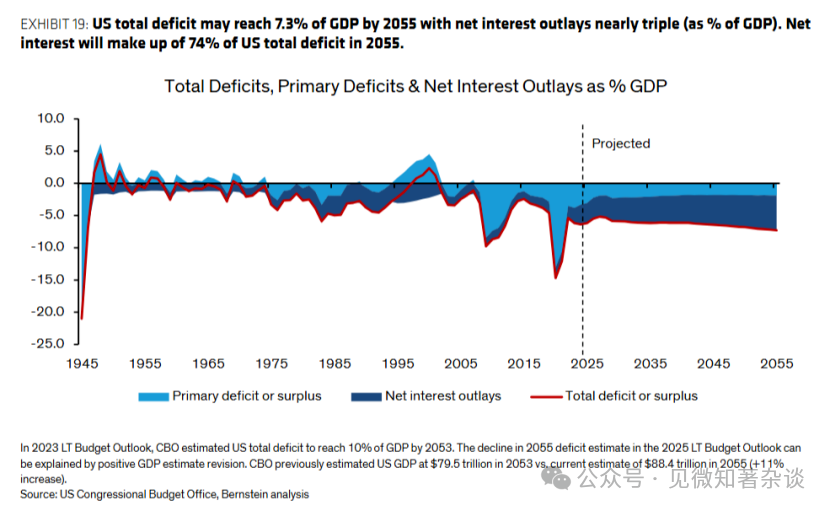
Note: In the 2023 long-term budget outlook, the Congressional Budget Office (CBO) estimates that the U.S. total deficit will reach 10% of GDP by 2053. The decrease in projected 2055 deficit figures in the long-term budget outlook for 2025 can be explained by a positive adjustment to GDP estimates. The CBO previously estimated U.S. GDP for 2053 at $79.5 trillion, while the current estimate for 2055 is $88.4 trillion (a growth of 11%).
In Chart 18, we estimate that gold prices will rise from $4,500 per ounce in 2026 to $5,700 per ounce in 2030, implying a compound annual growth rate of 6.1% during this period. This aligns closely with gold's (very) long-term nominal annual compound growth rate of 5.2% since 1920 (Chart 20).
Chart 20: Long-Term Gold Prices - Nominal vs. Real (USD 2025)
The long-term nominal annual compound growth rate for gold from 1920 to 2025 is 5.2%. From 1946 to 2025, the actual annual compound growth rate for gold (measured in 2025 dollars) is 2.7%.
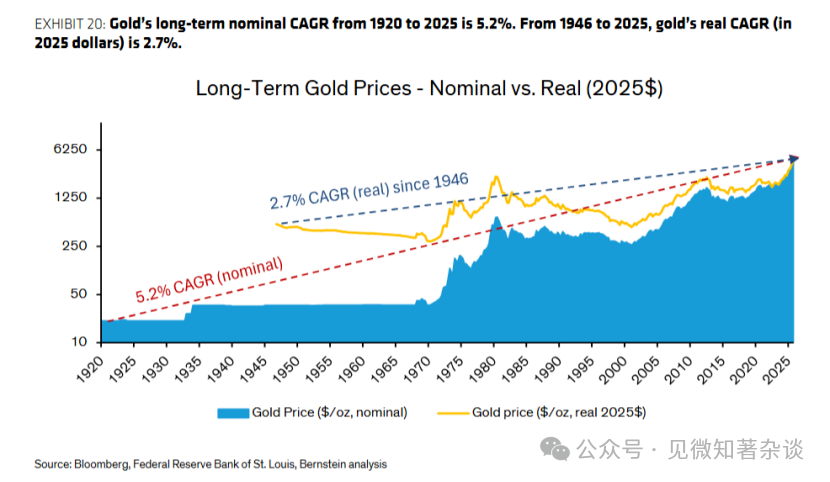
Chart 21: Gold Price Forecast - Market Consensus vs. Bernstein Research Forecast
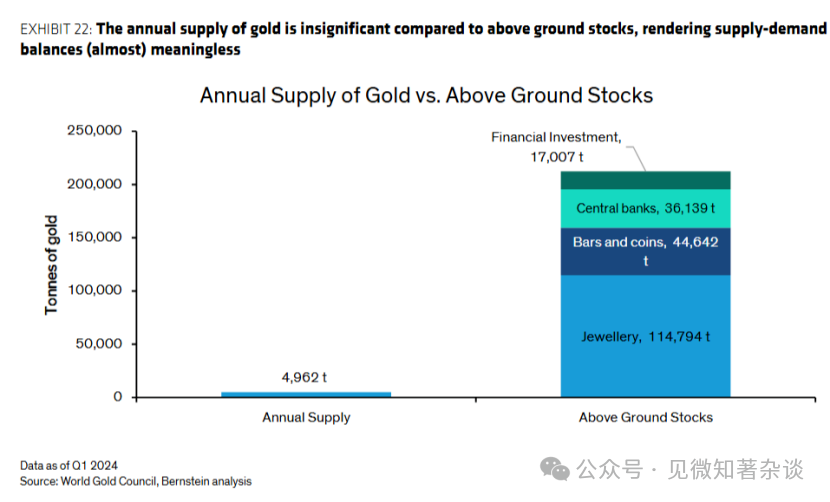
Supply vs. Above-Ground Stocks
Lastly, a reminder: most metals are traded like commodities, but gold is traded like a currency. Gold has a high degree of chemical inertness and has been used as currency and a store of value for thousands of years.
Gold is widely accepted as a store of value due to its limited supply, much like rare whiskies and aged wines. Almost all the gold that has ever been mined still exists somewhere on the earth's surface (we have only launched a tiny bit into space).
Consequently, compared to the above-ground stocks (Chart 22), annual mine supply is almost negligible, with most demand used for financial purposes, such as central bank reserves.
Chart 22: Annual Gold Supply vs. Above-Ground Stocks
The annual gold supply is trivial compared to above-ground stocks, rendering supply-demand balance analysis (almost) meaningless.
免责声明:本文章仅代表作者个人观点,不代表本平台的立场和观点。本文章仅供信息分享,不构成对任何人的任何投资建议。用户与作者之间的任何争议,与本平台无关。如网页中刊载的文章或图片涉及侵权,请提供相关的权利证明和身份证明发送邮件到support@aicoin.com,本平台相关工作人员将会进行核查。


