Cryptocurrency Expert: The rise to 2800 on September 24 indicates a hidden divergence for Ethereum (ETH), what is the underlying technical logic of this round of adjustment? Latest market analysis reference
The current price of Ethereum is 2670, the market has played a roller coaster, many crypto friends were bullish at high levels, resulting in profit retraction or even getting trapped. After the rise to 2800, bulls lost strength, and selling pressure surged, leading to a rapid price decline. The market will not always rise; it does not follow people's thoughts. After too much increase, there will be a pullback, and after too much decrease, there will be a rebound. Trading is not about betting on rising or falling but waiting for opportunities with appropriate risk-reward ratios. This pullback is a good opportunity.
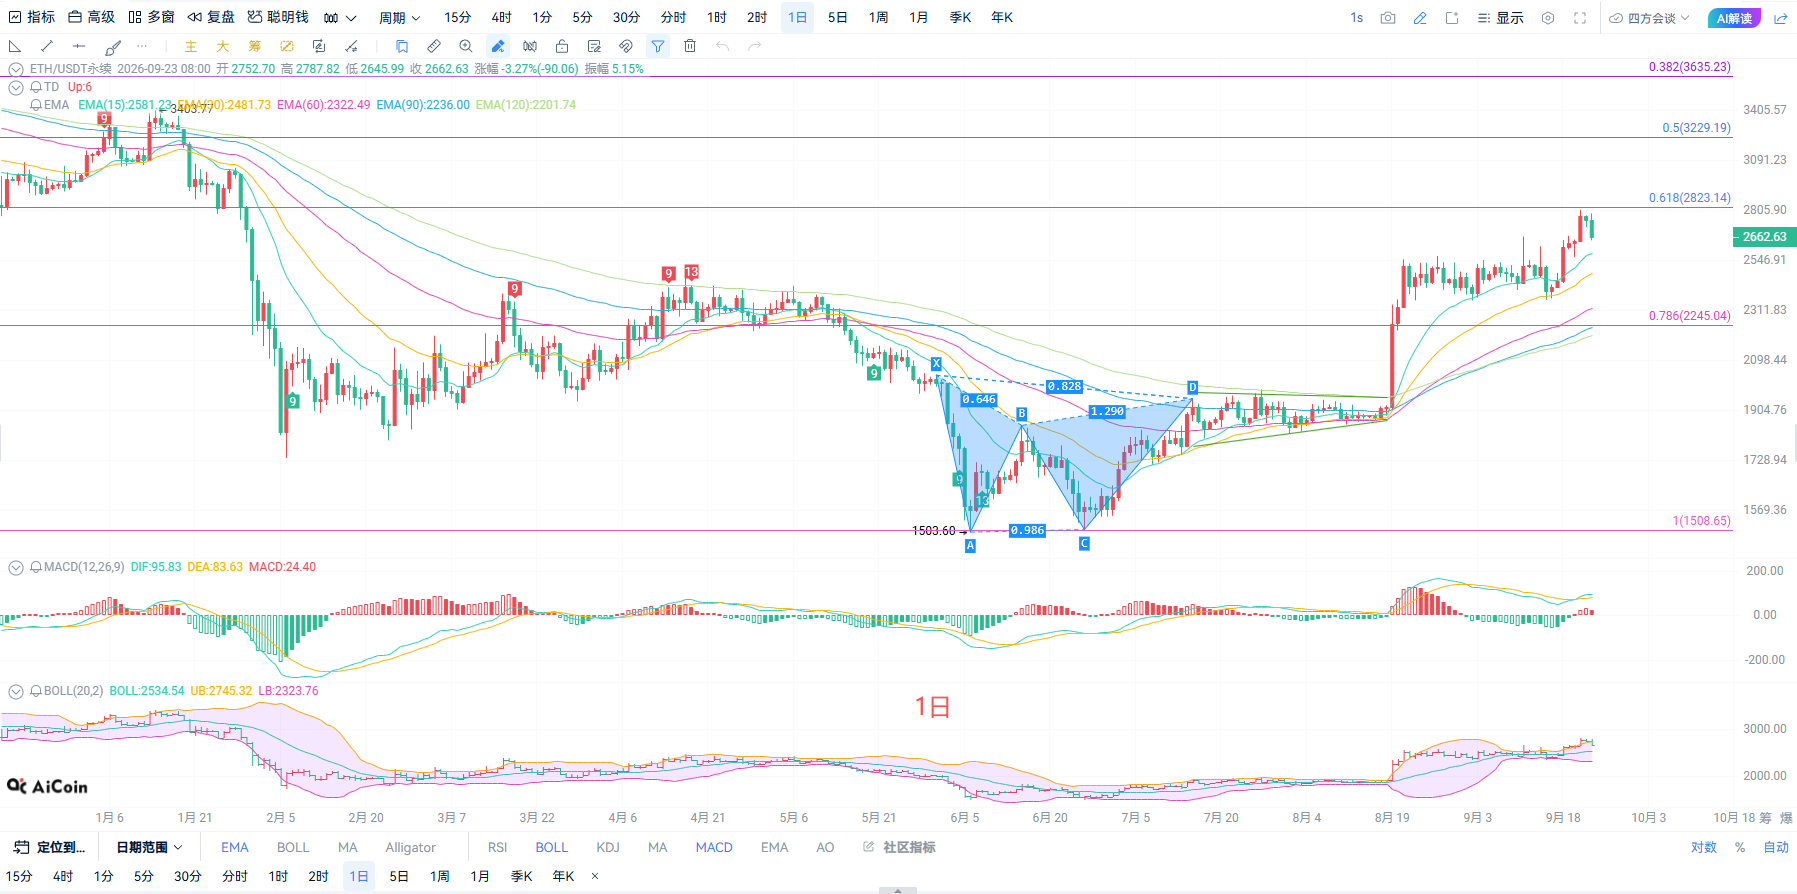
The daily candlestick chart has retraced to the short-term EMA15 moving average. The MACD indicator's red bars are continuously shortening, the bullish momentum is weakening, and the indicator shows signs of turning downwards. The Bollinger Bands price has deviated from the upper band and is starting to test the middle band support downwards. From the wave structure perspective, this pullback after the recent rise is a normal correction, and the larger cycle's upward structure has not been completely damaged. The strong resistance above is at 2823, which has been under pressure multiple times. Next, we should focus on observing the EMA30 moving average support. If the support holds, there is still a chance for a second rise; if it breaks down, the adjustment cycle will elongate.
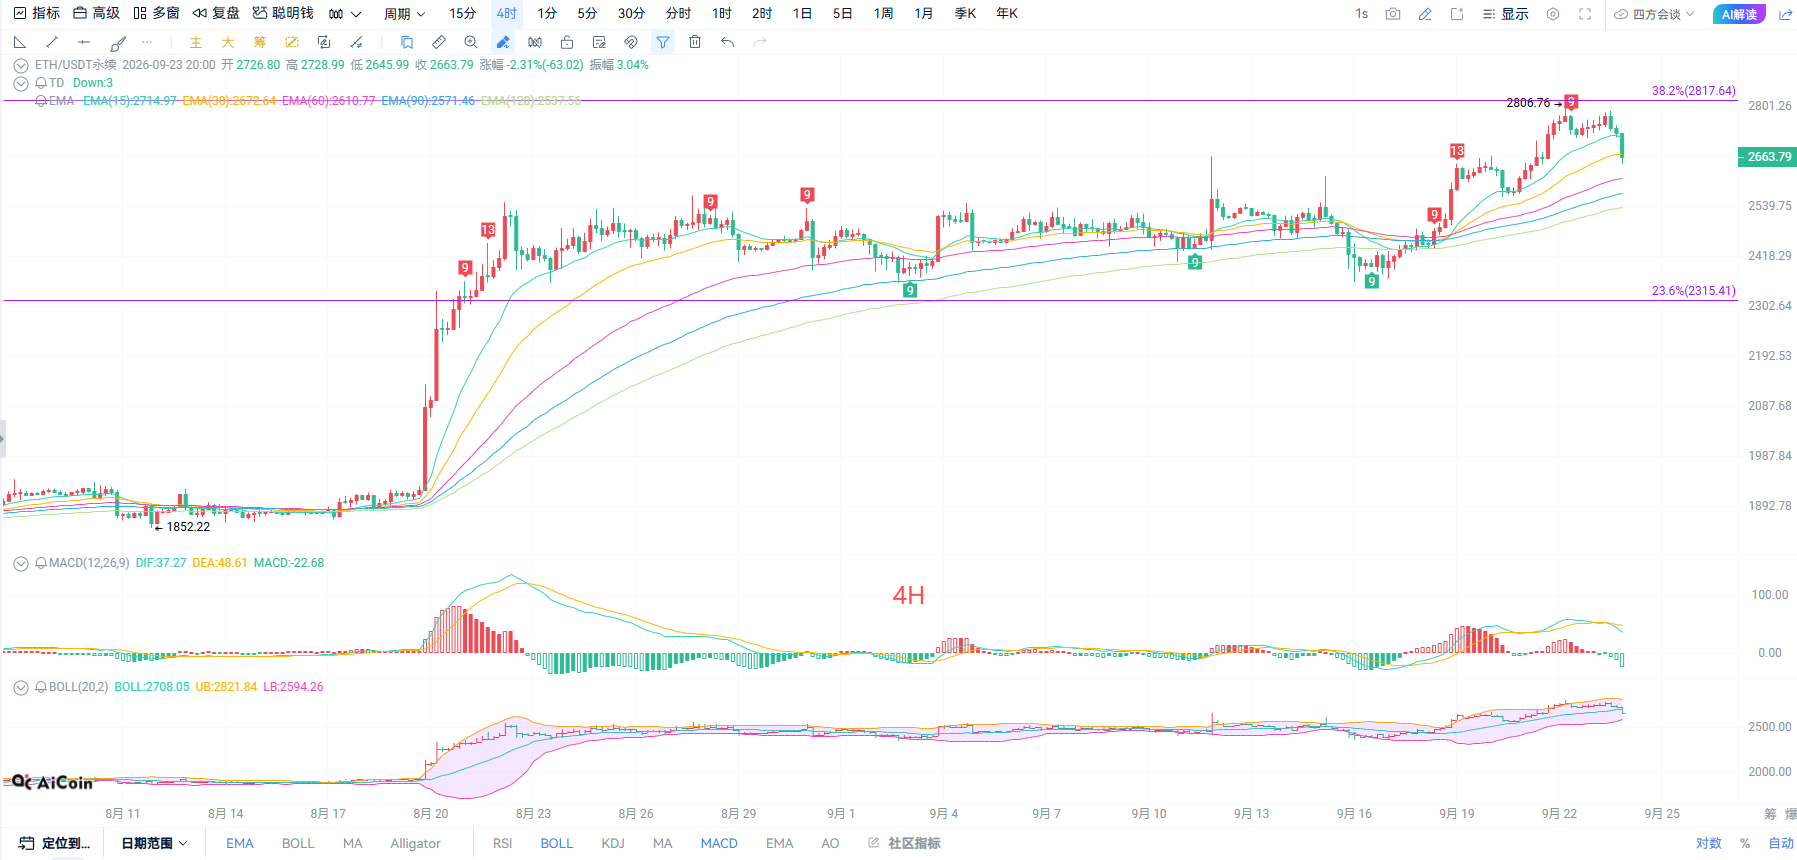
The four-hour candlestick chart shows a large bearish candlestick that directly fell below the short-term moving average cluster, indicating a weakening short-term trend. The MACD has formed a bearish cross and is heading downward, with green bars continuously expanding, indicating that bearish momentum is being released. The Bollinger Bands are opening downward, and the price is running below the middle band, with the moving average system shifting from support to pressure. The high point of 2817, which is at the 38.2% Fibonacci level, has become the short-term top, and future rebounds will face moving average pressure. Currently, the 4-hour chart is in an adjustment phase. To return to a bullish trend, the price needs to stabilize above the EMA30. Until stability is achieved, any rebounds should be treated primarily as pullbacks, and one should not easily go for bottom fishing.
Short-term reference:
If the price breaks above 2650 to 2610, set a stop loss of 40 points, with a target looking at 2720 to 2760.
If it fails to break 2730 to 2760, set a stop loss of 40 points, with a target looking at 2700 to 2660.
Specific operations should be based on real-time data from the market. For more details, please consult the author. There may be delays in article publication, and it is recommended for reference only; risks are borne by the reader.

Friendly reminder: The above content is solely created by the author. The advertisements at the end of the article and in the comment section are not related to the author. Please discern carefully. Thank you for reading.
免责声明:本文章仅代表作者个人观点,不代表本平台的立场和观点。本文章仅供信息分享,不构成对任何人的任何投资建议。用户与作者之间的任何争议,与本平台无关。如网页中刊载的文章或图片涉及侵权,请提供相关的权利证明和身份证明发送邮件到support@aicoin.com,本平台相关工作人员将会进行核查。