Author: Frederik Theissen
Translation: Shenchao TechFlow
Overview: Glassnode's Week 38 on-chain report states that in this bear market, Bitcoin has never closed below its realized price on a daily basis. The price has regained a position above the real market mean and the cost basis for long-term holders; selling pressure remains light, ETFs are seeing net inflows again, altcoins are rising generally but leverage is minimal. The next hard test lies around $95,000 to $97,000 - where the options market makers’ hedge and the average MVRV price converge.
Core Summary
Bitcoin has never closed below the realized price in this bear market. The percentage of profitable coins once fell to levels comparable to November 2022, but the net unrealized profit/loss (NUPL) has always remained positive.
The price is just sitting above the long-held supply of long-term holders in the $84,000 to $85,000 range. The next significant on-chain resistance is the average MVRV price around $96,700.
The options positions saw a sharp increase within a day: market makers’ hedging could accelerate volatility between the current price and $92,000, slowing down the pace as it approaches $95,000.
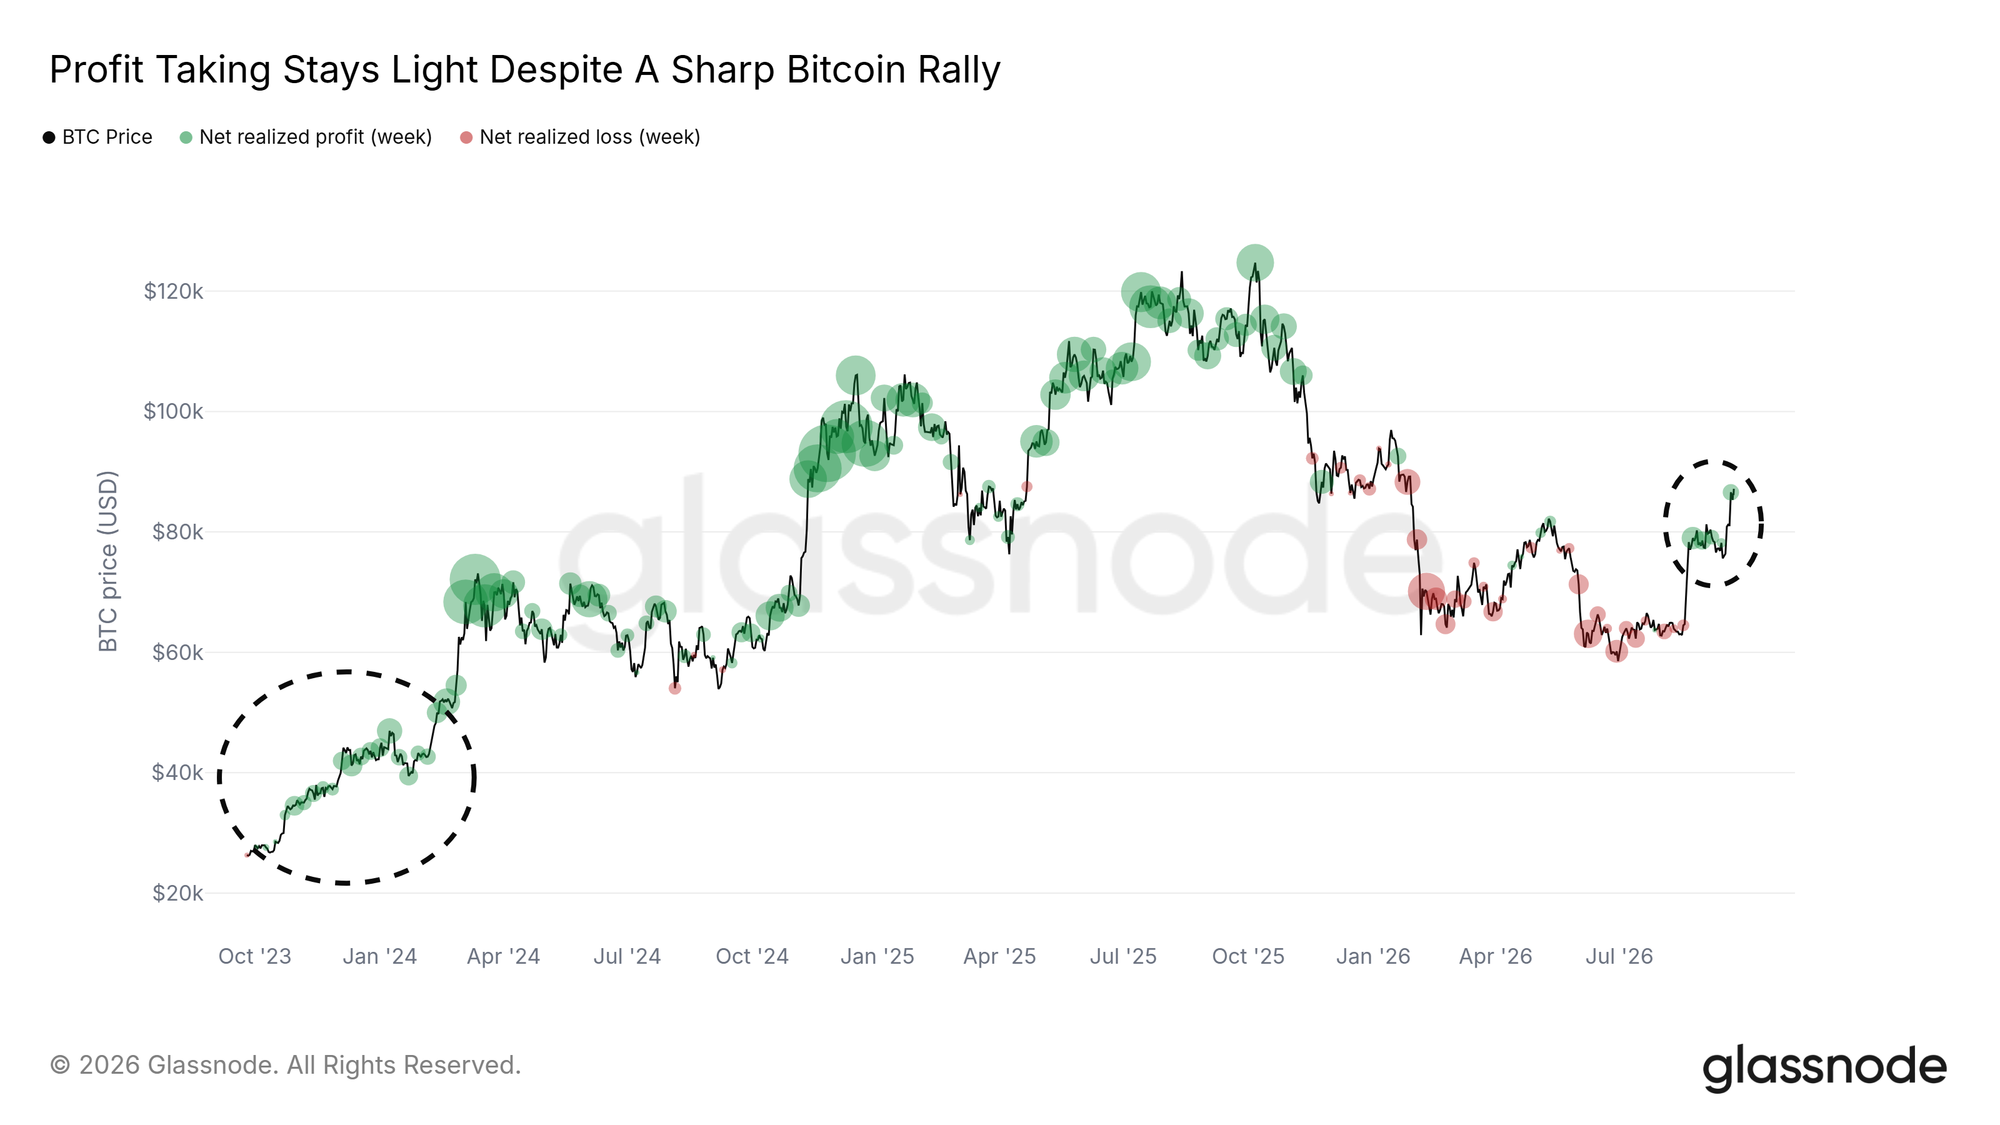
The scale of profit-taking is still just a small part of the peak expected in 2024 to 2025, although nearly all short-term holders have recouped their investments.
ETF buying has warmed up, with spot trading volume more than doubling from August lows, and this time the price is rising alongside increased volume across multiple exchanges.
Altcoins are experiencing a broad rise, but traders have hardly added new leverage.
Shallower Lows
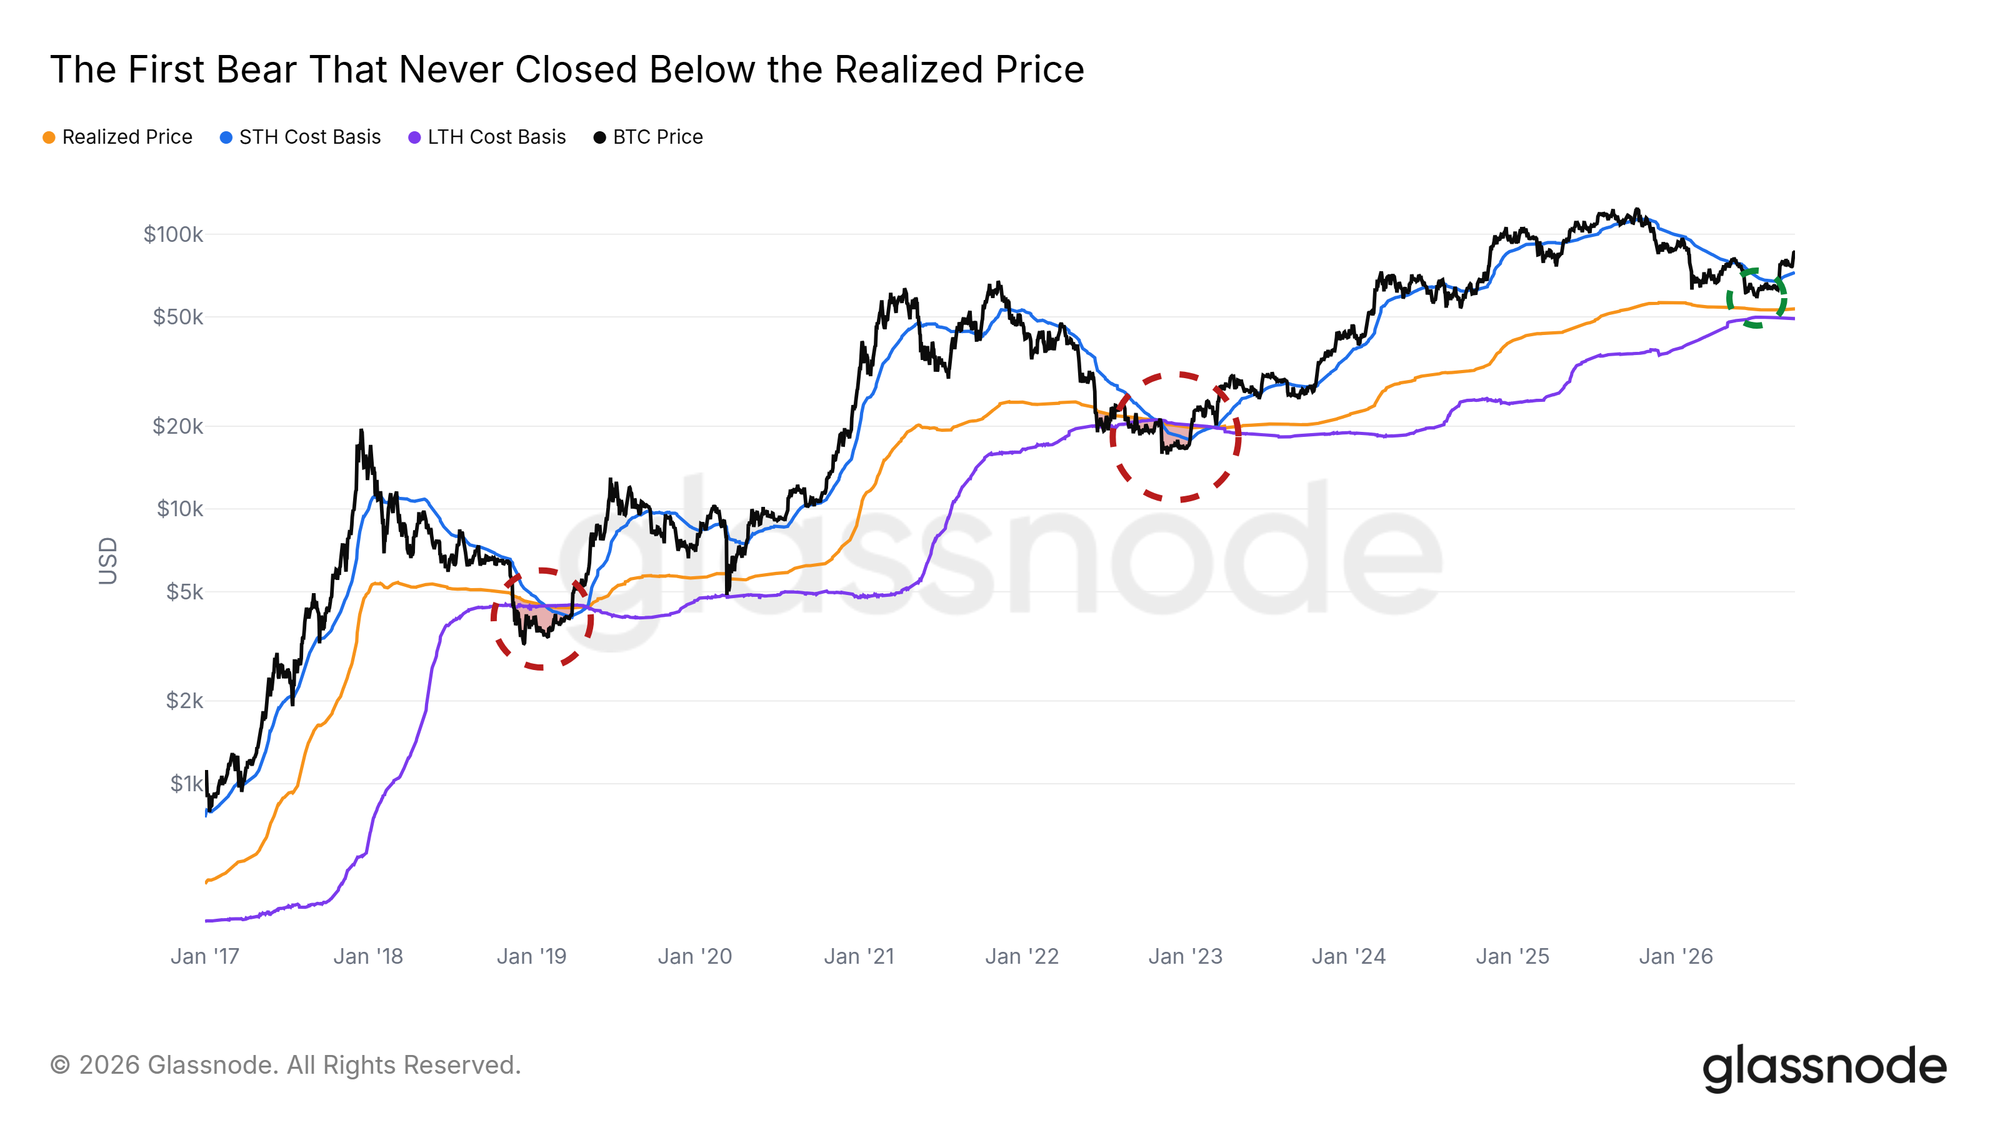
Never Dropped Below Realized Price
Last week’s report mentioned that the price dropped below the true market mean. Within a few days, the price returned above that line. Bitcoin is currently trading above the true market mean of approximately $77,000 and the cost basis of short-term holders.
The realized price represents the average buying cost of all circulating coins. During the bear markets of 2018 to 2019 and 2022 to 2023, prices ran below this line for several months. This time, the price has never closed a daily candle below the realized price; the June low has consistently held above it - something that has not happened in previous bear markets since 2017.
If the price continues to hold above the true market mean, the June low will become the shallowest among the three bear market lows.
Wide Losses, But Shallow Depth
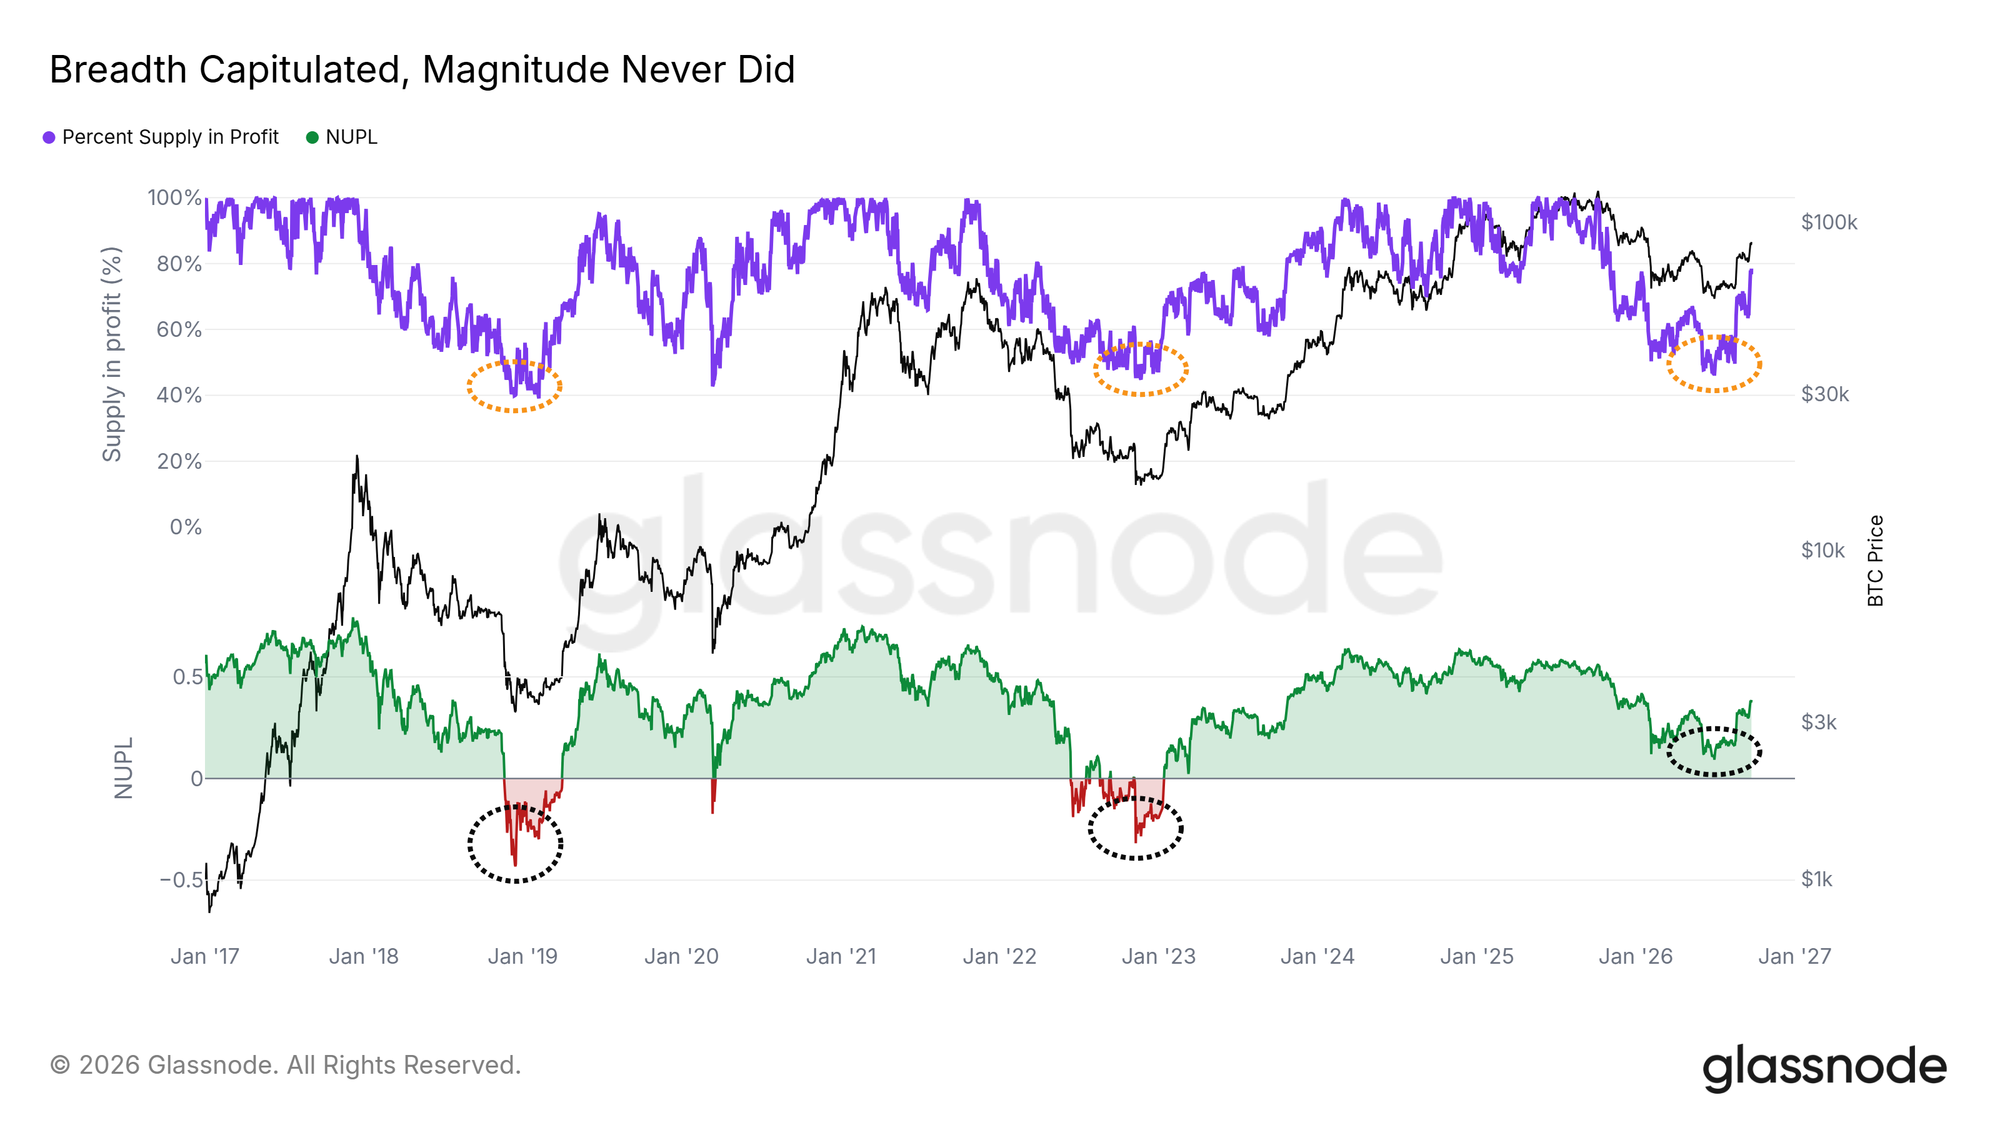
At the June low, the percentage of profitable supply dipped to a level roughly equivalent to the November 2022 low. The number of coins in unrealized loss at that time was comparable to the last bear market.
However, the losses themselves are much shallower. The net unrealized profit/loss (NUPL), which measures the total unrealized profit and loss across the network, has never turned negative during this cycle; in 2018 and 2022, it fell deeply into negative territory. Shallower losses typically mean less pressure to sell.
Next Key Levels
Support Below, Resistance Above
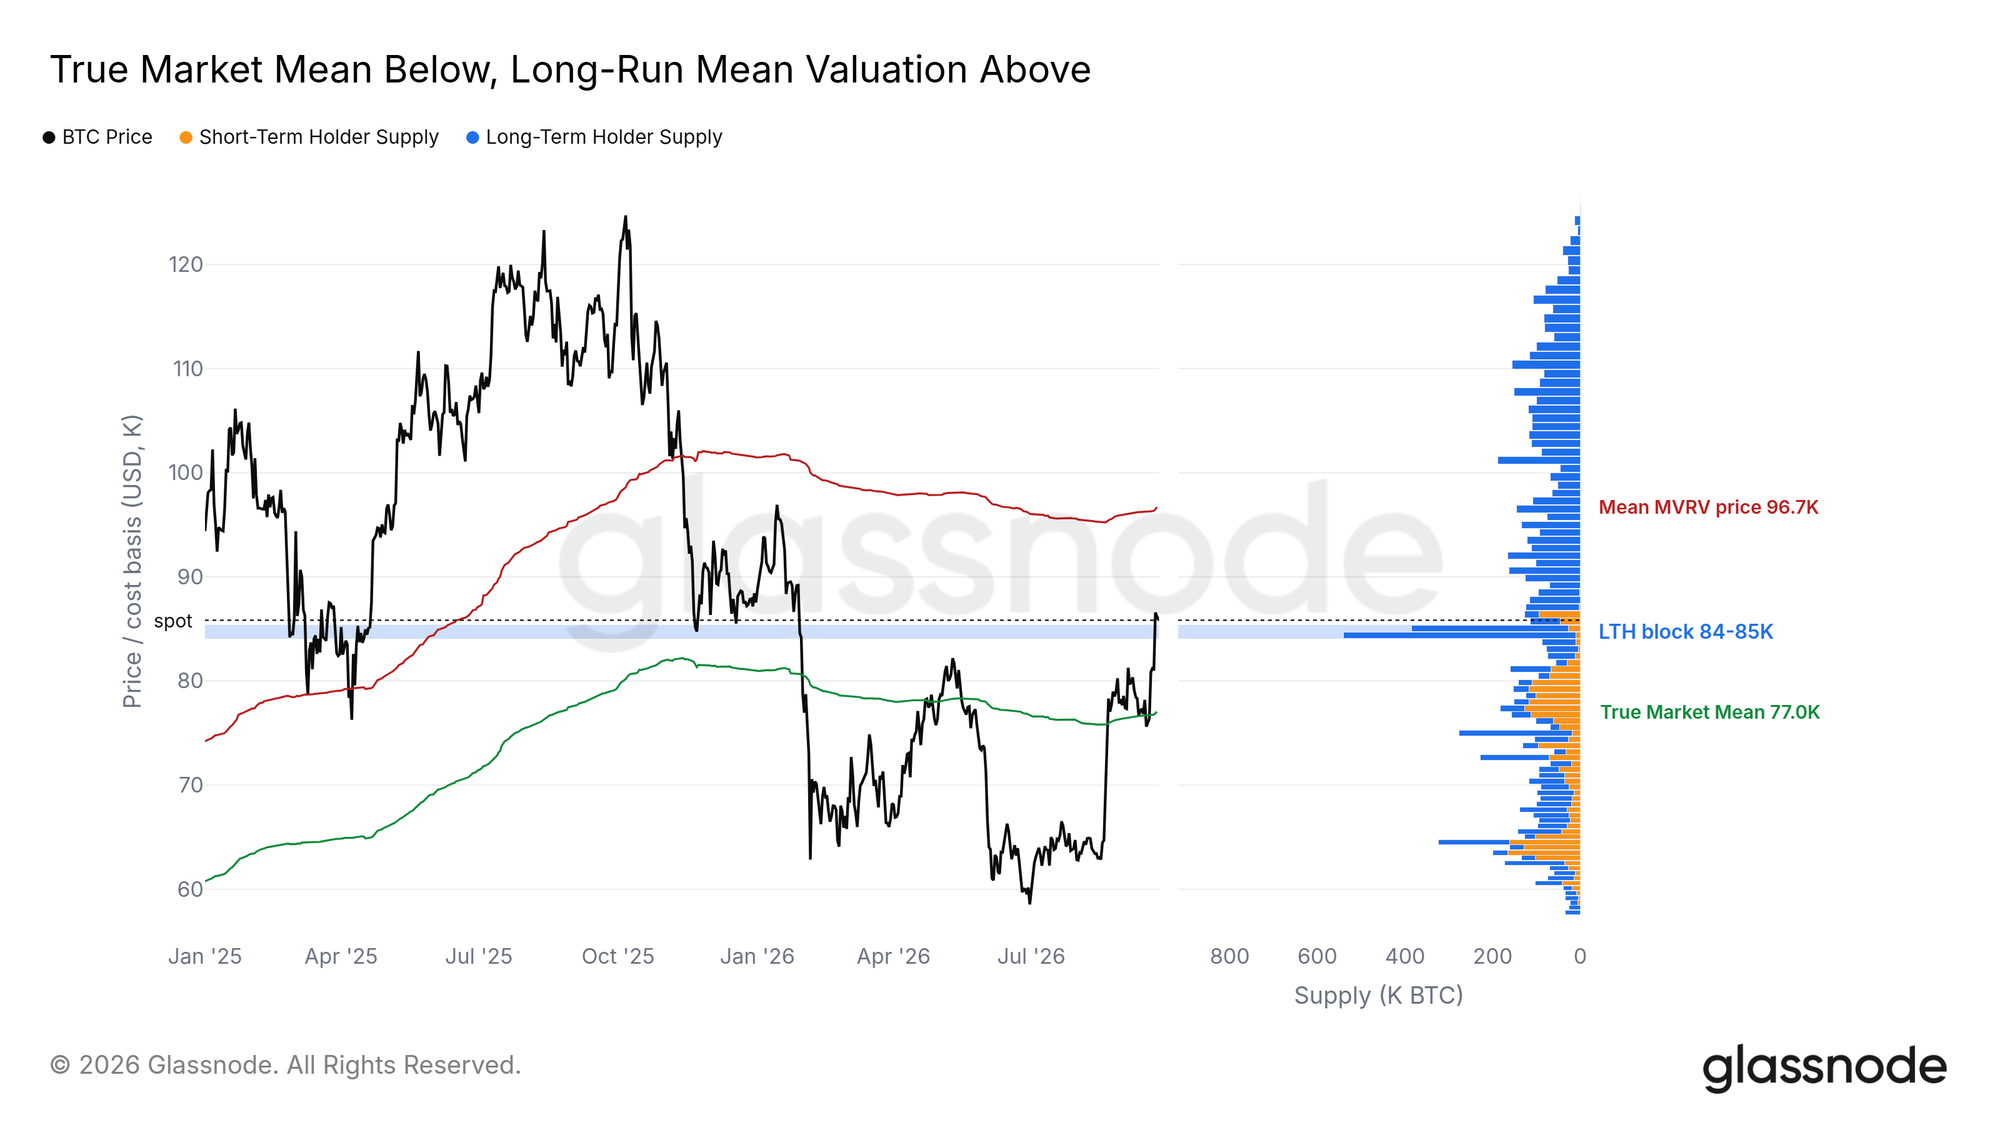
The debate in August centered around whether this rebound was merely a short-covering move. Now that the price has surpassed the cost basis that has repeatedly held it back this year, the question becomes how far it can go. Last week’s report marked a long-standing supply of long-term holders as a ceiling and noted that there is a large stack of call options above it; the price is now sitting above both.
The largest supply of long-term holders falls in the range of $84,000 to $85,000, just below the current price. The next major resistance is around the average MVRV price of roughly $96,700 - this corresponds to the point where the realized price multiplied by the long-term average MVRV of Bitcoin aligns with "average holders returning to long-term norms." Buyers who entered close to the top of the range one to two years ago are also approximately breakeven around this level.
On the downside, the true market mean of about $77,000 serves as the main support. If the price holds above $84,000, the path toward $96,700 remains open; however, if it drops back below $84,000, $77,000 will come back into view.
Options Positions Piling Up at the Top
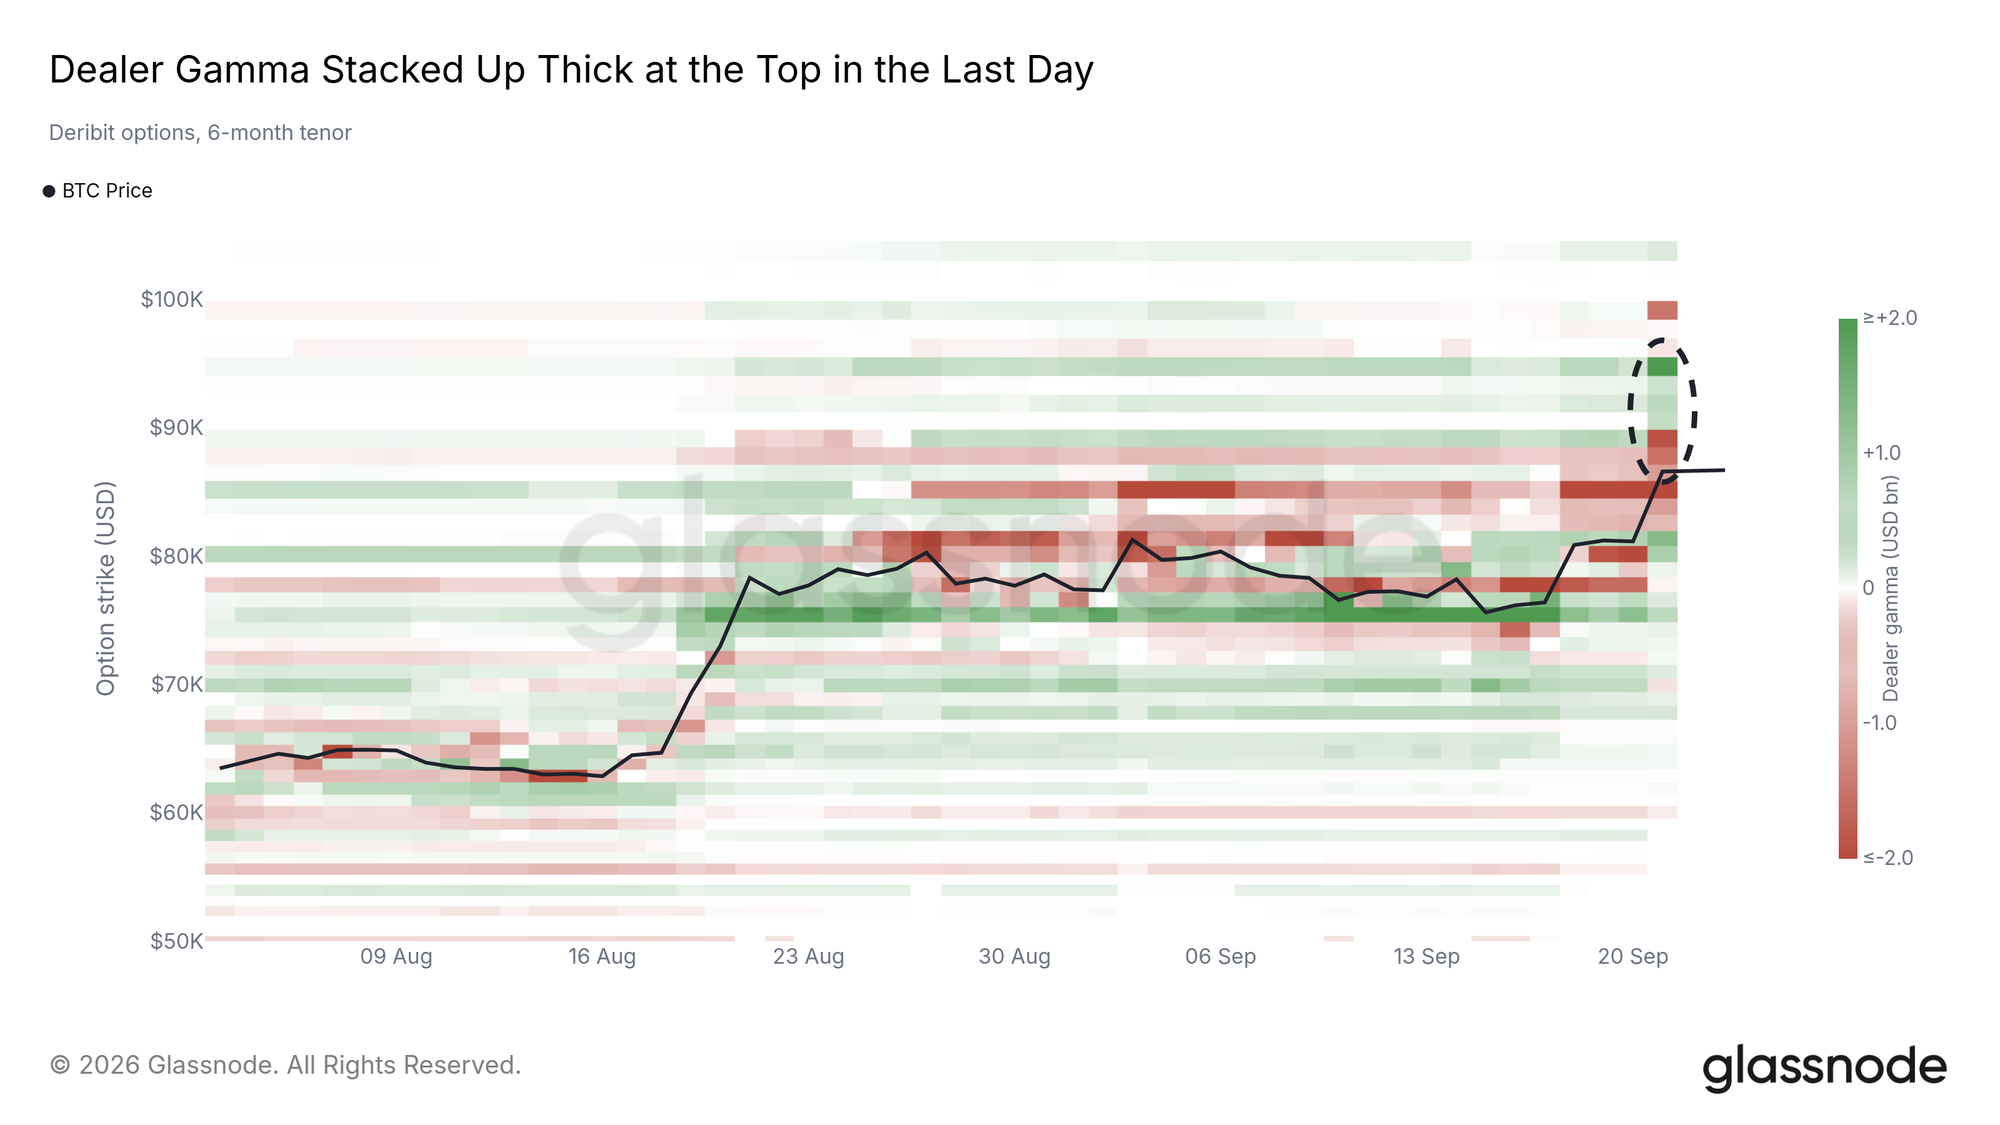
Options data points to the same region. Within just one day, the positions on Deribit have rapidly built up near the upper end of the range: positive gamma around the $95,000 strike price jumped to the highest reading on the chart, while negative gamma has built up between the current price and $92,000.
Gamma describes how market makers hedge options. In the range between the current price and $92,000, their hedging implies buying when the price rises and selling when it falls, potentially accelerating volatility; as it approaches $95,000, the effect reverses, and the hedging tends to slow down the price movement. This level falls just below the average MVRV price of approximately $96,700, so if the rebound continues, $95,000 to $97,000 will be the first serious test.
Selling Pressure Remains Light
Profit Taking Still Relatively Small
Rapid surges are usually accompanied by intense profit-taking. So far, that has not occurred. During this rising phase, the weekly net realized profit/loss remains just a small portion of what is expected at the top in 2024 and 2025.
The current pace resembles the beginning of the previous upward trend: from late 2023 to early 2024, profit-taking proceeded at a roughly similar pace, far earlier than the later larger sell-offs. If profit-taking continues at this level, there is still room for a rebound; however, if the weekly scale aligns closely with the peaks of 2024 and 2025, it would indicate that holders are starting to sell aggressively.
Recent Buyers Have Returned to Profit
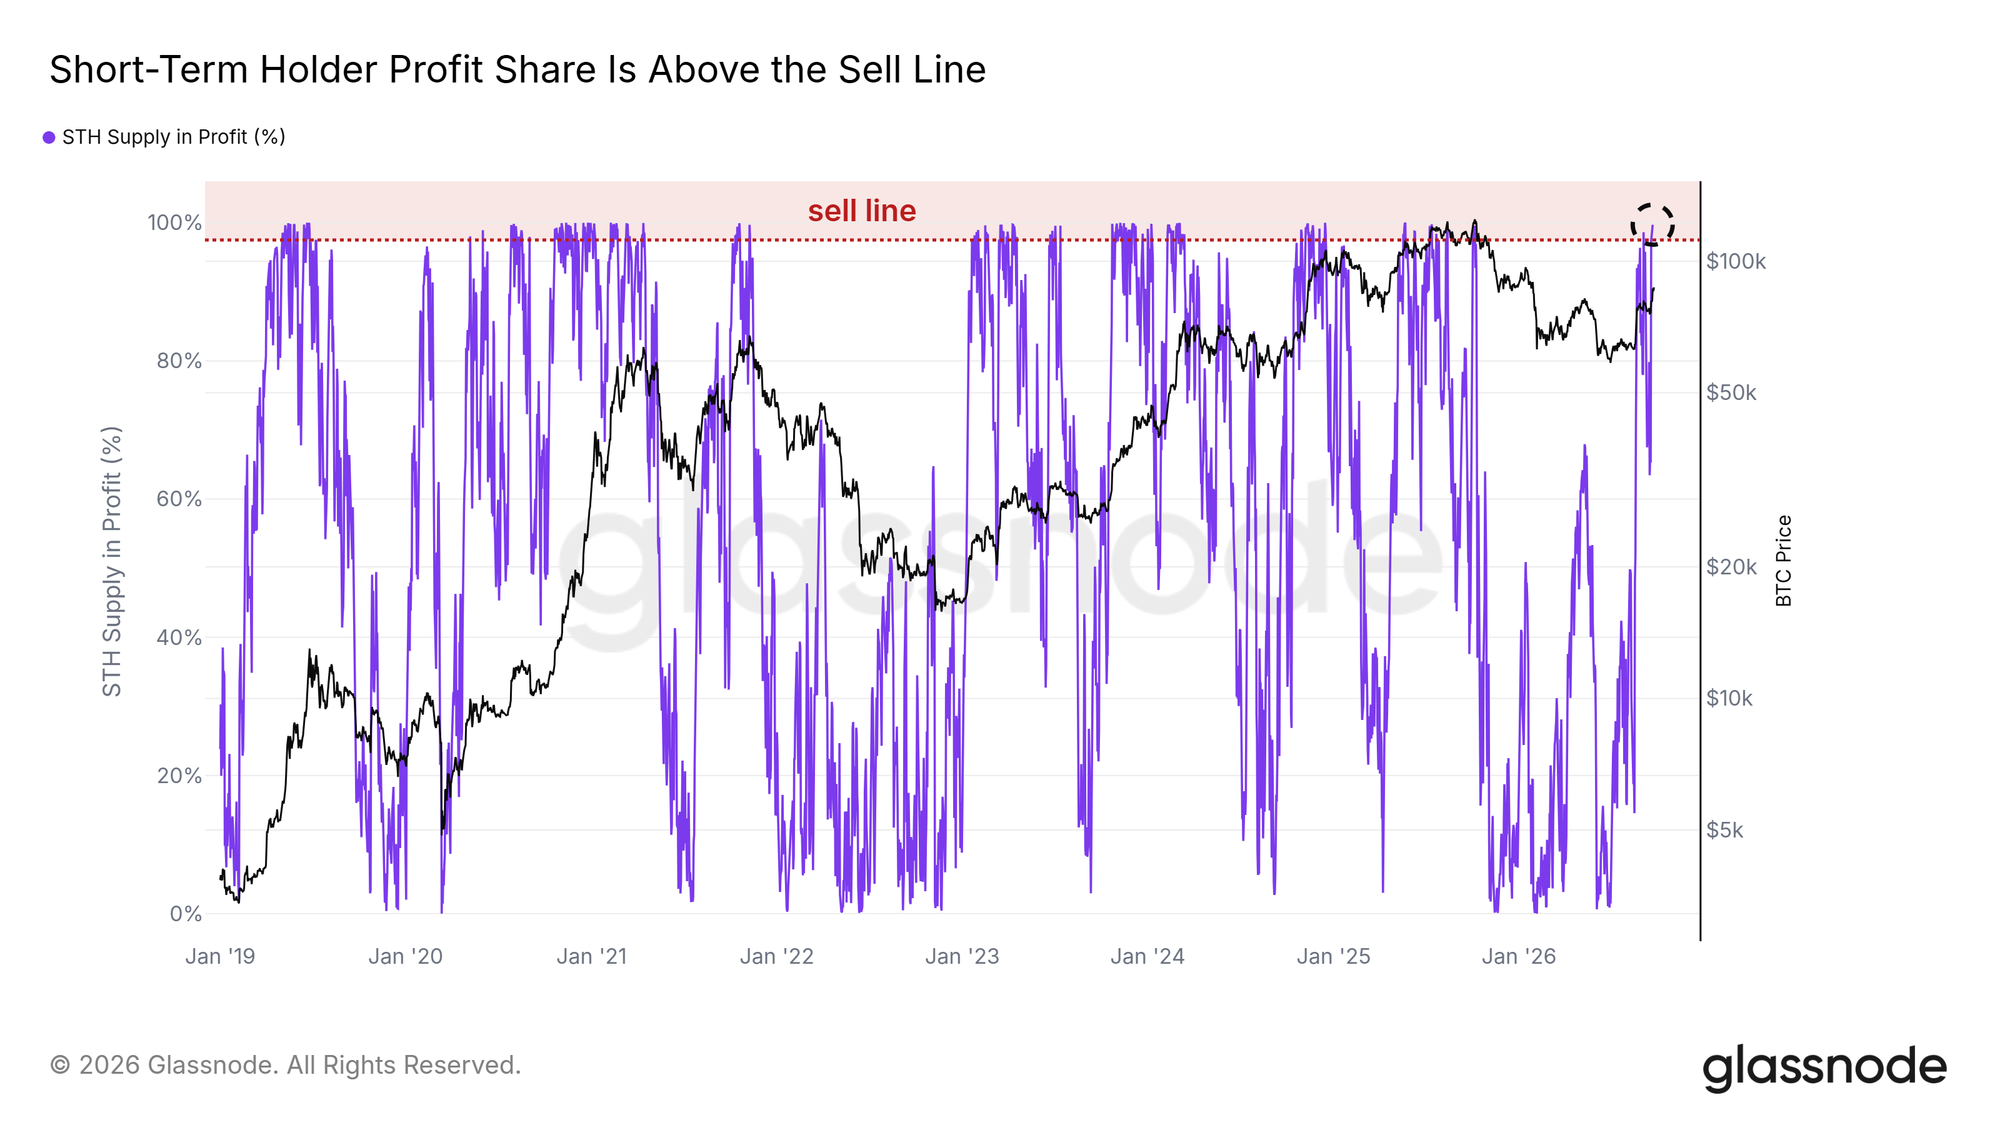
Short-term holders are the most likely to sell during the rebound, and they have nearly all recouped their investments. Their percentage of profitable supply has surpassed the "sell line" - historically, their sell-off often heats up near this line. This line was crossed in early recoveries in 2019 and 2023, and also appeared near tops in 2021 and 2025; examining it alone does not determine the next price direction.
The realized profits across the market remain low, thus "having the incentive to sell" has not turned into "actually selling heavily." If it drops back below the sell line while realized profits rise, that would be the first signal of recent buyers starting to take profits.
ETF Re-Entering the Market
Inflow Warming Up
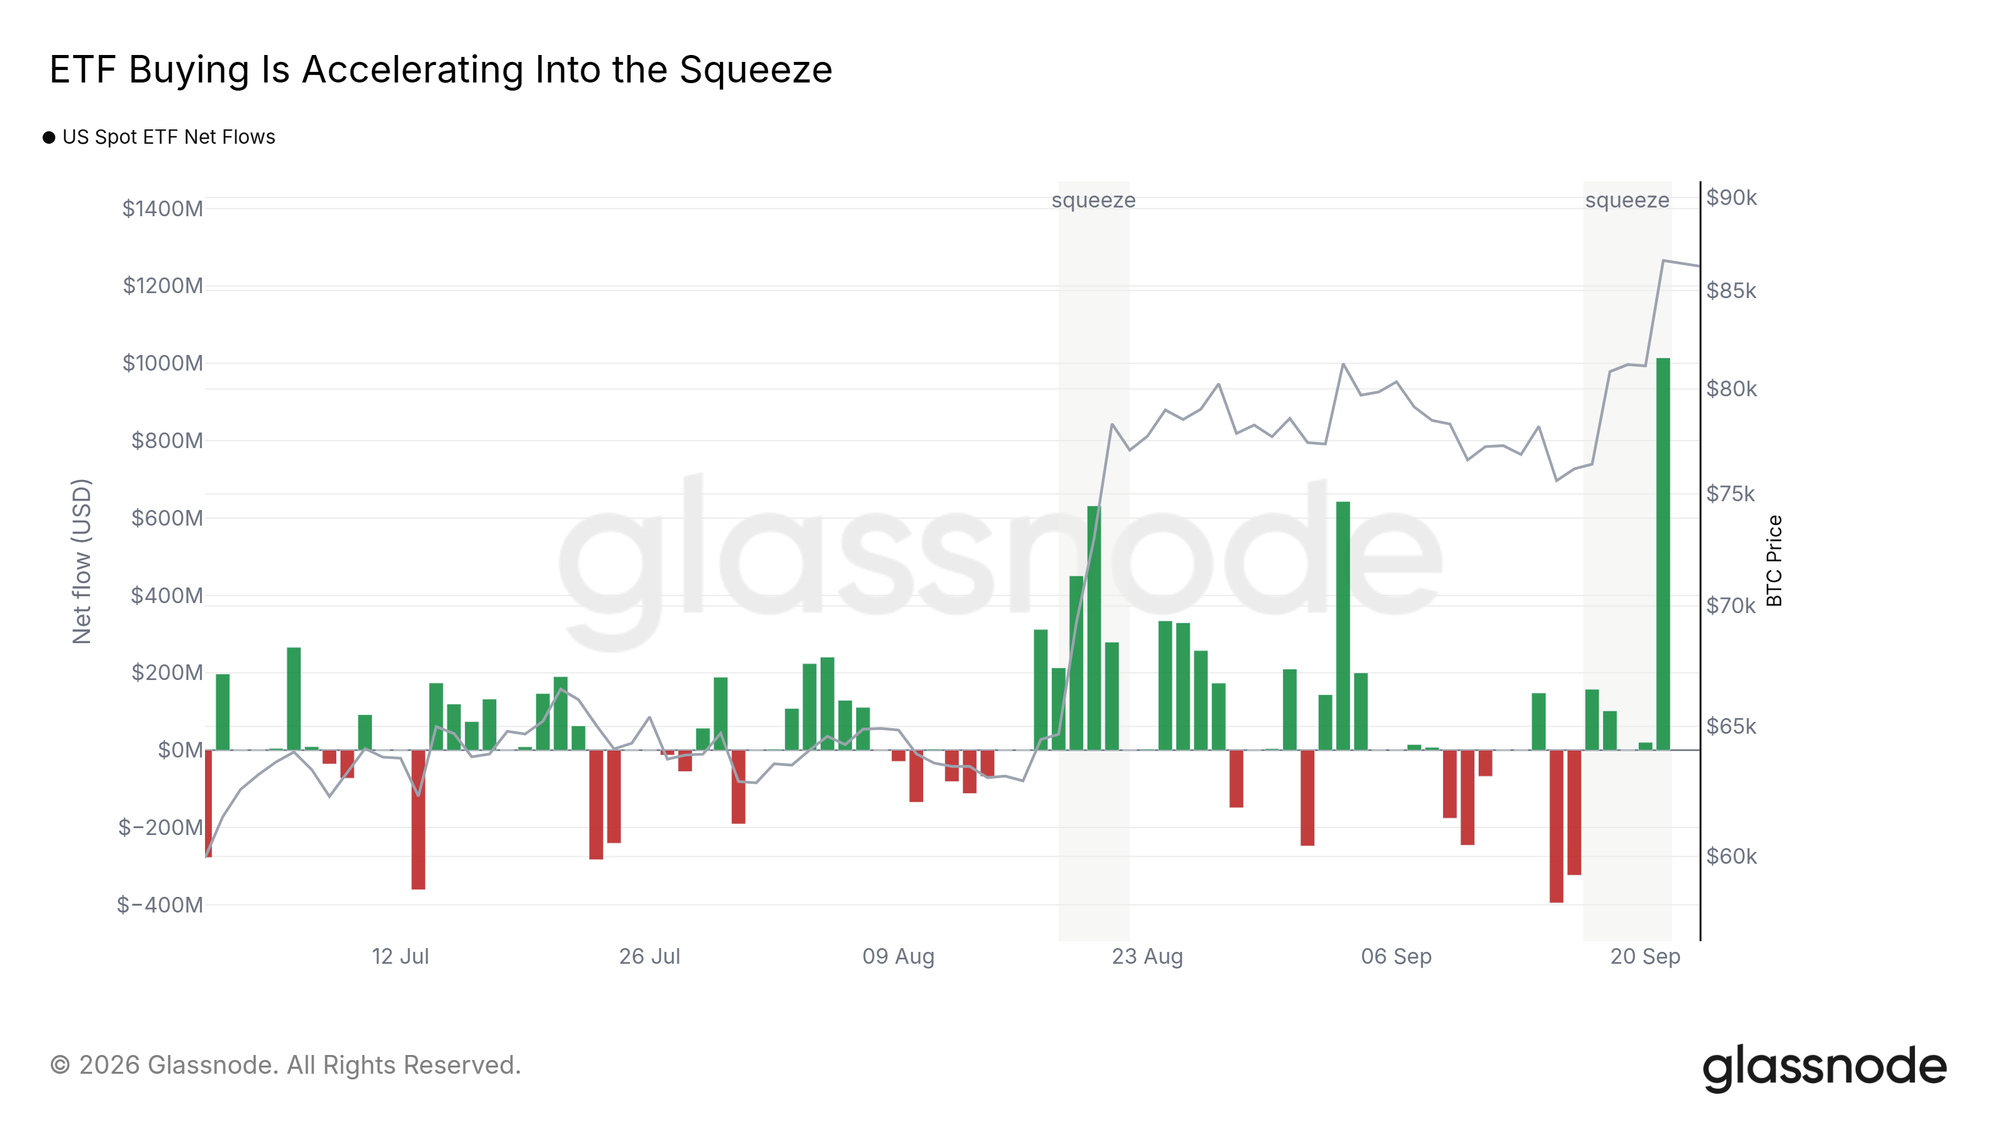
In the five trading days since this squeeze began, U.S. spot ETFs have experienced a total inflow of about $1.3 billion, compared to net outflows in the previous two weeks. The most recent single-day inflow is also the largest day since early July.
Funds are buying more as prices rise. If inflows maintain this pace, ETF demand will continue to support this market move.
Volume Returning with Buying Demand
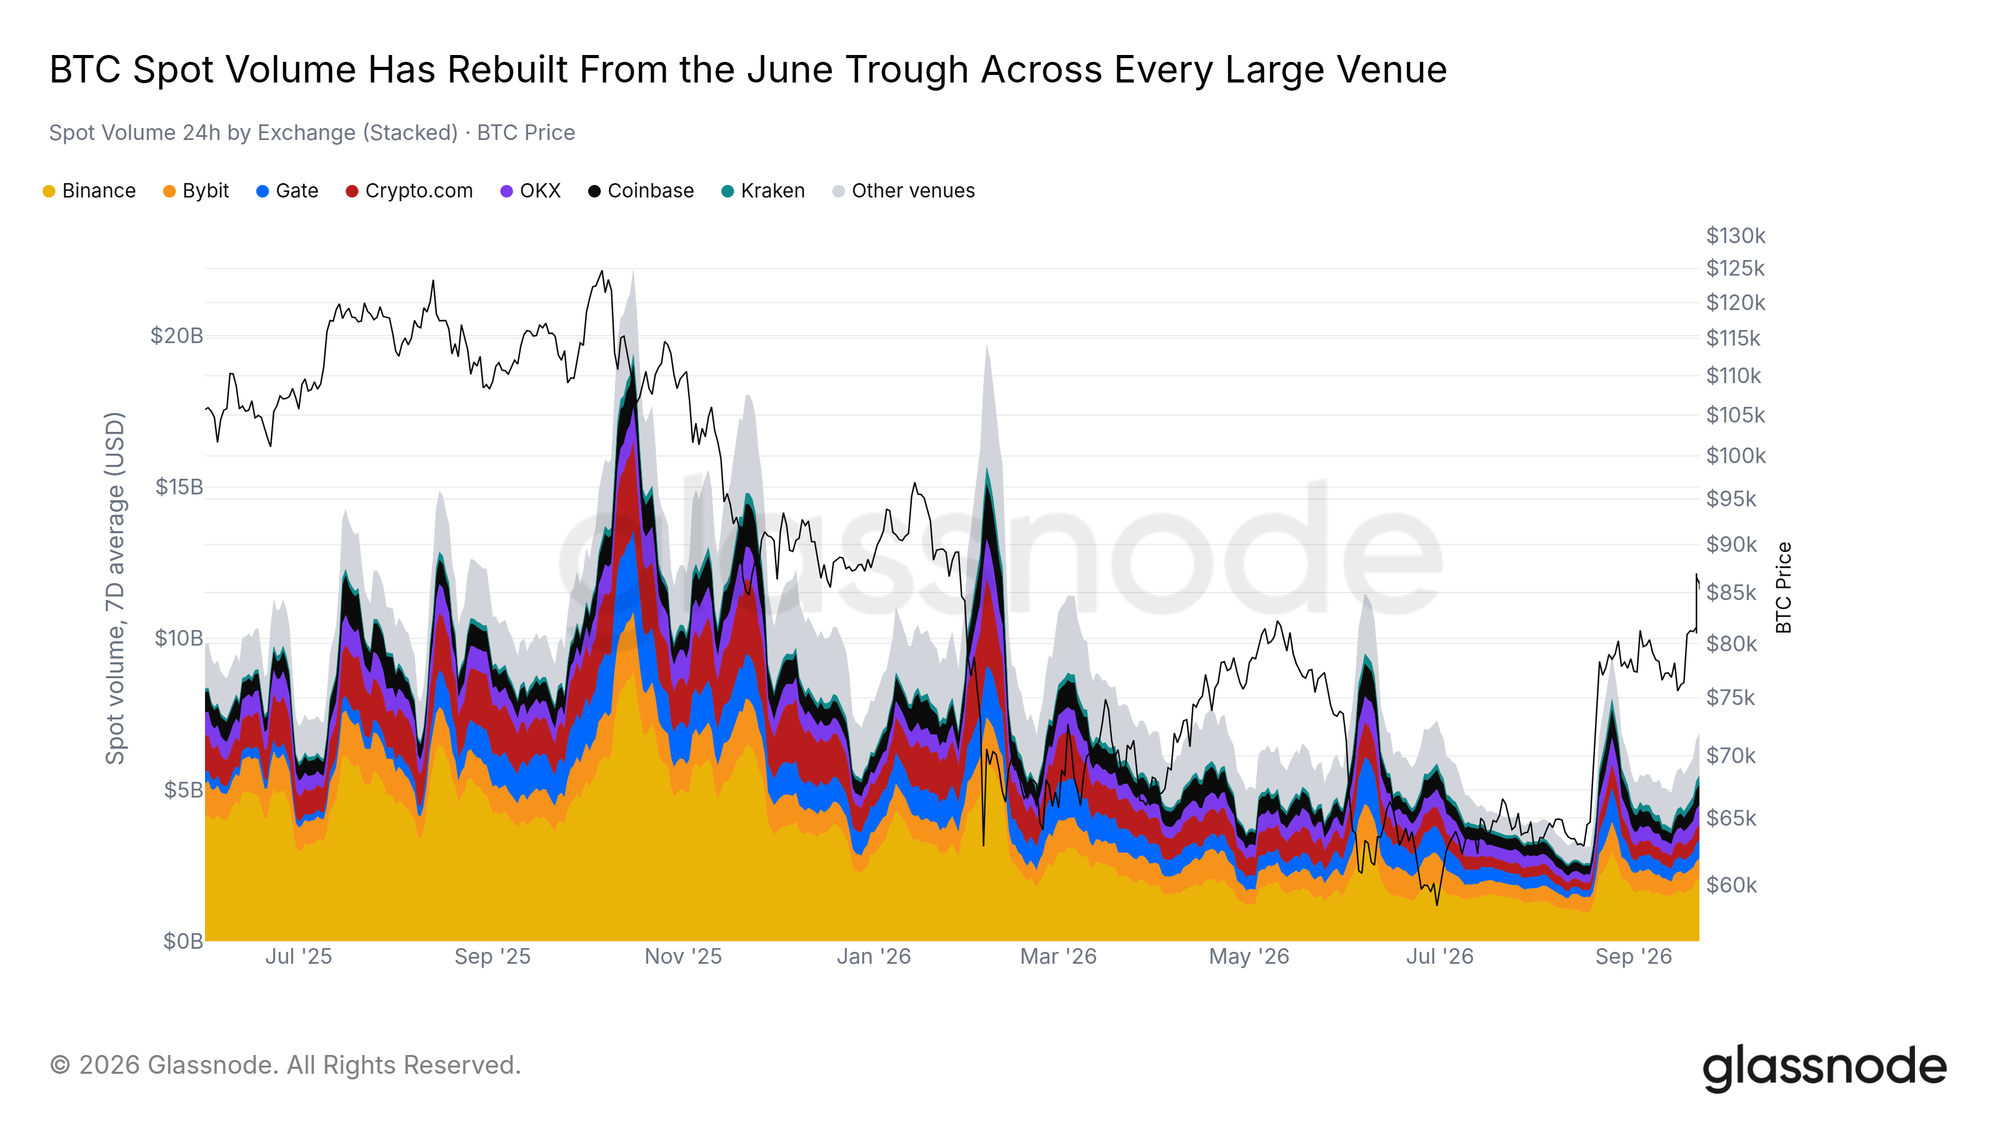
Total spot trading volume across exchanges has more than doubled since the low in August, increasing about 121% since the rebound started.
More important than the volume itself is the context in which it occurs. From late 2025 to mid-this year, every expansion in trading volume has been accompanied by declines: the last four times when volume expanded coincided with price declines, reflecting capitulation selling. August broke that sequence, marking the first instance in a year of "volume expansion accompanying price increases."
In contrast to its recent history, the recovery remains incomplete. The seven-day average is still about 30% lower than a year ago, so this resembles volume creeping up from the floor rather than returning to 2025 levels. Only if prices consistently hold above the pre-rebound range can it be confirmed that this is sustainable buying and not just a few weeks of pressure.
Exchange Rankings Still Shifting
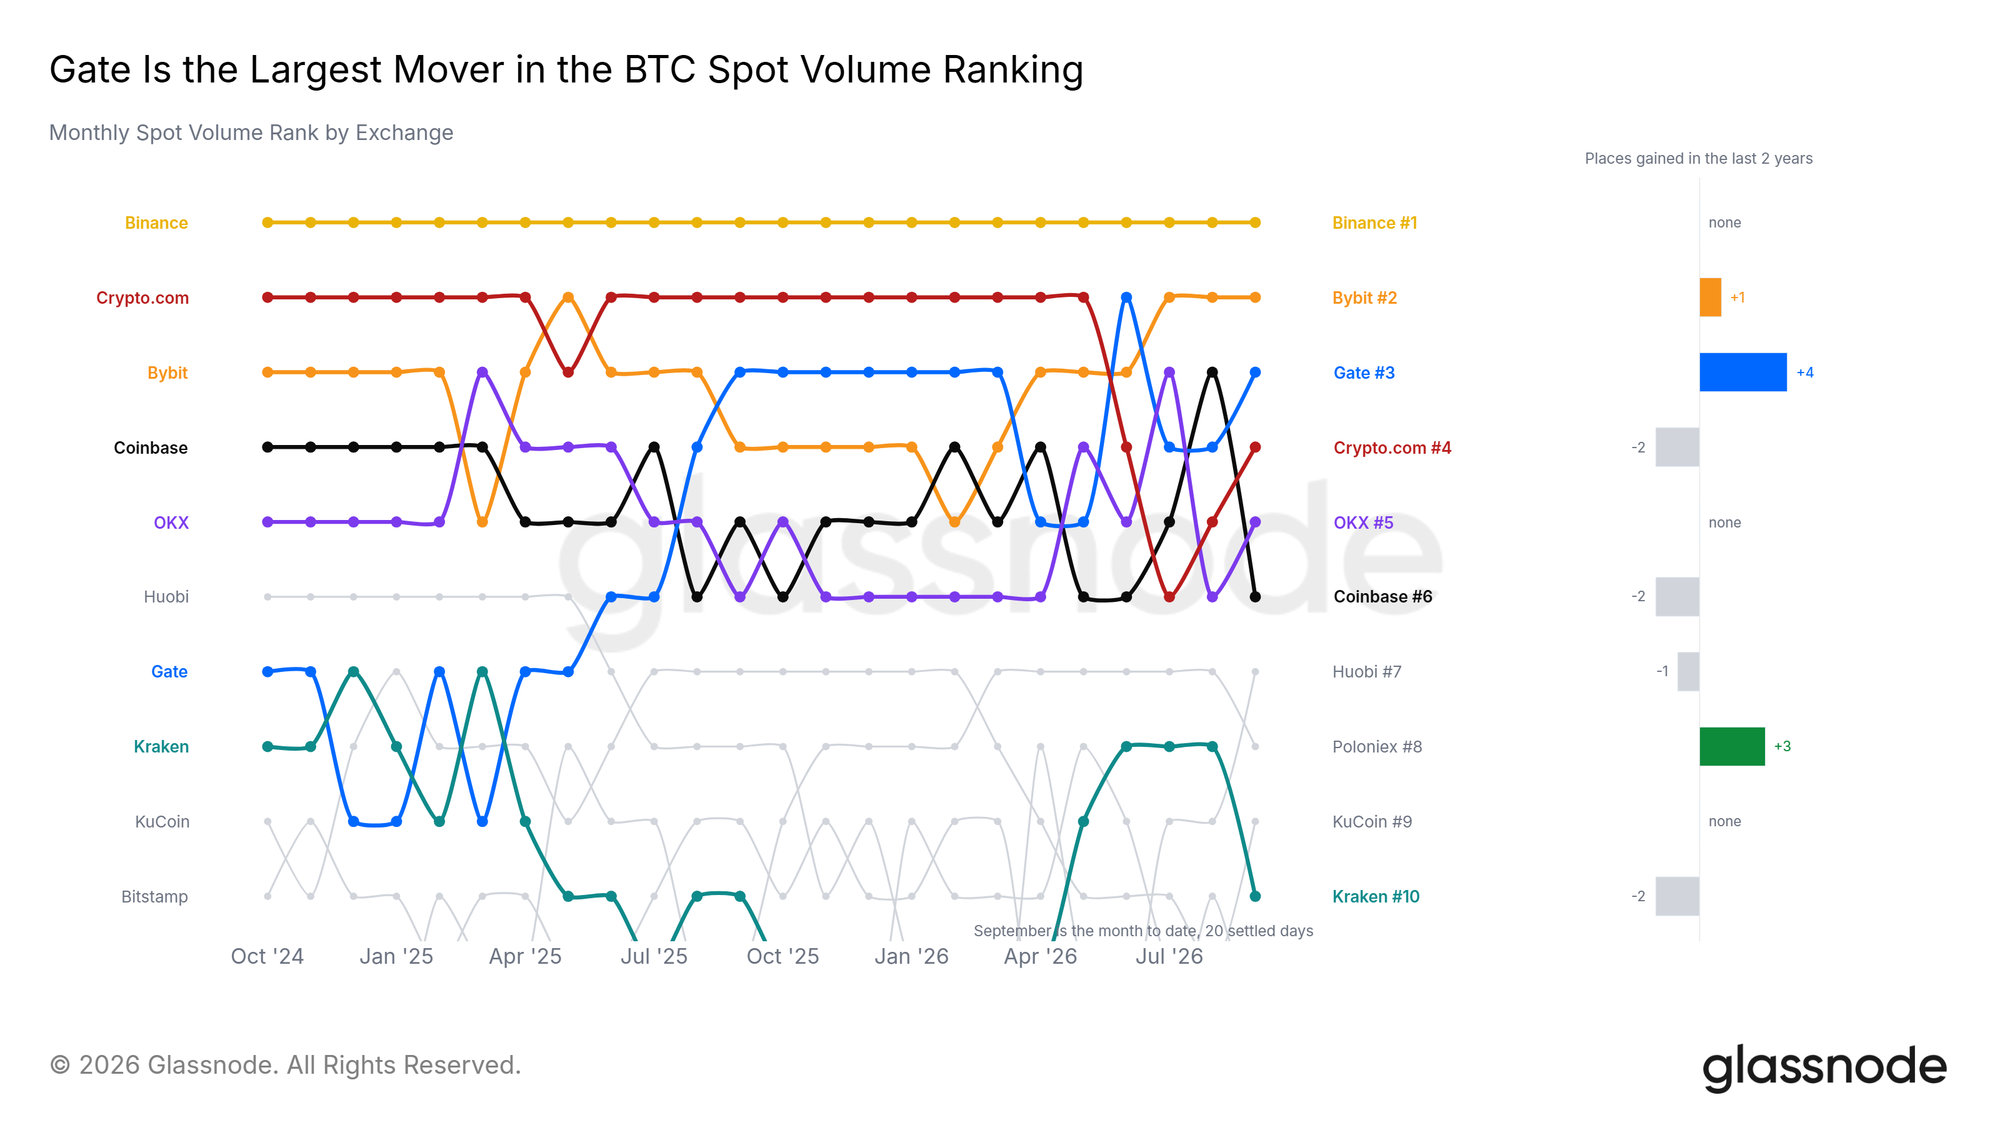
Below the top spot, the rankings have turned over. Gate has risen four places in two years, marking the largest change on the list, currently ranking third by BTC spot trading volume. Poloniex has risen three places, Bybit one, while four other exchanges have seen their rankings drop during the same period.
Gate’s ascent is not just a matter of luck in one month. In the past 24 months, it has stayed in the top three for nine months, with its share of spot trading volume rising from 2.0% two years ago to today’s 9.1%, a net gain of 7.1 percentage points, the highest among all exchanges.
The number one spot is an exception: Binance has been first every month in these 24 months, still clearing about 31% of the covered spot trading volume. Under it, the rotation is broad and not isolated - by share, nine exchanges gained shares and three lost shares, distributed in the middle of the ranking, rather than crowding at the top. This indicates real competition between exchanges and means that the return of funds is spread across many order books instead of flowing toward a single venue, which is healthier for the market than high concentration.
Altcoins Rising, Yet Almost No New Leverage Added
Very Few New Leverage
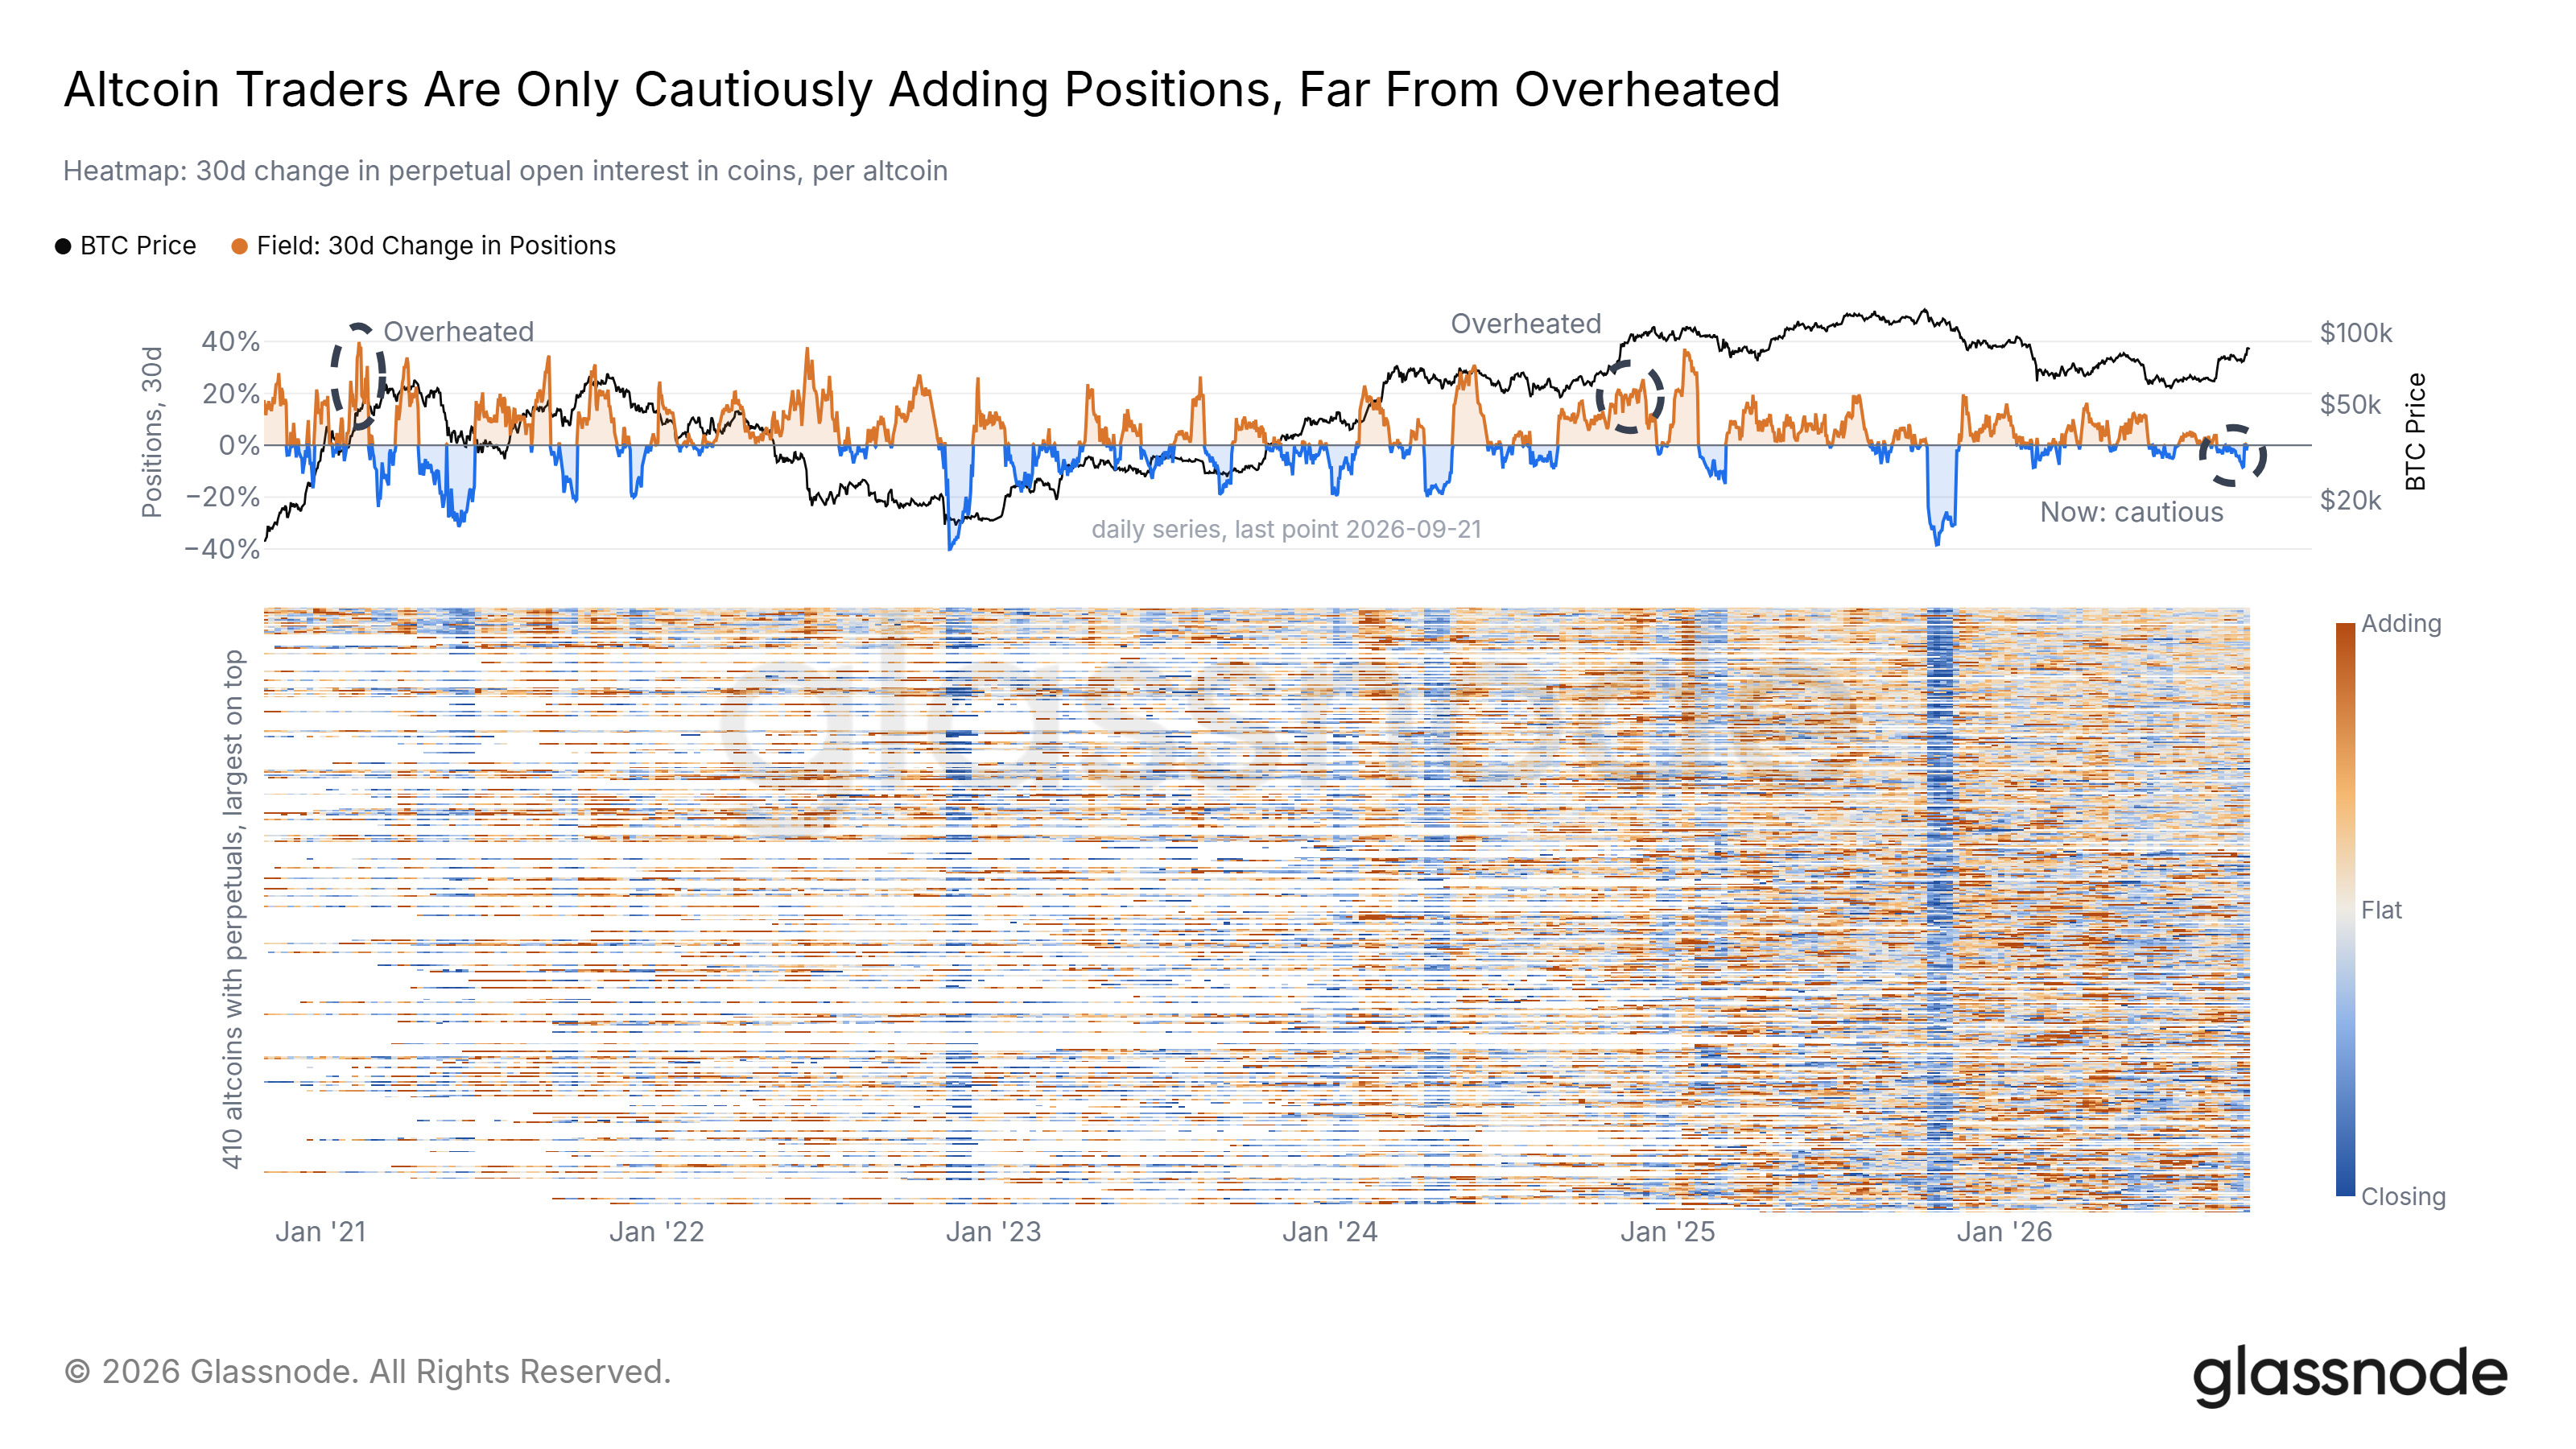
Altcoins have joined the rebound. Over the past week, 72.5% of altcoins in the tracked sample outperformed Bitcoin; during the August squeeze, the highest proportion for the same was only 39%.
Traders have hardly added leverage. The open interest in altcoin perpetual contracts, measured in coins, has hardly increased over the past 30 days, with less than half the market expanding their positions. In the overheated phases of February 2021 and December 2024, the same metric had soared sharply, with most markets simultaneously increasing their positions.
This round of altcoin rises is primarily driven by spot buying, with a lower likelihood of a sudden wave of forced liquidations. A wide base jump in open interest would signal that the market is starting to overheat.
Conclusion
Bitcoin has now positioned itself above the true market mean and the long-term holder supply that has held it back for much of 2026. The June low remains above the realized price; if the price continues to hold above about $77,000, it will become the shallowest bear market low since 2017. Profit-taking is still light, ETF buying is warming, and altcoins are rising with almost no new leverage added. The next test lies around $95,000 to $97,000—where options positions and the average MVRV price converge. Staying above $84,000 keeps this path open; if it drops back below $84,000 and then below $77,000, the recovery narrative will come under pressure.
Data as of: On-chain daily metrics, ETF flows, and options are from September 21, 2026; spot trading volume is from September 22, 2026; hourly prices are from September 23, 2026; recent daily points may still be subject to revision.
免责声明:本文章仅代表作者个人观点,不代表本平台的立场和观点。本文章仅供信息分享,不构成对任何人的任何投资建议。用户与作者之间的任何争议,与本平台无关。如网页中刊载的文章或图片涉及侵权,请提供相关的权利证明和身份证明发送邮件到support@aicoin.com,本平台相关工作人员将会进行核查。
