Crypto Circle Academician: On September 25, Ethereum (ETH) high position profits concentrated and cashed out, what are the underlying logic deductions for the future market? Latest market analysis reference
The current price of Ethereum is 2670. After reaching a high of 2800, the market suddenly started to retrace. Is this a pullback during the upward trend, or does it mark the official end of the bullish market? Don't let a single K-line's rise and fall affect your emotions. A pullback in a bull market is a normal occurrence. The key is to distinguish between support and resistance levels and to judge the market nature by combining different time frame charts, rather than relying on feelings about bullish or bearish.
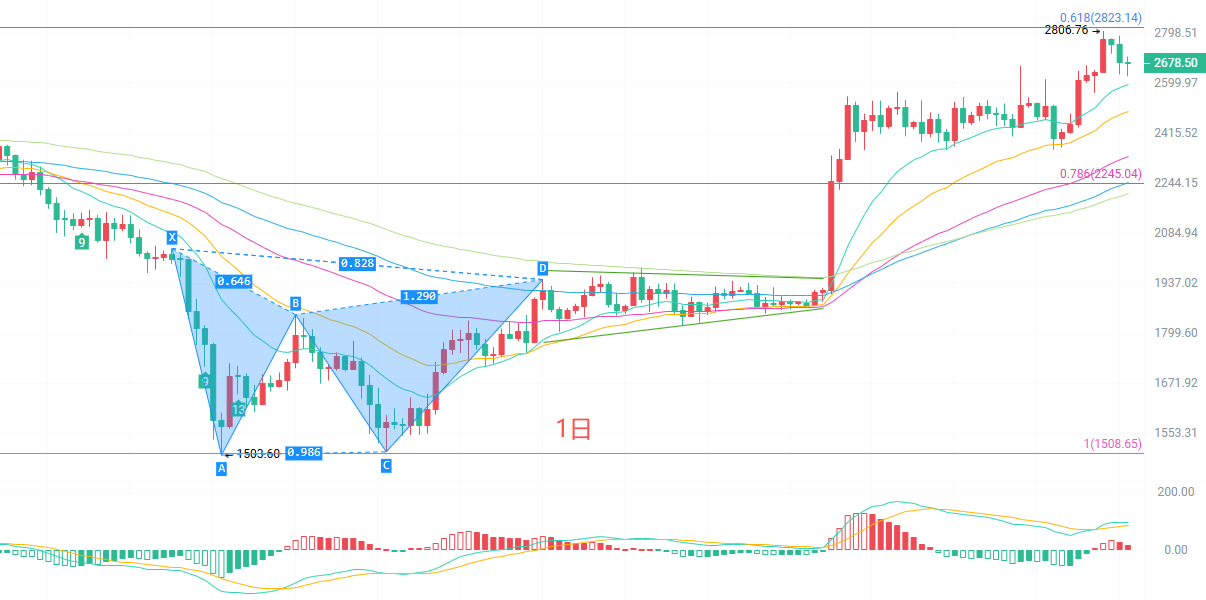
The daily K-line moving average system's bullish structure has not been completely destroyed. The 15 and 30-period EMAs are still supporting the price, and the medium to long-term EMA remains upward. The MACD red bars are continuously shrinking, and the DIF has started to turn downward, indicating a significant decline in bullish momentum. In terms of the Bollinger Bands, the price has retraced from the upper band to the middle band, with the upper band at 2765 and the lower band at 2328. The daily line is currently in a high-level volatile retracement phase, which is a realization of profits after a significant increase and has not formed a trend reversal yet. The strong resistance is in the range of 2760-2806, while the key support is around 2590. If this level is broken, the daily retracement space will further open up.
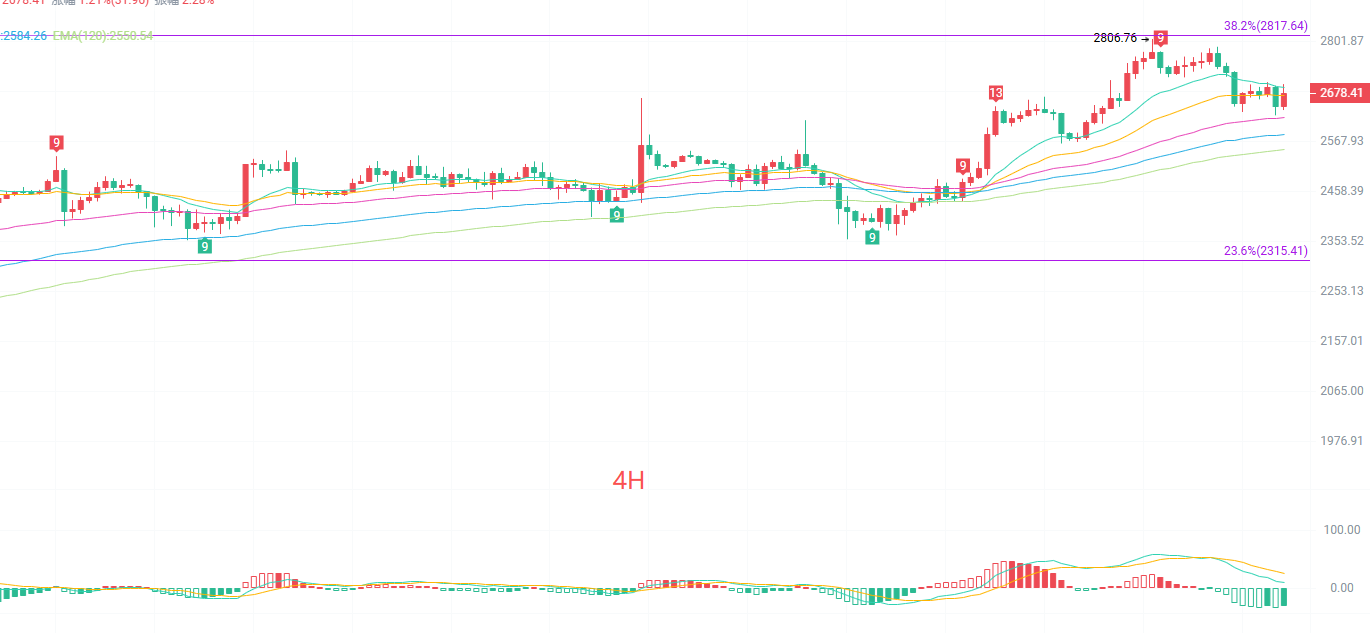
The four-hour K-line has consecutively formed multiple adjustment K-lines. The short-term EMA moving averages have shown a death cross, with EMA15 crossing below EMA30, indicating a weakening short-term trend. EMA60 has formed important support at 2622. The MACD has formed a death cross above the 0 axis, with green bars continuously expanding, indicating that the short-term bearish forces dominate. The Bollinger Bands are narrowing, with the price retracting from the upper band to around the middle band, the upper band at 2797 and the lower band at 2643. This is a typical short-term pullback market, and the market has entered a phase of volatile digestion. If support around 2640 is maintained, there will still be an opportunity to rebound and test the upper pressure; once support is lost, the adjustment will deepen further.
Short-term reference:
If the price breaks above 2650 to 2610, stop loss at 40 points, target looking at 2720 to 2760.
If the price does not break south from 2750 to 2770, stop loss at 40 points, target looking at 2700 to 2660.
Specific operations should mainly rely on real-time market data. For more information, you can consult the author. The article is published with a delay and is suggested for reference only; risk is self-borne.

Warm reminder: The above content is solely created by the author of the public account. The advertisements at the end of the article and in the comments section are unrelated to the author. Please be cautious in discerning; thank you for reading.
免责声明:本文章仅代表作者个人观点,不代表本平台的立场和观点。本文章仅供信息分享,不构成对任何人的任何投资建议。用户与作者之间的任何争议,与本平台无关。如网页中刊载的文章或图片涉及侵权,请提供相关的权利证明和身份证明发送邮件到support@aicoin.com,本平台相关工作人员将会进行核查。