Dear teammates, today the market brings two contrasting heavyweight news. One is that the probability of the Federal Reserve raising interest rates by 25 basis points in October has risen to 64.2%. Morgan Stanley has simultaneously turned bullish on the dollar, expecting its strength to continue until 2027, which means that the valuation denominator of global risk assets is under real pressure. The other news is that the net inflow of the US spot Bitcoin ETF reached a staggering $2.38 billion this week, combined with the $5.3 billion raised after the US Treasury bought back bonds, showing that institutional buying power has not weakened at all. On one side, expectations of macro liquidity tightening are rising, while on the other side, institutions continue to purchase with real money, causing BTC to move in a grinding manner. Today, Sister Qinglan will use the TPV system to help clarify this tangled situation.
Current Price and Time
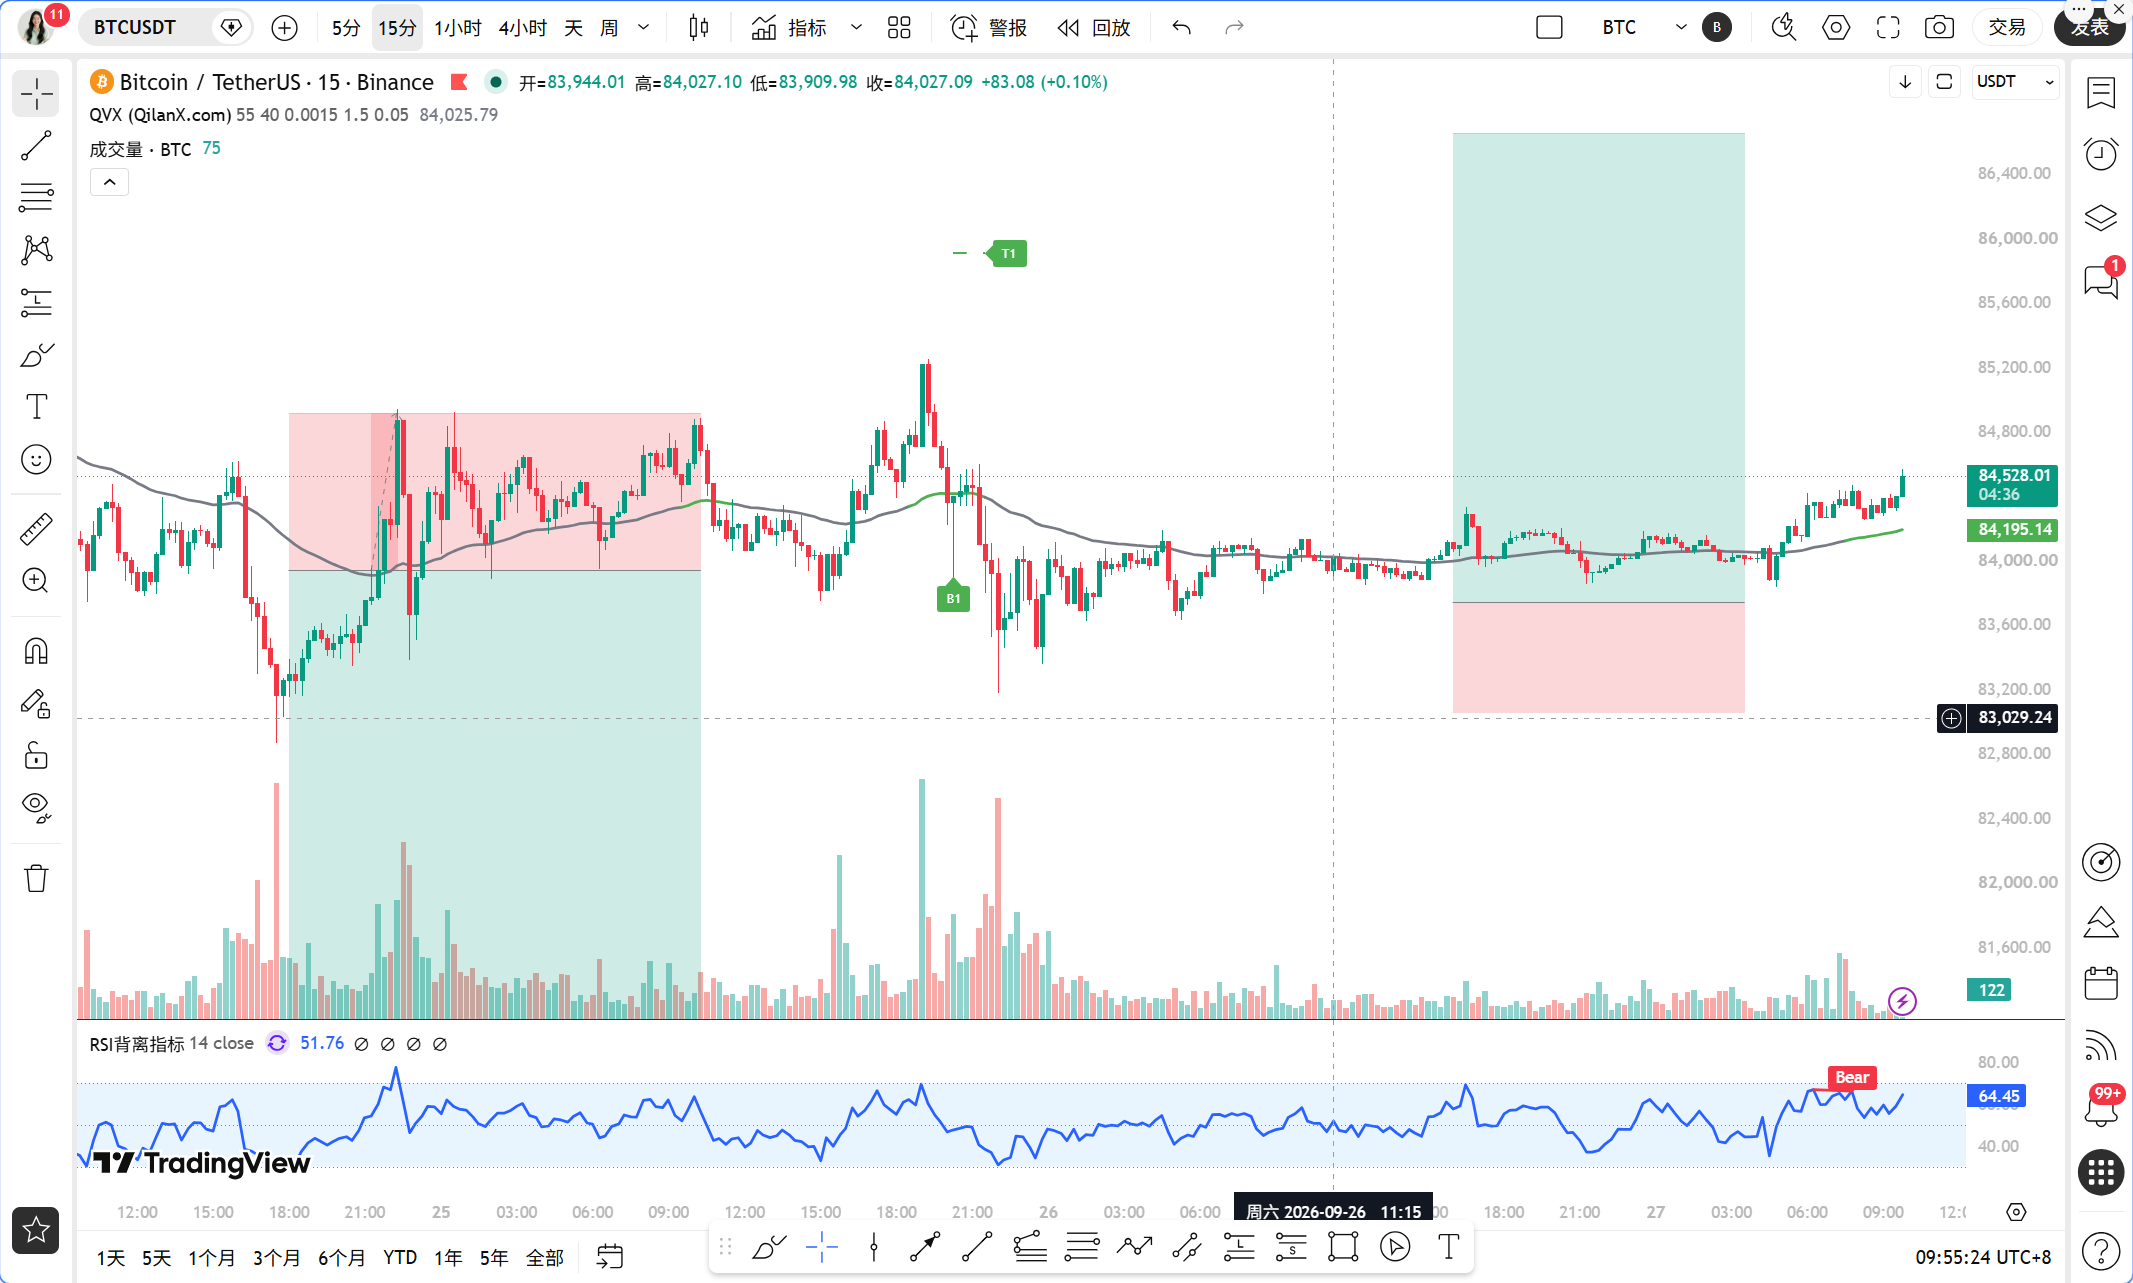
The current time is September 27, 09:54, with the latest BTC price quoted at 84,516 USDT. The price change in the past 24 hours is only 0.39%, seemingly undisturbed, but the internal structure is quietly changing. The Fear and Greed Index reports 70, indicating that the market is in the greed zone, with BTC's market share at 58.31%, and funds are still concentrated on Bitcoin without obvious spillover to altcoins.
Multi-Cycle Status Overview
First, let's look at the daily level. MA5=84371.39, MA10=83799.74, MA30=79954.02, the three moving averages present a standard bullish arrangement, with prices firmly above all moving averages. In terms of MACD, DIF=2440.27, DEA=2215.34, the histogram value=224.93, showing that bullish momentum is still continuing. However, it is necessary to be cautious as the RSI has reached 71.35, entering the overbought area, which suggests that the upward slope at the daily level may face correction pressure.
Now, let's look at the 4-hour level. MA5=84259.55, MA10=84126.95, MA30=84695.21. Note that MA30 is higher than MA5 and MA10, indicating a certain degree of overlap in the moving average system, and that the medium-term trend is shifting from a unilateral rise to consolidation. The MACD shows DIF=125.54, DEA=186.51, histogram value=-60.97, having flipped below the zero axis, with adjustment momentum at the 4-hour level not yet fully released. RSI=51.69 is in the neutral zone, with bullish and bearish forces temporarily balanced.
The 1-hour level is our TPV system's core reference period. MA5=84337.98, MA10=84198.79, MA30=84081.77, with moving averages in a bullish arrangement. MACD's DIF=74.99, DEA=27.91, histogram value=47.08, indicating that bullish momentum is still present. RSI=62.08 has space before it reaches overbought conditions. Most importantly, the 1-hour EMA55=84141.83, and the current price of 84,516 is clearly above it.
15-minute level. MA5=84389.60, MA10=84367.58, MA30=84215.36, with moving averages in a bullish arrangement. The MACD histogram value=7.97, showing weak momentum but still above the zero axis. RSI=58.08 is neutral but strong.
TPV Signal Verification
According to the core rules of the Qinglan TPV system, we verify each point.
In terms of trend positioning, the current price of 84,516 is greater than the 1-hour EMA55 of 84,141.83, indicating a bullish trend area.
Verification of long conditions. First, the price stabilizes above the 1-hour EMA55; in the past 8 1-hour candles, the closing price was above EMA55 5 out of 8 times, with only 1 crossover, indicating that the price is consistently running above EMA55. Second, the support stabilization pattern shows that recent 1-hour candles repeatedly found support in the range of 84,100 to 84,200, bouncing back after hitting effective lows, meeting the condition. Third, the declining momentum is exhausted, with a 1-hour MACD histogram value of 47.08 still positive and not showing continuous shortening, and RSI rebounding from the low to 62.08, with momentum direction upward, meeting the condition. With all three conditions established, the TPV system gives a long signal.
In terms of oscillation auxiliary data, in the past 8 1-hour candles, the closing price was above EMA55 5 out of 8 times, with 1 crossover. The current price's absolute magnitude from EMA55 is 0.44%. According to the system rules, the oscillation threshold requires the number of closing prices above EMA55 to be between 3 and 5 times and the crossover number to be at least 2 times, or the price’s deviation from EMA55 to be less than 0.3%. Currently, with only 1 crossover and a deviation of 0.44% exceeding the 0.3% threshold, it does not meet the criterion for oscillation judgment, confirming that the system is currently in a unilateral trend, leaning bullish.
On-chain and Financial Aspects
The signals transmitted by on-chain data are relatively complex. With the Fear and Greed Index at 70 in the greed zone, it indicates that market sentiment is warm, but greed often signifies accumulating short-term risks of chasing highs. The BTC market share of 58.31% remains high, with little obvious flow toward altcoins, providing support for BTC's price itself.
The funding aspect is currently the biggest contradiction. On the bullish side, listed companies have increased their holdings by 2,305 BTC this week, with Strategy holding a total of 846,000 BTC, leading the pack; the ETF saw a net inflow of $2.38 billion this week, and after the US Treasury's bond buyback, the Bitcoin spot ETF has raised $5.3 billion. With global debt exceeding $365 trillion, Bitcoin has become the biggest winner in currency depreciation trading. A Fidelity executive even provided a long-term prediction of $300,000 by 2029. On the bearish side, the Coinbase Bitcoin premium index has recorded negative values for four consecutive days at -0.0082%, indicating weak US buying power in the short term, and the probability of the Federal Reserve raising interest rates in October has risen to 64.2%. Morgan Stanley's bullish stance on the dollar is expected to remain strong until 2027, and the strengthening dollar will suppress risk assets. The tug-of-war between bullish and bearish funding is the fundamental reason why current prices are grinding to a halt.
Key Attack and Defense Levels
The first pressure level above is around 84,695, where the 4-hour MA30 is located, which is also a previous concentration area. If it can break through with volume and stabilize, the next target will look towards the range of 85,200 to 85,500. The first support level below is the 1-hour EMA55 at 84,141, which is the TPV system's boundary line between bulls and bears and has been tested repeatedly as an effective support. If it breaks this level, the second support will be in the area between the daily MA5 at 84,371 and the daily MA10 at 83,799.
Trading Strategy
Direction: Bullish bias. The three long conditions of the TPV system are simultaneously satisfied, with the bullish structure intact above the 1-hour EMA55, and the daily moving averages' bullish arrangement provides support for the larger cycle.
Entry Conditions: The current price of 84,516 is within the entry zone. A more prudent approach would be to wait for the price to retest around the 1-hour EMA55 at 84,141, and enter after seeing stabilization signals like a long lower shadow or a bottoming formation. If the price breaks above 84,695 with volume and confirms a retest, additional positions can also be added.
Stop Loss: Set approximately 0.5% below the 1-hour EMA55, around 83,750. If the 1-hour candle closes below the EMA55 for two consecutive instances, the TPV system's long signal becomes invalid, and one must exit unconditionally.
Target Levels: First target 84,695, second target 85,200, third target 85,800. After reaching the first target, one could reduce the position by one-third, and for the remaining position, move the stop loss to the breakeven point to let profits run.
Risk Warning
Heightened expectations for a Federal Reserve interest rate hike and a strong dollar may trigger a collective adjustment of risk assets at any time. Please strictly adhere to stop-loss discipline and avoid heavily chasing highs when the greed index is at 70.
Follow Qinglan's Crypto Classroom to grasp more trading opportunities! Visit our official website www.qinglan.org
📊 Qinglan TPV Trading Strategy Backtest Reference
🕒 Last Backtest Time 09-27 07:00:02
Total Analysis: 4138 Backtests: 4138 Accuracy: 78.6% (3251/4138)
免责声明:本文章仅代表作者个人观点,不代表本平台的立场和观点。本文章仅供信息分享,不构成对任何人的任何投资建议。用户与作者之间的任何争议,与本平台无关。如网页中刊载的文章或图片涉及侵权,请提供相关的权利证明和身份证明发送邮件到support@aicoin.com,本平台相关工作人员将会进行核查。