Cryptocurrency Circle Scholar: In just three days, Ethereum (ETH) went from a short squeeze to a waterfall on October 10, causing many leveraged players to go to zero overnight in this round of long and short killing.
The current price of Ethereum is 2490, with both longs and shorts waiting for direction. Some say it will drop to 2300, others say it will bounce back to 2600. Arguing back and forth is actually meaningless. Before the market moves, no one can predict. What we can do is map out the range: when it reaches the position, we act, and when it doesn't, we watch the show. I will teach you a simple method: mark the support and resistance levels well, set reminders, and act when it reaches those levels. This way, you don’t have to watch the market closely, and you won't be driven by emotions.
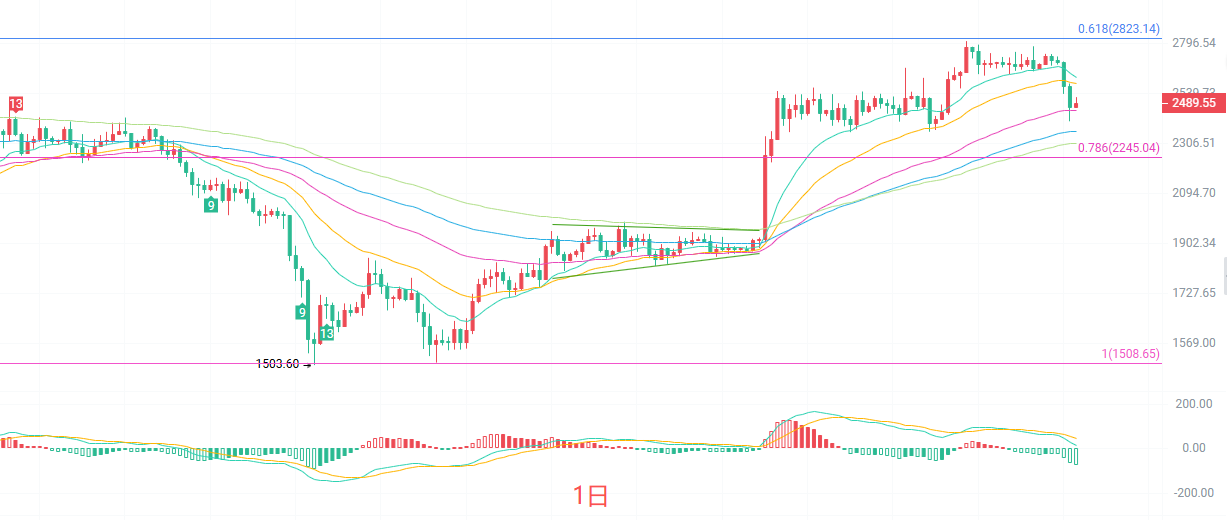
The daily candlestick has already broken below the lower Bollinger Band at 2522, and has simultaneously broken below the EMA15 and EMA30, with all short-term moving averages turning down. The MACD bearish momentum is still being released. The only good news is that the price is still above the EMA60; this line is the mid-term dividing line for bulls and bears. The TD sell countdown has only reached 3, meaning that the daily level adjustment may not be over yet. Next, we will focus on whether 2450 can hold. If it can't hold, we will have to test 2360 or even lower.
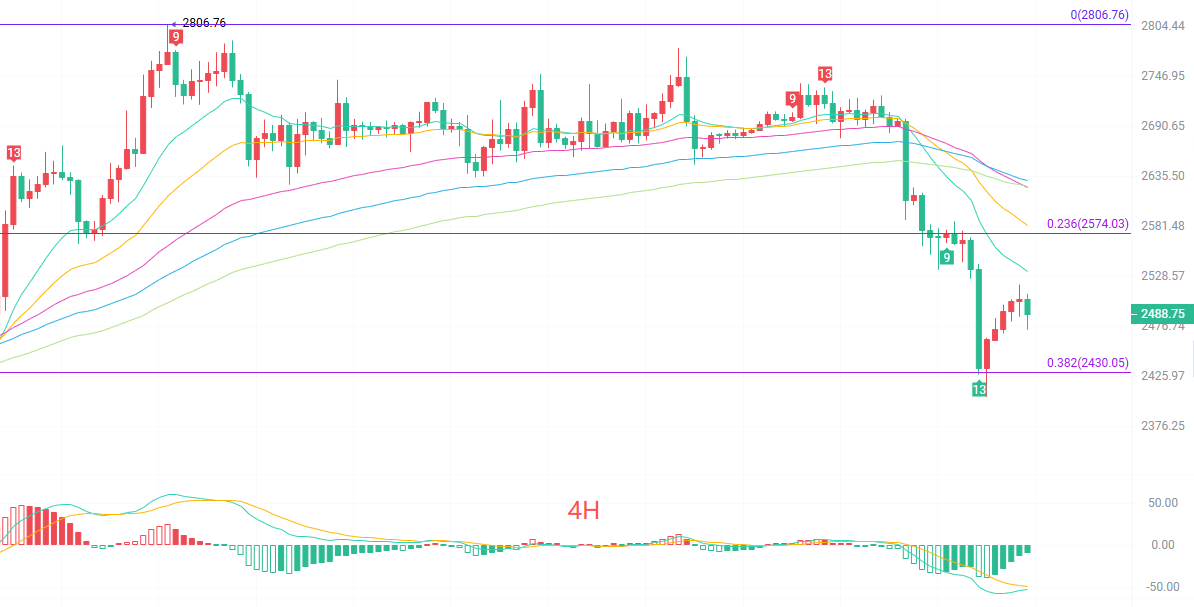
In the four-hour candlestick, all EMA moving averages have been lost, and they are in a bearish arrangement. The EMA15 is at 2533, forming the first resistance; EMA30 and EMA60 are exerting pressure layer by layer. The MACD is near the zero axis, with a death cross and the bearish momentum accelerating. The Bollinger Bands are opening downwards, with the midline at 2567 having changed from support to resistance, and the lower line at 2404 is currently the only technical support. However, it is worth noting that near the recent low of 2443, TD buy counts of 9 and 13 have appeared, signaling short-term oversold conditions. The price bounced from 2443 to 2510 and was brought back down, indicating weak rebound strength, with both longs and shorts repeatedly pulling back and forth here.
Short-term reference:
Go long at 2400 to 2350 for a stop loss of 40 points, with targets looking at 2500 to 2550.
Go short at 2530 to 2570 for a stop loss of 40 points, with targets looking at 2450 to 2400.
Specific operations should be based on real-time market data; for more detailed information, please consult the author. There may be delays in article publication; it is recommended for reference only, and the risk is borne by the reader.

Friendly reminder: The above content is solely created by the author on the public account. The advertisements at the end of the article and in the comments section are not related to the author, please discern carefully. Thank you for reading.
免责声明:本文章仅代表作者个人观点,不代表本平台的立场和观点。本文章仅供信息分享,不构成对任何人的任何投资建议。用户与作者之间的任何争议,与本平台无关。如网页中刊载的文章或图片涉及侵权,请提供相关的权利证明和身份证明发送邮件到support@aicoin.com,本平台相关工作人员将会进行核查。