Cryptocurrency Circle Academician: On October 12, Bitcoin (BTC) is waiting for a reason, while the entire market is waiting for the major coin to move first.
The current price of Bitcoin is 83,400. When I wrote this today, it was raining outside. After trading for a long time, I increasingly feel that this matter is very similar to the weather; all you can do is to carry an umbrella when you go out; you can't determine whether it will rain or not. Yesterday, a fan sent me a private message saying that they followed a certain teacher and got trapped in a long position, asking me what to do. I didn’t give any advice, just asked one question: Did you set a stop loss before entering the market? They said no. This is no longer a market issue; it's a discipline issue. The market educates people every day; tuition must be paid to either the market or through learning, it must be paid either way. I am also still on the path of paying tuition; I just hope everyone pays a little less.
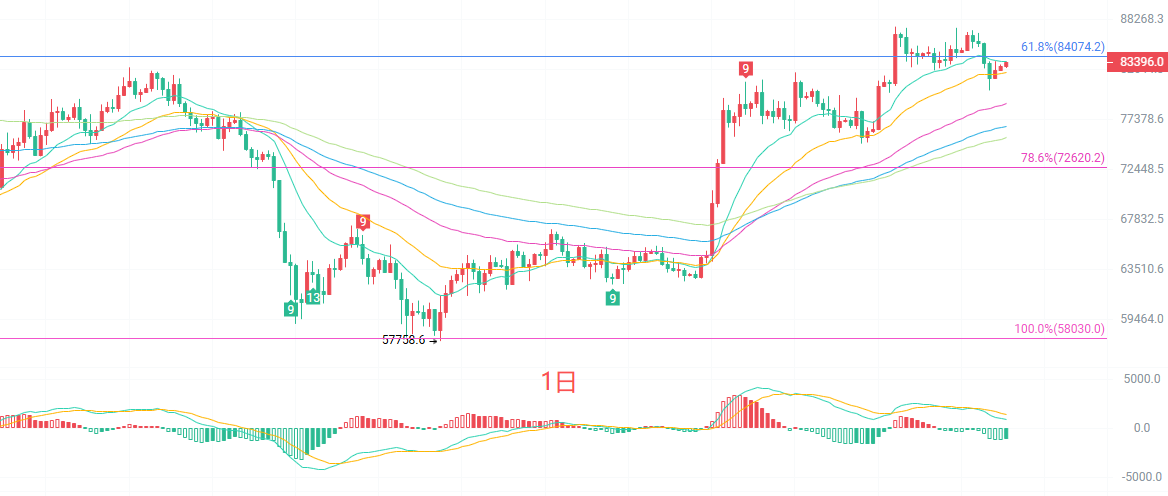
The daily candlestick chart clearly shows a contraction and a sideways trend. The medium-term bullish arrangement of the moving average system has not been broken, but it is gently pressed down by the EMA15. The middle band of the Bollinger Bands at 84,204 is the turning point between bullish and bearish at the daily level; the current price is slightly below the middle band, indicating a weak fluctuation. On the MACD side, the DIF has fallen below the DEA, indicating that the short-term upward momentum is diminishing. If it does not break through the position of 84,074, there can be no talk of a daily candlestick reversal; once it effectively stands above 84,200, the next target will be the previous high around 87,000. The lower limit to watch first is whether the EMA30 at 82,270 can hold.
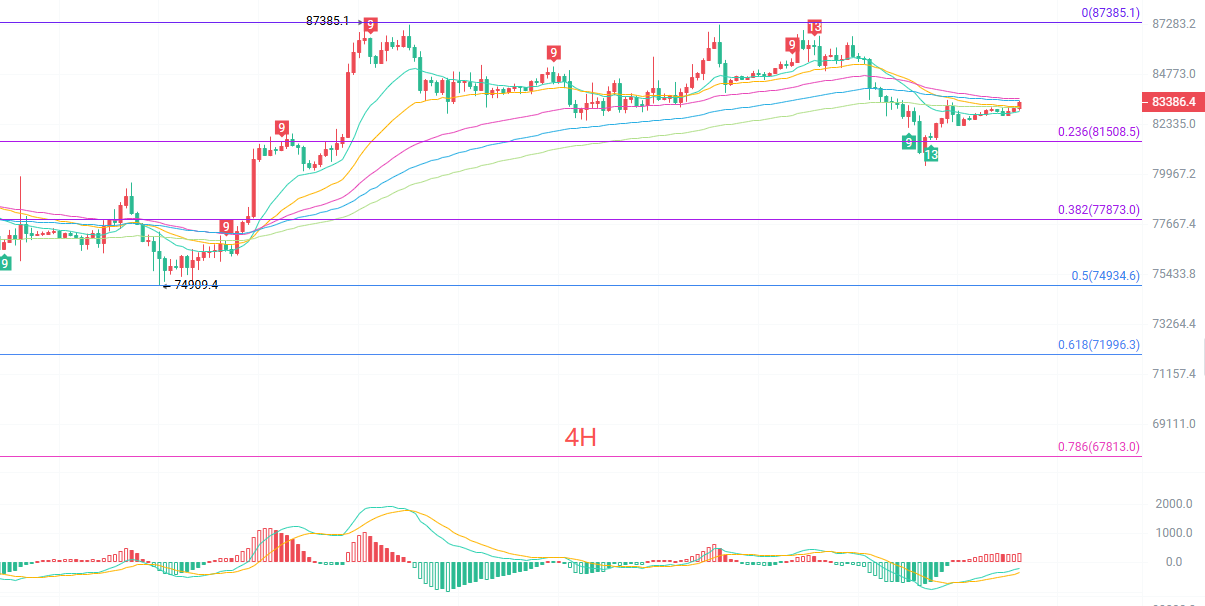
The four-hour candlestick chart is much better than the daily one. The MACD has just golden crossed and turned red, showing that there is a short-term rebound buildup. However, the moving averages are very tangled, with the four lines squeezed into a 700-dollar range from 82,900 to 83,600, twisting together like a twist. This is a typical period for directional selection. The upper band of the Bollinger Bands at 83,733 is right above, and the price hasn’t moved smoothly between the middle band at 82,611 and the upper band. The key support for this round of adjustment is at 81,508. What we need to watch in the four-hour chart is: can we increase the volume to surpass the upper band pressure of 83,733? Only if it is surpassed can we say the rebound has continuity; if not, we may need to revisit 82,600 or even 81,500.
Short-term reference
Going long from 81,700 to 81,200 to stop the decline, stop loss at 500 points, target at 83,500 to 85,000.
Going short from 83,500 to 84,000 for stagnation, stop loss at 500 points, target at 82,500 to 81,500.
The specific operations are mainly based on real-time data from the market. For more information, details can be consulted with the author. There is a delay in article publication; advice is for reference only, and risks are borne by the reader.

Warm reminder: The above content is solely created by the author’s official account. The advertisements at the end of the article and in the comment area are not related to the author; please distinguish carefully. Thank you for reading.
免责声明:本文章仅代表作者个人观点,不代表本平台的立场和观点。本文章仅供信息分享,不构成对任何人的任何投资建议。用户与作者之间的任何争议,与本平台无关。如网页中刊载的文章或图片涉及侵权,请提供相关的权利证明和身份证明发送邮件到support@aicoin.com,本平台相关工作人员将会进行核查。