Academician of the Cryptocurrency Circle: Is the Ethereum (ETH) pullback on October 12 not over yet? Both the daily and four-hour charts are signaling at the same time. Those who understand are already waiting for the final drop.
The current price of Ethereum is 2525. To be honest, at this moment, if anyone confidently tells you it will definitely rise or definitely fall, just blacklist them. The charts are here, both bulls and bears have their reasons; the difference lies in which timeframe you’re looking at. From the daily perspective, it's a pullback; from the four-hour view, it's a rebound; from the minute chart, you can count a bunch of waves. In trading, the hardest part is not the analysis but admitting that you might be wrong. That's why stop-loss is important; it's not admitting defeat but leaving yourself a way out.
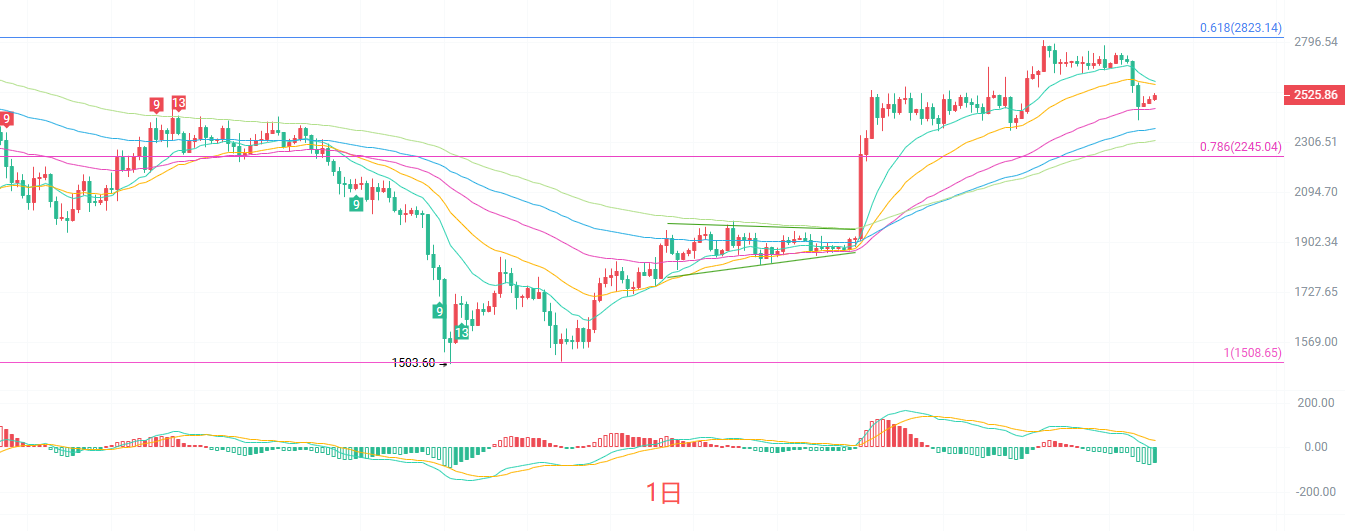
The daily candlestick is currently retracing to around 2525. On the moving average system, the EMA60 is at 2462, and EMA90 is at 2367. The mid-term bullish arrangement hasn’t been broken, but the price has already fallen below EMA15 and EMA30, and the short-term moving averages are turning down. In terms of the Bollinger Bands, the current price of 2526 is close to the lower band at 2484, while the middle band at 2649 is the first hurdle above. Regarding MACD, the DIF has crossed below the DEA, indicating that the short-term adjustment at the daily level hasn’t ended. However, note that the Bollinger lower band at 2484 and the EMA60 at 2462 overlap as a support zone. If this level holds, the daily chart remains within a normal pullback during an uptrend; only an effective drop below 2462 would require a reevaluation of the trend.
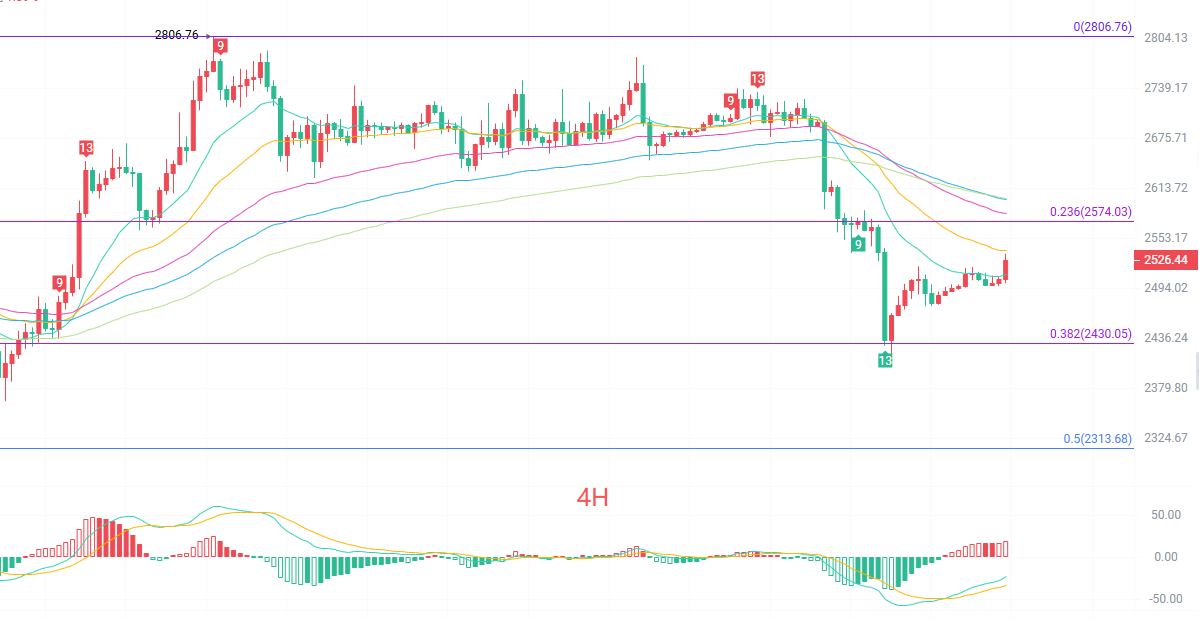
The four-hour candlestick currently has the price above the EMA15 but is being capped by EMA30 and EMA60, with the moving averages in a bearish arrangement. The rebound is a correction following a decline. The middle band of the Bollinger Bands at 2494 has been reclaimed, and the upper band at 2535 is the immediate pressure. The bearish momentum in MACD is waning, and there are signs at the four-hour level of stabilization and bottoming; it depends on whether it can break through the small hurdle at 2535 in volume.
Short-term reference:
For upward movement, stop at 2490 to 2480, with a stop-loss of 40 points, and target 2535 to 2580.
For downward movement, stop at 2570 to 2580 with a stop-loss of 40 points, and target 2520 to 2460.
Specific operations should be based on real-time market data. For more details, you can consult the author. There may be delays in article publication; suggestions are for reference only, and risks are borne by the reader.

Warm reminder: The above content is solely created by the author of the public account. The advertisements at the end of the article and in the comment section are unrelated to the author. Please discern carefully. Thank you for reading.
免责声明:本文章仅代表作者个人观点,不代表本平台的立场和观点。本文章仅供信息分享,不构成对任何人的任何投资建议。用户与作者之间的任何争议,与本平台无关。如网页中刊载的文章或图片涉及侵权,请提供相关的权利证明和身份证明发送邮件到support@aicoin.com,本平台相关工作人员将会进行核查。