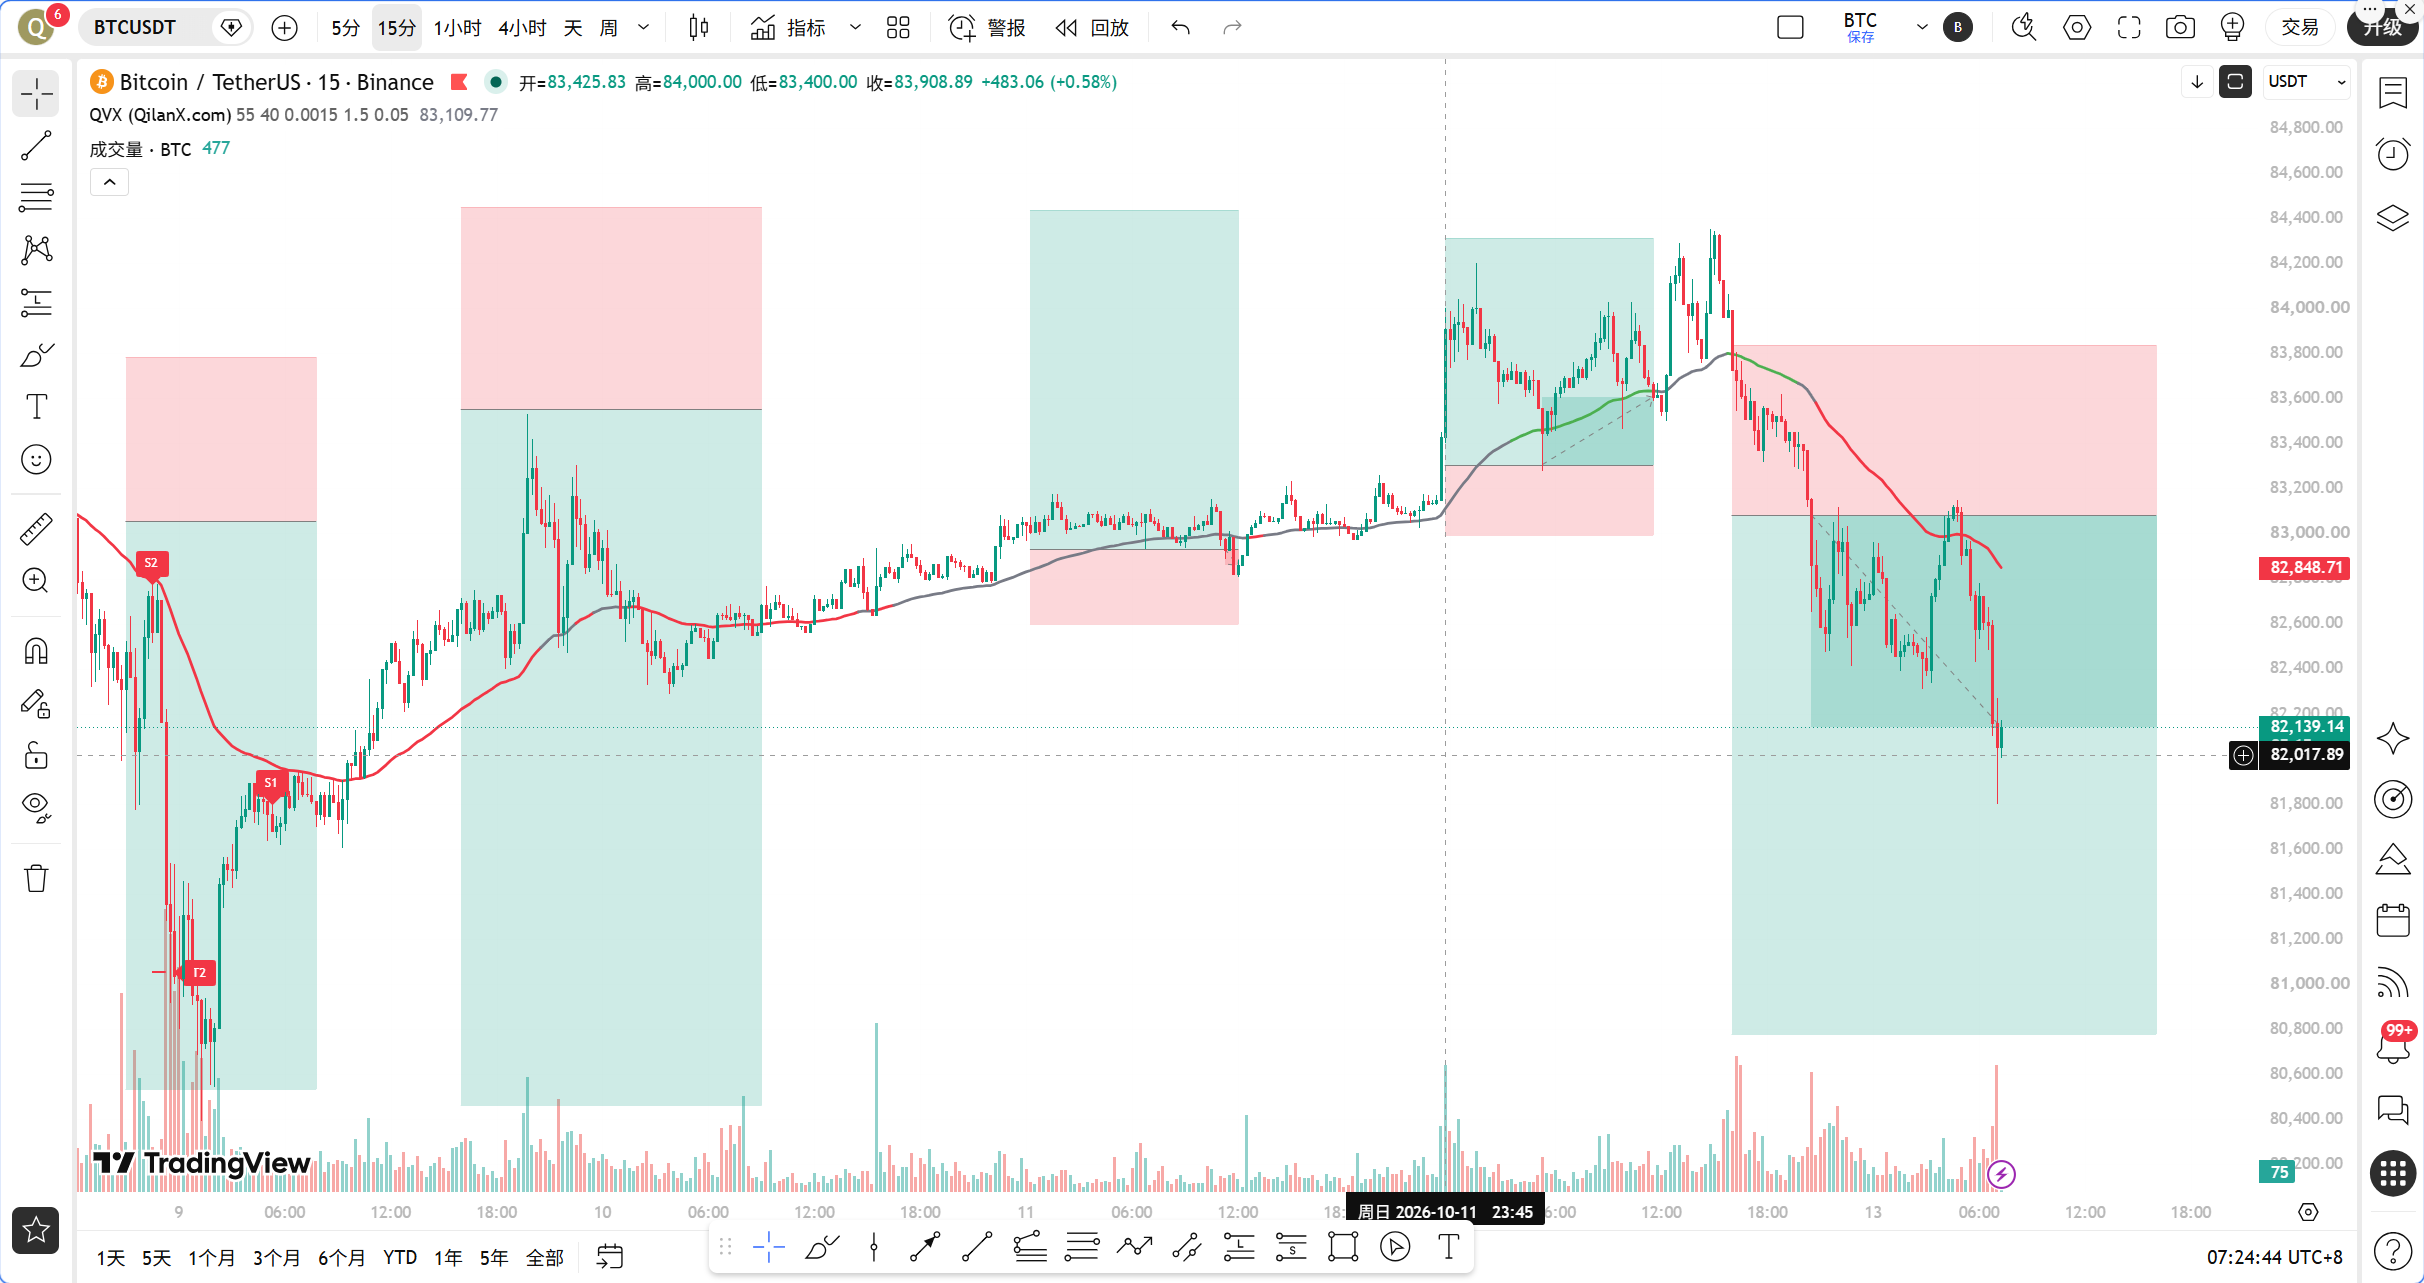
The hawkish remarks from Federal Reserve official Harker became the heaviest stone in the market today. He clearly stated a preference for more frequent small rate hikes and bluntly expressed that current policy remains insufficiently restrictive. What does this mean? It means that the market's prior optimistic expectation that the rate hike cycle had peaked was doused with cold water. Risk assets were hit hard, with BTC rapidly falling after reaching 84254 USDT, dropping more than 2%. Meanwhile, Brent crude oil broke through 110 US dollars, rising by 2.2%, and inflation expectations were further heightened, providing stronger justification for the Federal Reserve to maintain its tightening stance. With these two negative factors combined, the market's risk aversion sentiment clearly intensified.
Another concerning message comes from the IMF. The IMF warned that the scale of tokenized assets has reached 65.1 billion dollars, and an automated clearing mechanism could amplify financial shocks. While this is a medium to long-term regulatory signal, the short-term suppression of market sentiment cannot be ignored, especially at a time when the market is already fragile. However, there are also positive signals bubbling beneath the surface. The SOPR for long-term Bitcoin holders has risen to 1.25, indicating that long-term holders are back in a profit state; historically, similar signals often appear in market bottom areas. Amidst this intertwining of bullish and bearish factors, today, Sister Qinglan used the TPV system to clarify the market situation.
The current time is October 13 at 08:56, and the latest BTC quote is 81476 USDT. In the past 24 hours, the drop was 1.99%, with a market share of 59.24%, and the fear and greed index is at 69, still in the greedy range. Note that despite a high greed index, prices are falling, which is a divergence signal worthy of caution.
First, let's look at the multi-cycle status. On the daily level, the MA5 is at 82544.67, the MA10 is at 83564.64, and the MA30 is at 82833.18. The current price of 81476 has fallen below all daily moving averages. The daily MACD bar value is negative at 625.71, with DIF at 504.33 and DEA at 1130.05. The DIF has crossed below the DEA and the gap is widening. The daily RSI is at 41.43; although it hasn’t reached the oversold area yet, the direction is clearly downward. The daily chart is in an adjustment pattern, and the bulls need to reclaim 82544 to alleviate pressure.
On the 4-hour level, the MA5 is at 82463.04, the MA10 is at 83127.10, and the MA30 is at 82798.48. The price is similarly operating below all moving averages. The 4-hour MACD bar value is negative at 140.31, with DIF at negative 264.38 and DEA at negative 124.07, indicating that bearish momentum is still being released. The 4-hour RSI is at 33.95, approaching oversold but has not bottomed out yet. The 4-hour structure shows that the downward trend is intact, and the rebound strength is limited.
On the 1-hour level, which is the core reference period of the TPV system, the current 1-hour EMA55 is at 83024.81, and the price of 81476 is far below this line, about 1.87% away. The 1-hour MA5 is at 82230.95, MA10 is at 82420.96, and MA30 is at 83208.57, with the moving averages showing a bearish arrangement. The 1-hour MACD bar value is negative at 142.80, with DIF at negative 390.74 and DEA at negative 247.94, indicating ongoing bearish momentum. However, note that the 1-hour RSI has dropped to 24.81, entering a deeply oversold area, which means a technical rebound may occur in the short term.
On the 15-minute level, the MA5 is at 81551.22, MA10 is at 81847.82, and MA30 is at 82429.62, with the price struggling near the MA5. The 15-minute MACD bar value is negative at 110.48, with bearish momentum present but slowing down. The 15-minute RSI is only 12.92, extremely oversold, and a short-term rebound could be triggered at any moment. However, the 15-minute oversold condition can only lead to a rebound and cannot change the trend.
Now, let's use the TPV system for signal verification. In terms of trend positioning, the current price of 81476 is clearly below the 1-hour EMA55 of 83024.81, falling within the bearish trend area. Short-selling condition verification: First, the price is under pressure below the 1-hour EMA55, with multiple consecutive 1-hour candle closing prices below the EMA55, satisfying the condition. Second, there is a resistance encounter pattern; BTC fell back after peaking at 84254, forming a clear long upper shadow and retreating from an effective high, satisfying the condition. Third, the rebound is weak, with consecutive reductions in the 1-hour MACD bars, and the RSI falling from a high to 24.81, satisfying the condition. All three short-selling conditions are established, and the TPV system gives a clear bearish signal.
Auxiliary data also supports a one-sided judgment. In the past 8 1-hour candles, the closing prices greater than EMA55 occurred only 1 out of 8 times, with two crossovers. The current price's absolute distance from EMA55 is 1.87%, which is far greater than the 0.3% fluctuation threshold. This does not meet the definition of a fluctuating market, indicating that the market is in a one-sided downward trend, and one should not expect repeated fluctuations in a range.
From the on-chain and funding perspective, the fear and greed index of 69 still leans towards greed, but prices continue to drop. This divergence usually indicates that market sentiment has not fully cleared, and further panic selling may follow. The BTC market share is 59.24%, with no significant funds flowing into altcoins, indicating that the market is generally in a defensive state. The SOPR for long-term holders rising to 1.25 is a positive signal, but the formation of a bottom needs time to verify, and one cannot just rely on this indicator to catch the bottom.
In terms of critical defense positions, the first resistance level above is at the 1-hour EMA55 of 83024.81, which is the boundary line for bulls and bears according to the TPV system. Only if the price reclaims and continuously holds above this level for two consecutive 1-hour candles can a trend reversal be considered. The first support level below is at the 81000 integer level; if this is broken, the next target is the psychological level of 80000. Further down, significant support lies in the 79000 to 79500 range, an area of previous concentrated trading.
Trading strategy. Direction: Bearish. Entry conditions: A price rebound to the 82000 to 82300 range, and a long upper shadow or top reversal pattern confirmed on the 1-hour candle indicating resistance, while the MACD bar fails to grow for two consecutive periods, one can enter short. Stop loss: Set about 200 points above 83024, i.e., at 83250 USDT, because if the price stabilizes above EMA55, the bearish logic is invalidated. The first target price: 80500 USDT, the second target price: 79500 USDT. If the price directly breaks below 81000 with increased volume, one can follow the short trend, but stop losses need to be moved up to 81800.
For those wanting to go long, Sister Qinglan must remind that the current TPV system does not support any long operations. Only when the price reclaims the 1-hour EMA55 and satisfies the condition of two consecutive candles closing above it, while also showing a bottom reversal pattern or increased volume with less than a drop can one consider a light-position attempt to go long. Until then, the risk of counter-trend bottom fishing is extremely high.
Risk warning: The Federal Reserve's hawkish expectations and rising oil prices may continue to suppress risk assets; if unforeseen positives cause BTC to quickly soar and break through 83024, the short strategy must immediately stop loss and exit.
Follow Qinglan's crypto classroom to seize more trading opportunities! Welcome to visit the official website www.qinglan.org
📊 Qinglan TPV Trading Strategy Backtesting Reference
🕒 Last backtesting time 10-13 07:00:01
Total analysis: 4370 Backtests: 4363 Accuracy: 77.5% (3380/4363)
免责声明:本文章仅代表作者个人观点,不代表本平台的立场和观点。本文章仅供信息分享,不构成对任何人的任何投资建议。用户与作者之间的任何争议,与本平台无关。如网页中刊载的文章或图片涉及侵权,请提供相关的权利证明和身份证明发送邮件到support@aicoin.com,本平台相关工作人员将会进行核查。


