Two news items this morning are worthy of high attention. First, BNY and Castle Securities have completed their first tokenized U.S. Treasury three-party repurchase transaction, which means that traditional financial giants have taken a substantial step in the field of on-chain settlement, achieving a milestone in the RWA track, and further solidifying the long-term positive fundamentals of the crypto ecosystem. Second, Federal Reserve's Collins has clearly stated that there may be a need for further interest rate hikes within the year to combat inflation, and the rise in interest rate expectations will directly suppress the valuations of risk assets, putting BTC and ETH under pressure from tightening macro liquidity. On one side is the long-term benefit of traditional finance accelerating on-chain, while on the other side is the short-term downside of ongoing monetary policy tightening; amid the intertwining of bulls and bears, the market is in a very delicate game node.
Current Price and Time
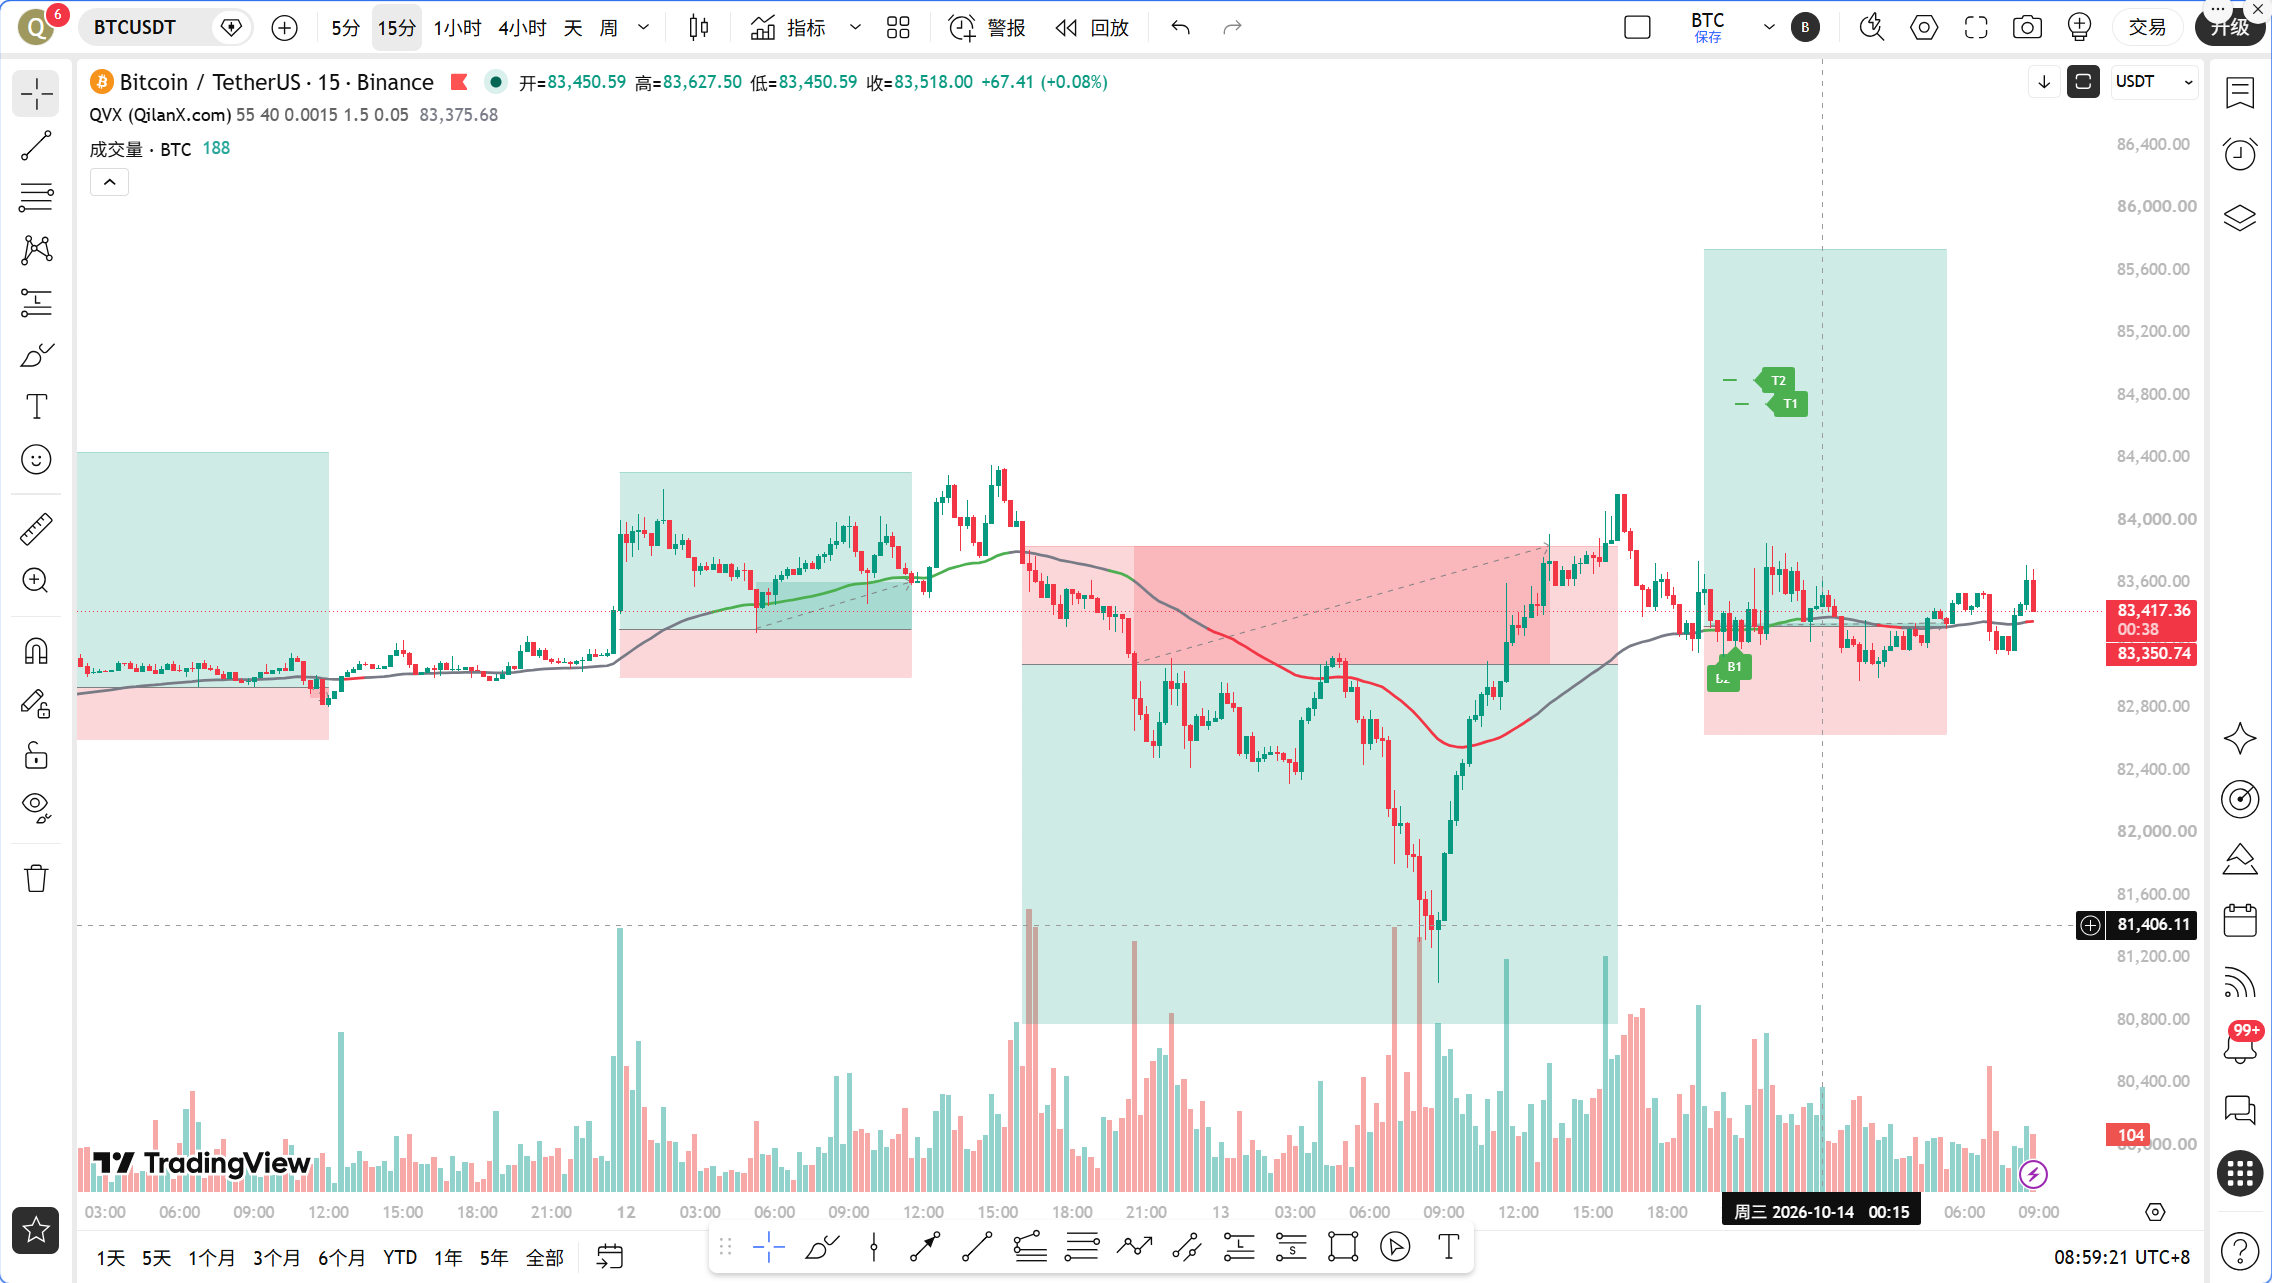
The current date is October 14, 08:59, with the latest price of BTC at 83417 USDT. In the past 24 hours, it has increased by 2.53%, with a BTC market share of 59.21%, and a fear and greed index of 62, indicating a greed range. It is worth noting that although BTC rebounded by 2.53%, ETH/BTC fell below 0.03, reaching a new low for the month at 0.02970, indicating a clear preference for funds concentrated on BTC. Meanwhile, 729 million USD was liquidated across the network in the last 24 hours, with long positions accounting for 592 million, indicating significant losses for bulls during the previous downturn. Although short-term selling pressure has been somewhat released, market sentiment remains weak.
Multi-Period Status Overview
On the daily level, MA5 is at 83039.57, MA10 is at 83422.64, and MA30 is at 83063.87, with the three moving averages tightly entangled in the range of 83000 to 83400. The price of 83417 is right at the vicinity of MA10. In terms of MACD, DIF is at 599.60, DEA is at 1049.98, and the histogram value is negative at -450.38. Both DIF and DEA are above the zero axis but the histogram value remains negative, indicating that daily momentum is still in a diminishing process. The RSI reading is 49.26, in an absolute neutral area, showing a weak directional trend on the daily chart.
On the 4-hour level, MA5 is at 83336.08, MA10 is at 83132.47, and MA30 is at 83128.67, presenting a preliminary bullish arrangement for the moving averages, with the price at 83417 standing above all moving averages. The MACD's DIF is at 2.59, DEA is at -32.80, and the histogram value is positive at 35.38. DIF has just crossed above the zero line, which is a relatively positive signal. The RSI reads 47.96, neutral but slightly weak.
On the 1-hour level, MA5 is at 83412.14, MA10 is at 83344.42, and MA30 is at 83166.41, with the price at 83417 slightly above MA5. The MACD's DIF is at 60.46, DEA at 68.39, and the histogram value is negative at -7.94. Both DIF and DEA are above the zero axis but show a death cross tendency. The negative histogram value indicates that short-term momentum is weakening. RSI is at 52.07, neutral. The 1-hour EMA55 is at 83251.03, which is the core dividing line of the TPV system.
On the 15-minute level, MA5 is at 83411.17, MA10 is at 83383.24, and MA30 is at 83315.09, with the moving averages arranged in a bullish configuration. The MACD's DIF is at 22.38, DEA at 8.70, and the histogram value is positive at 13.68, indicating a slight bullish short-term momentum. The RSI is at 52.42, neutral.
TPV Signal Validation
According to the core rules of the Qinglan TPV system, we will verify each point.
First, the EMA55 bullish-bearish dividing line. The current price of 83417 is greater than the 1-hour EMA55 at 83251.03, positioning the price above EMA55, which indicates a bullish trend area. However, the issue is that among the past 8 one-hour candlesticks, the closing price has been above EMA55 5 out of 8 times, with 3 crossings, and the current price is only 0.20% away from EMA55, below the 0.3% threshold. All three conditions triggered at the same time, the system clearly judges the current situation as a sideways market, neither actively bullish nor bearish, providing only a range.
Second, pattern verification. From the 1-hour candlestick structure, the recent price has been oscillating between 83200 and 83600 without establishing clear long lower shadow bottom formations or long upper shadow top formations. There are also no clear rebound signals after reaching effective lows or highs. The pattern does not support a definitive entry for either side.
Third, momentum verification. The 1-hour MACD histogram value is at -7.94, with DIF and DEA tending towards a death cross, and there have been no signals of downtrend momentum shortening over two consecutive periods. The RSI is at 52.07, neither oversold nor overbought, with no triggering conditions from below 30 rising or from above 70 falling. The 15-minute MACD histogram value is at positive 13.68, indicating a slight bullish trend, but the level is too small to serve as an entry basis for the TPV system.
In conclusion, the TPV system currently signals a sideways market, failing to meet the three conditions for bullishness or bearishness. The core contradiction lies in the price closely sticking to EMA55 and frequently crossing, balancing the bullish and bearish forces, and forcing entry at this time may lead to getting repeatedly knocked back.
On-chain and Funding Situation
The fear and greed index is at 62, in the greed range, but has receded compared to the previous high, indicating a cooling market sentiment. BTC's market share is 59.21%, with funds continuing to concentrate on BTC. ETH/BTC reaching a new monthly low further confirms this trend. Among the 729 million USD liquidated in the last 24 hours, 592 million came from longs, indicating that a large amount of long leverage has been cleared, reducing short-term selling pressure, but also showing that market confidence has been impacted. Glassnode data shows that high-position building costs are still suppressing upward space, yet selling pressure has markedly weakened, suggesting that bottom support is gradually strengthening. BIT-associated addresses have increased their long positions on ETH with 24,000 coins at 20x leverage; large whales are going long on ETH at high leverage, which is a bullish signal worth noting, but high leverage also increases liquidation risk. Circle burned 135 million USDC in a single day, and the supply fluctuation of stablecoins reflects frequent capital flow, with an unclear short-term direction.
Key Attack and Defense Levels
The first upward resistance is in the range of 83600 to 83800, an area that the past 8 one-hour candlesticks have repeatedly touched but failed to hold, also extending to the upper edge near MA10 at 83422 on the daily chart. If the price can break through 83800 with strong volume and close two consecutive one-hour candlesticks above it, there is hope to open up upward space towards 84200 to 84500.
The first downward support is at 83251, which is the position of the 1-hour EMA55. If the price falls below 83251 and closes two consecutive one-hour candlesticks beneath, the sideways pattern may shift to a bearish trend, with the next support seen at the integer level of 83000, followed by the range of 82800 to 82600.
The current price of 83417 is situated right in between support and resistance, in a typical sticking pattern with limited space in either direction.
Trading Strategy
Direction: The current TPV system indicates a sideways market, neither actively long nor short, waiting for signal confirmations to act.
Long Entry Conditions: Three conditions must be simultaneously met. First, the price must close above EMA55 for two consecutive one-hour candlesticks, with a distance from EMA55 exceeding 0.3%, breaking free from the sticking state. Second, a clear support stabilization pattern must occur, such as a long lower shadow, bottom formation, or a rebound with volume after touching an effective low near 83000. Third, the 1-hour MACD histogram must shorten for two consecutive periods, or RSI must rise from below 30, or a bullish engulfing pattern forms. Once all three conditions are met, a long position can be opened at the opening of the next candlestick following confirmation of the closing candlestick.
Short Entry Conditions: Similarly, three conditions must be met simultaneously. First, the price must close below EMA55 for two consecutive one-hour candlesticks, with a distance from EMA55 exceeding 0.3%. Second, a clear pressure resistance pattern must occur, such as a long upper shadow, top formation, or a decline after touching an effective high near 83800. Third, the 1-hour MACD histogram must shorten for two consecutive periods, or RSI must fall from above 70, or a bearish engulfing pattern forms. Once all three conditions are met, a short position can be opened at the opening of the next candlestick following confirmation of the closing candlestick.
Stop Loss Settings: For longs, set a stop loss 50 to 80 USDT below the lowest point of the entry candlestick. For shorts, set a stop loss 50 to 80 USDT above the highest point of the entry candlestick. If the price returns to the other side of EMA55 after entry, regardless of whether the stop loss is reached, consider manually exiting.
Target Levels: For longs, the first target is 83800, the second target is 84200 to 84500. For shorts, the first target is 83000, the second target is 82600 to 82800. Upon reaching the first target, one can reduce the position by half and move the remaining stop loss to near the entry price.
Risk Warning
The rising expectations of the Federal Reserve's interest rate hikes, coupled with warnings of a peak in US stocks, maintain high macro uncertainty. During the sideways range, avoid chasing high and cutting losses. Strictly wait for the three conditions of the TPV system to resonate before taking action.
Follow Qinglan Crypto Classroom to grasp more trading opportunities! Welcome to visit the official website www.qinglan.org
📊 Qinglan TPV Trading Strategy Backtest Reference
🕒 Last Backtest Time 10-14 07:00:01
Total Analysis: 4394 Backtests: 4387 Accuracy Rate: 77.4% (3396/4387)
免责声明:本文章仅代表作者个人观点,不代表本平台的立场和观点。本文章仅供信息分享,不构成对任何人的任何投资建议。用户与作者之间的任何争议,与本平台无关。如网页中刊载的文章或图片涉及侵权,请提供相关的权利证明和身份证明发送邮件到support@aicoin.com,本平台相关工作人员将会进行核查。