In the cryptocurrency market, obtaining data is not difficult; the real challenge is how to integrate the scattered information.
To understand the development scale of RWA, one needs to look at asset data; to track popular trading targets, one needs to pay attention to market trends and trading volumes; to compare the performance of contracts across different exchanges, one also needs to examine funding rates, spreads, and open interest.
Different research needs often mean switching back and forth between multiple platforms.
AiPlot aims to integrate global tokenized asset data, market trends, and trading analysis tools, allowing users to discover market changes more efficiently.
If you are focusing on RWA, cryptocurrency assets, gold, silver, and other trading targets, or if you wish to establish your market observation system, you may want to get to know AiPlot.
Official website: https://aiplot.com/
1. Global Market Overview: First, Understand the Stage of RWA Market Development
RWA (Real World Assets, tokenization of real-world assets) is becoming an important direction for the integration of traditional finance and blockchain.
But to understand this market, merely looking at news and project promotions is not enough. How large is the asset scale? What positions do different categories occupy? How does the supply of stablecoins change? Has the number of holders of tokenized assets increased?
These questions all require data to assist in judgment.
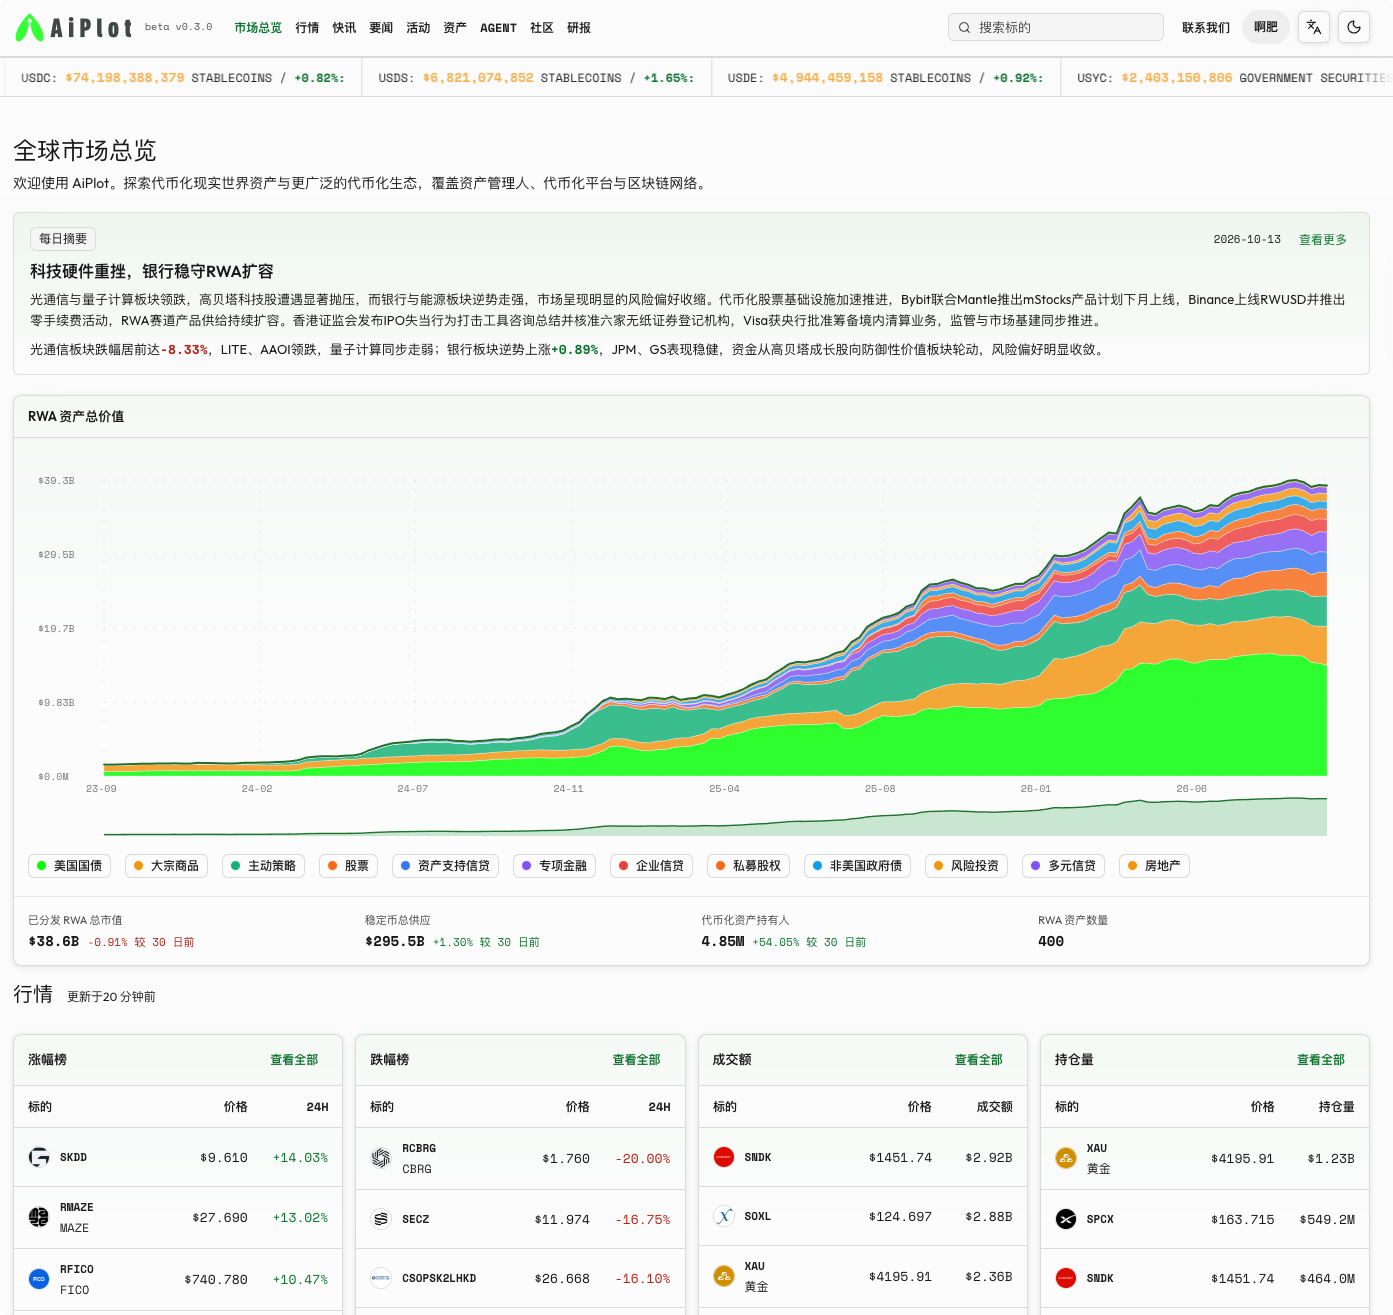
AiPlot's "Global Market Overview" consolidates multiple key indicators, including:
- Total Value of RWA Assets: Observing the overall scale of tokenized real-world assets and their historical changes.
- Stablecoin Supply: Tracking the supply data of various stablecoins to assist in observing on-chain dollar liquidity.
- Holders of Tokenized Assets: Understanding the scale and changes in holders of relevant assets.
- Number of RWA Assets: Observing the coverage of tokenized assets within the platform’s statistical scope.
- Daily Market Summary: Quickly understanding noteworthy market events and industry dynamics for the day.
Among these, historical asset scale charts are particularly suitable for observing long-term trends. Continuously tracking scale changes is more helpful than looking at data from just one day when trying to understand the development process of RWA.
It is important to note that an increase in asset scale does not equate to an increase in asset prices, nor does it directly represent investment returns. Analyzing in conjunction with asset categories, issuers, and specific market environments will lead to a more accurate understanding of the data.
2. Market Center: Not Just Price Changes, but Also Trading Volume and Open Interest Changes
If the global market overview helps users understand the industry, then the market center is more suitable for daily observations of specific trading targets.
From AiPlot's market page, users can see that the platform supports market information of various categories and provides multiple observation dimensions.
1. Gainers and Losers List
There are different hotspots in the market every day.
Through the gainers and losers list, users can quickly identify recently volatile targets and further research their price changes and the market factors behind them.
This is an efficient initial screening method for traders who need to track market hotspots.
2. Trading Volume and Market Activity
Price changes do not fully reflect market conditions.
Observing trading volume can help users understand the trading activity of a specific target and further assess whether price fluctuations correspond with significant changes in trading volume.
3. Open Interest and Unsettled Contracts
In the derivatives market, open interest (OI) is one of the indicators worth paying attention to.
It reflects the scale of contracts that remain open in the market and can be used in conjunction with prices, trading volumes, and other indicators to assist in analyzing market participation.
However, an increase in open interest does not necessarily mean a price increase; it also needs to be assessed alongside the trading behaviors of both long and short positions and market conditions.
Through this data, AiPlot not only helps users discover price changes but also provides more clues for further market analysis.
3. Cross-Exchange Contract Data: In-Depth Observation of Funding Rates and Spreads
For users frequently monitoring perpetual contracts, data from a single exchange may sometimes be insufficient.
There may be price differences, funding rate disparities, and liquidity differences across different exchanges. Observing these indicators together can help users identify market phenomena worth further research.
AiPlot's contract market page displays relevant data from multiple trading venues, mainly including the following dimensions.
1. Reference Price and 24-Hour Price Change
Through reference prices and price changes, users can quickly understand the current performance of the target and compare quotes from different trading venues.
2. Cross-Exchange Spread
The cross-exchange spread reflects the price differences between different trading venues.
When the spread widens, it may indicate changes in market volatility, liquidity, or trading conditions. For users researching cross-exchange trading opportunities, this is a data point worthy of attention.
However, it should be noted that observing a spread does not guarantee that arbitrage can be executed. Actual trading also involves factors such as transaction fees, slippage, funding transfer costs, execution speed, and trading restrictions.
3. Funding Rates
Perpetual contracts typically use a funding rate mechanism to maintain a certain connection between the contract price and the underlying asset price.
Comparing funding rates across different exchanges can help users understand the contract pricing conditions in each market and the possible funding fees associated with holding corresponding positions.
A positive or negative funding rate should not be solely used as a basis for buying or selling.
4. 24-Hour Trading Volume and Open Interest
Trading volume can reflect the activity level of trades over a certain period, while open interest reflects the scale of contracts that have not been settled.
Combining these with price changes, funding rates, and cross-exchange spreads can build a more comprehensive framework for contract market analysis.
For contract traders, what is truly valuable is not a single isolated number but the relationship between different indicators.
By concentrating these dimensions, AiPlot helps reduce the cost of switching back and forth between different market pages.
4. From Stocks, Commodities to Digital Assets: Broadening Market Observation Scope
Market opportunities do not solely exist within a single asset class.
In addition to cryptocurrency assets, gold, silver, and stock-related targets are also the focus of many traders.
From AiPlot's market screenshots, it can be seen that the platform’s market list includes categories like stocks and commodities, showcasing prices, price changes, trading volumes, and open interest for relevant targets.
This allows users the opportunity to observe different types of market targets on the same platform rather than limiting all research to a single type of asset.
For example:
- Users interested in gold can track the price performance and trading situation of relevant targets.
- Users focused on stock-related trading products can observe price changes and market activity.
- Users following cryptocurrency derivatives can further analyze trading volume, open interest, and funding rates.
It is particularly important to note that different targets may correspond to different trading products, quoting mechanisms, and trading venues. The presence of relevant targets on the page does not mean users can directly trade the native assets in traditional markets; the actual product nature should be based on specific market explanations.
5. Market News and Research: Beyond Data, Understanding the Reasons for Changes
Market data can tell us what has happened, but to further understand why it happened, one needs to combine news, industry background, and research content.
AiPlot also provides access to market news, headlines, events, community, research, and Agent sections, offering users pathways to further acquire market information and explore platform functionalities.
For those who regularly pay attention to the market, one can first discover anomalies through market lists and then combine market information to understand possible influencing factors.
For users researching RWA, they can start with asset scale and categorization and then further understand related projects, issuers, and industry dynamics.
This method, which discovers issues through data and then looks for clues through information and research, is more helpful for forming one’s analytical framework than simply chasing hotspots.
The specific content and capabilities provided by each section are based on the actual functions available on the AiPlot website.
6. Who Should Consider Adding AiPlot to Their Daily Research Toolbox?
RWA Researchers
If you want to understand the scale of tokenized assets, asset categories, and market developments, starting from the global market overview is advantageous.
Cryptocurrency Market Traders
Users needing to observe price changes, trading volumes, funding rates, cross-exchange spreads, and open interest can utilize the market center for daily market tracking.
Cross-Market Observers
Users who wish to simultaneously focus on digital assets, commodities, and stock-related targets can use different market categories to expand their observation scope.
Content Creators and Industry Practitioners
When producing market analysis, writing industry articles, or conducting project research, AiPlot can serve as an auxiliary tool for data discovery and information organization.
7. Conclusion: Starting Market Research with Data
Whether it's the long-term development of RWA or the short-term fluctuations in the cryptocurrency market, truly valuable research relies on continuous observation.
Asset scale, price, trading volume, funding rates, open interest, and market information each reflect different aspects of the market. Only by analyzing this information in the appropriate context can we better understand what is happening in the market.
AiPlot consolidates global market overviews, tokenized asset data, market lists, cross-exchange contract indicators, and market information into one platform, providing users with a more convenient entry point for market observation.
If you are looking for a platform to assist in tracking RWA, observing multi-category market trends, and researching contract data, you can personally experience AiPlot.
AiPlot: From asset data to market trends, making every research effort verifiable.
Official website: https://aiplot.com/
免责声明:本文章仅代表作者个人观点,不代表本平台的立场和观点。本文章仅供信息分享,不构成对任何人的任何投资建议。用户与作者之间的任何争议,与本平台无关。如网页中刊载的文章或图片涉及侵权,请提供相关的权利证明和身份证明发送邮件到support@aicoin.com,本平台相关工作人员将会进行核查。