This weekend's market is not calm. Looking at two pieces of news together, the flavor is very complex: on one hand, Bitcoin has dropped below $80,000, with $812 million liquidated across the network in 24 hours, and large-scale long liquidations have intensified selling pressure; on the other hand, renowned trader Arthur Hayes continues to sell $28.81 million worth of altcoins, clearing out to watch. The combination of these two events has depressed short-term sentiment. At the same time, there is also a piece of positive news that is easy to overlook: Strategy and other treasury companies have financed preferred stock to buy 136,000 Bitcoins, and the U.S. spot Bitcoin ETF saw a net inflow of $301.2 million this week, with BlackRock's IBIT leading. Sister Qinglan's judgment is that the short-term selling pressure is real, the mid-term buying is also real, the question is where the price stands at this moment. This brings us back to the framework of the TPV system, letting data do the talking.
Current Price and Time
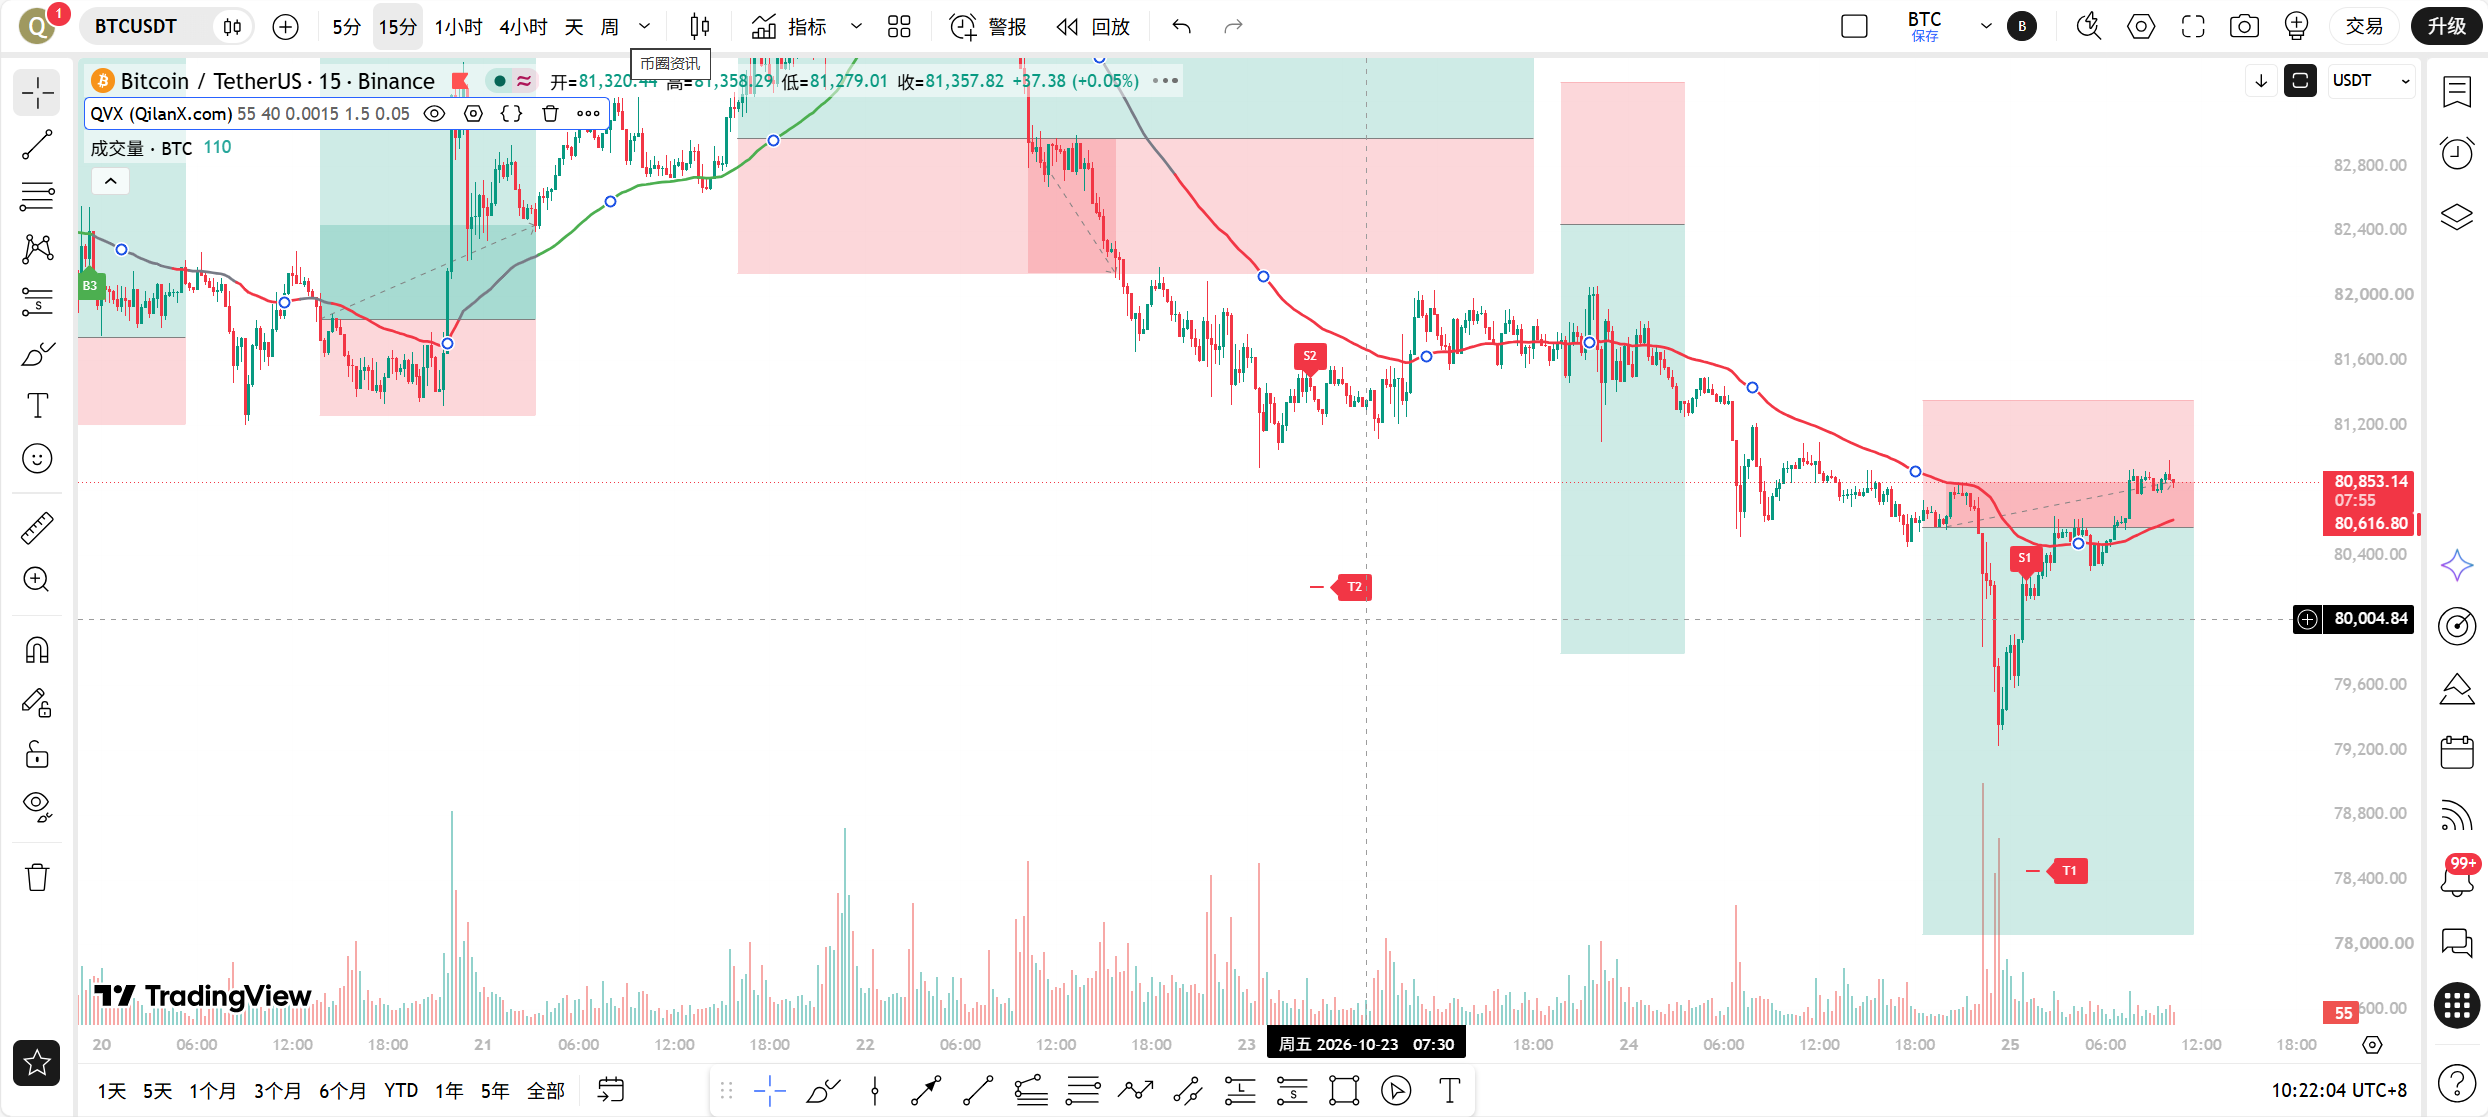
As of October 25th, 10:22 AM, BTC price is 80853 USDT, with a 24-hour change of 0.02%, almost flat, but the fluctuations during the process are evidently significant. The Fear and Greed Index is at 54, in the neutral range, indicating market sentiment has pulled back a bit from the edge of panic, but it cannot be considered optimistic yet. BTC market share is at 59.47%, indicating that funds are concentrating towards Bitcoin, which usually occurs during periods of reduced risk appetite. Sister Qinglan's crypto class has always emphasized that price consolidation does not mean structural consolidation; let's break it down by cycle.
Overview of Multi-Cycle States
First, let's look at the daily chart. MA5=81688.05, MA10=81862.95, MA30=83124.68, all three moving averages are above the current price and present a bearish arrangement. In terms of MACD, DIF=-253.46, DEA=47.33, histogram=-300.79, with DIF below the zero axis and forming a significant negative value gap with DEA, downward momentum at the daily level is still being released. RSI=38.08, close to the weak zone but not yet in the oversold territory. The conclusion for the daily chart is very clear: bearish trend area, and any rebound is of a corrective nature.
Now let's look at the 4-hour chart. MA5=80526.71, MA10=80850.73, MA30=81968.11. The current price of 80853 is just around MA10, slightly above MA5, but is significantly suppressed by MA30. In terms of MACD, DIF=-483.85, DEA=-402.04, histogram=-81.81, the histogram is negative but not very large in absolute terms, indicating that the 4-hour downward momentum has somewhat converged compared to the previous period, but DIF is still below DEA, showing no golden crossover. RSI=42.08, neutral but slightly weak. The 4-hour chart is a typical lower-level consolidation structure after a decline, with no change in direction.
The 1-hour chart is the core cycle of the TPV system. MA5=80825.23, MA10=80636.94, MA30=80693.39, the short moving averages are starting to entangle and flatten, with the current price slightly above MA5. The key is that EMA55=81203.10, and the current price of 80853 is about 350 points below it, a margin of 0.43%. On this side, MACD shows DIF=-72.26, DEA=-171.39, and histogram=99.13 which is positive, this is the only significant positive signal at the 1-hour level, indicating that short-term downward momentum is indeed exhausting. RSI=51.45, returning to near the middle axis. The state of the 1-hour chart is: momentum is recovering, but price is still pressured by EMA55.
The 15-minute chart is the most sensitive. MA5=80860.38, MA10=80850.80, MA30=80650.35, the moving averages are in a bullish arrangement, with the current price above the cluster of moving averages. However, MACD shows DIF=114.26, DEA=114.79, histogram=-0.53, recently forming a death cross, RSI=67.20 pulling back from a high position. The 15-minute chart indicates: short-term upward momentum is beginning to dull after a rise, making the cost-performance ratio of chasing long positions decrease.
TPV Signal Verification
Check the three buy conditions of the TPV system one by one. First, the price must stabilize above the 1-hour EMA55, requiring two consecutive 1-hour candles to close above EMA55. The current price of 80853 is below EMA55's 81203.10, and additional data clearly show that in the past 8 1-hour candles, the closing price above EMA55 has been 0/8, with 0 crosses. This condition is completely unmet and is a hard miss.
The second condition is a stable support pattern. On the 1-hour level, we currently see the short moving averages flattening, and the price oscillating between 80600 and 80900, showing some signs of stop-loss, but there are no clear long lower shadows, bottom formations, or effective signals of increasing volume and stagnation; it can only be counted as preliminary stabilization, not constituting confirmation.
The third condition is that downward momentum is exhausting. This is partially met: the 1-hour MACD histogram is positive at 99.13, which indicates that the momentum repair from green to red is occurring, and RSI's recovery from a low position to 51.45 also aligns with rebound characteristics. However, note that momentum exhaustion is just an auxiliary condition for going long, it cannot replace the trend condition.
Among the three points, the first condition is a hard injury, the second condition is unconfirmed, and the third condition is partially met. The conclusion is very clear: the current market does not present a buy signal as defined by the TPV system, the price is in a rebound repair phase within the bearish trend area. Looking at the volatility assessment, the closing price of the past 8 1-hour candles above EMA55 has been 0, with 0 crosses, and the distance from the price to EMA55 is 0.43%, greater than the 0.3% threshold, inconsistent with the definition of a volatile market; the system determines it to be a unilateral trend, that is, a bearish unilateral. This point is crucial, meaning that we should not treat it with the mindset of high-selling and low-buying, but respect the direction of the trend.
On-chain/Funding Situation
The funding situation shows a clear tearing between bulls and bears. On the bearish side: the Coinbase Bitcoin premium index has been negative for 31 consecutive days, and buy-side volume in the U.S. market continues to be weak, which is direct evidence of low institutional demand; the funding rate is neutral but slightly bearish, with market sentiment cautious; whales holding 93,000 ETH longs are approaching the liquidation line, under pressure with a $214 million position, and any further drop in ETH could trigger passive selling, while ETH has already dropped below 2300 USDT, down 4.23% in 24 hours, with the breach of key support dragging down the overall market. Additionally, the Electrum high-risk vulnerability has been exploited, requiring urgent upgrades for versions prior to 4.8.3; such security incidents may weaken users' confidence in self-custody, representing a latent bearish sentiment.
On the bullish side: the ETF has net inflows of $301.2 million this week, with BlackRock's IBIT leading, which is real incremental capital; treasury companies financed with preferred stock to buy 136,000 BTC, reducing circulating supply from institutions, indicating clear mid-to-long term support. Macro-wise, the probability of the Federal Reserve raising interest rates in October is only 10%, with short-term inaction favoring risk assets, but expectations for rate increases in December are heating up, creating pressure at the far end.
Sister Qinglan's interpretation is: the ETF and treasury companies' buying are slow variables, providing support but not urgent relief; the consecutive negative Coinbase premium and liquidation density area are fast variables, determining short-term direction. Fast variables currently hold the upper hand.
Key Attack and Defense Levels
The first line of defense above is the 1-hour EMA55 at 81203 USDT, which is the dividing line of the TPV system for bulls and bears. If the price cannot stand on it, any rebound can only be defined as a repair. Once it stands above, the second barrier is the 4-hour MA30 at 81968 USDT, and above that, the daily MA5 at 81688 and MA10 at 81862 form a dense moving average band, which is the first target area for bearish short-covering, and also where the bulls need to prove themselves.
The first support below is seen at the 4-hour MA5 at 80526 USDT, marking the recent low consolidation bottom. More critically, the level of 79000 USDT, as news has pointed out, falling below 79,000 risks triggering the liquidation of $855 million in long positions, creating a liquidation density area; once this is broken, it could trigger a chain liquidation magnifying the drop. Therefore, 79000 is not a normal support level, but the boundary of a danger zone.
Trading Thoughts
Direction: Bearish trend area, the main idea is to short on rebounds, not actively bottoming long.
Entry Conditions: Wait for the price to rebound to near the 1-hour EMA55 at 81203 USDT, and signal of pressure appears, specifically looking for the 1-hour candlestick to produce a long upper shadow or a top formation, while the MACD histogram contracts for two consecutive periods or RSI falls back from a high position; only when these three resonate, enter to short. If the price directly surges and stabilizes above EMA55 and continuously closes two 1-hour candles above it, then abandon the short idea and observe, waiting for a pullback confirmation before reassessing long positions, do not chase.
Stop Loss: After entering, set the stop loss approximately 1.2% to 1.5% above EMA55, which is in the range of 82300 to 82400 USDT, allowing sufficient room for false breakouts; if it breaks, admit the mistake and exit.
Target Levels: The first target is around 80500 USDT, corresponding to the 4-hour MA5 support; the second target is 79500 USDT, approaching the upper boundary of the liquidation danger zone; if 79000 is broken with volume, look for around 78500 USDT, but do not linger, take profits in batches.
In terms of position management, following Sister Qinglan's crypto class old rule, the risk of a single trade should not exceed 2% of total funds; near the liquidation density area, volatility increases, it’s better to earn less than to over-leverage.
Risk Warning
If ETF buying suddenly surges or unexpected macro bullish news appears, and the price quickly recovers above EMA55 and stabilizes, the bearish structure will immediately fail, be sure to strictly implement stop losses, do not hold on to positions.
Follow Sister Qinglan's crypto class for more trading opportunities! Welcome to visit the official website www.qinglan.org
📊 Qinglan TPV Trading Strategy Backtest Reference
🕒 Last Backtest Time: 10-25 07:00:02
Total Analysis: 4643 Backtests: 4635 Accuracy: 77.4% (3588/4635)
免责声明:本文章仅代表作者个人观点,不代表本平台的立场和观点。本文章仅供信息分享,不构成对任何人的任何投资建议。用户与作者之间的任何争议,与本平台无关。如网页中刊载的文章或图片涉及侵权,请提供相关的权利证明和身份证明发送邮件到support@aicoin.com,本平台相关工作人员将会进行核查。