Looking back at this market on October 22, 2026, all prices, positions, and orders correspond to the observation point at that time.
BTC has been quite exciting these two days: first jumping from 81,000 to 84,800, but then turning around and dropping back to around 82,500.
Many friends are asking: who is pushing this wave, and who is crashing it? Can it still rise afterwards?
Today, we won't guess; let's directly look at on-chain data — let's see what these historical profit addresses on Hyperliquid have been doing these two days.
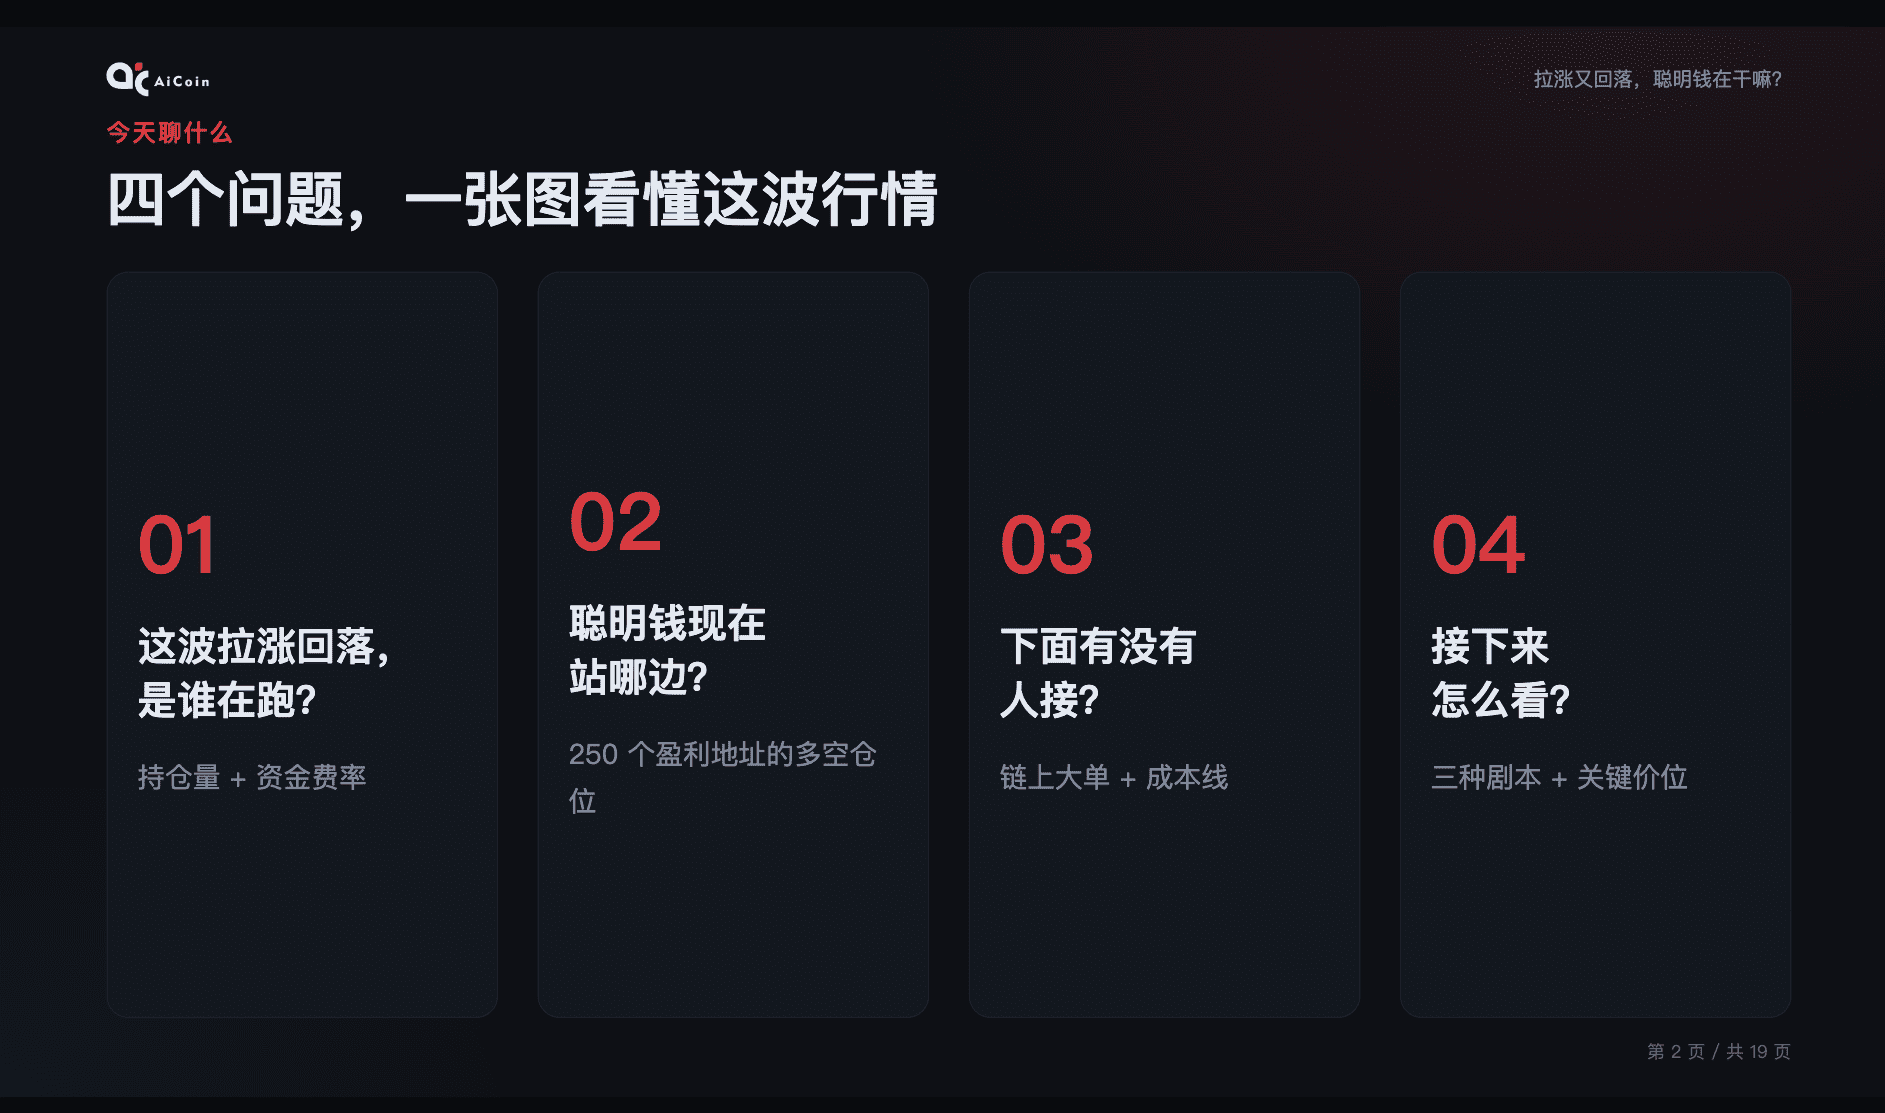
Today we'll discuss four questions.
First, who is running amid this upward rise and subsequent fall? We'll look at the open interest and funding rates.
Second, which side is smart money currently on? I filtered 250 truly profitable addresses on Hyperliquid to observe their long and short positions.
Third, are there buyers waiting below? We'll look at large orders on-chain, then check the cost line of smart money.
Fourth, how should we proceed next? I will present three scenarios and several key price levels.
First, let me explain where today's data comes from: The on-chain contract data from Hyperliquid can be used to observe address positions and opening and closing records, providing an additional layer of clues about capital behavior compared to merely looking at prices. It reflects the situation on this platform and the selected addresses and cannot directly represent the entire market.
Let’s briefly review the trend.
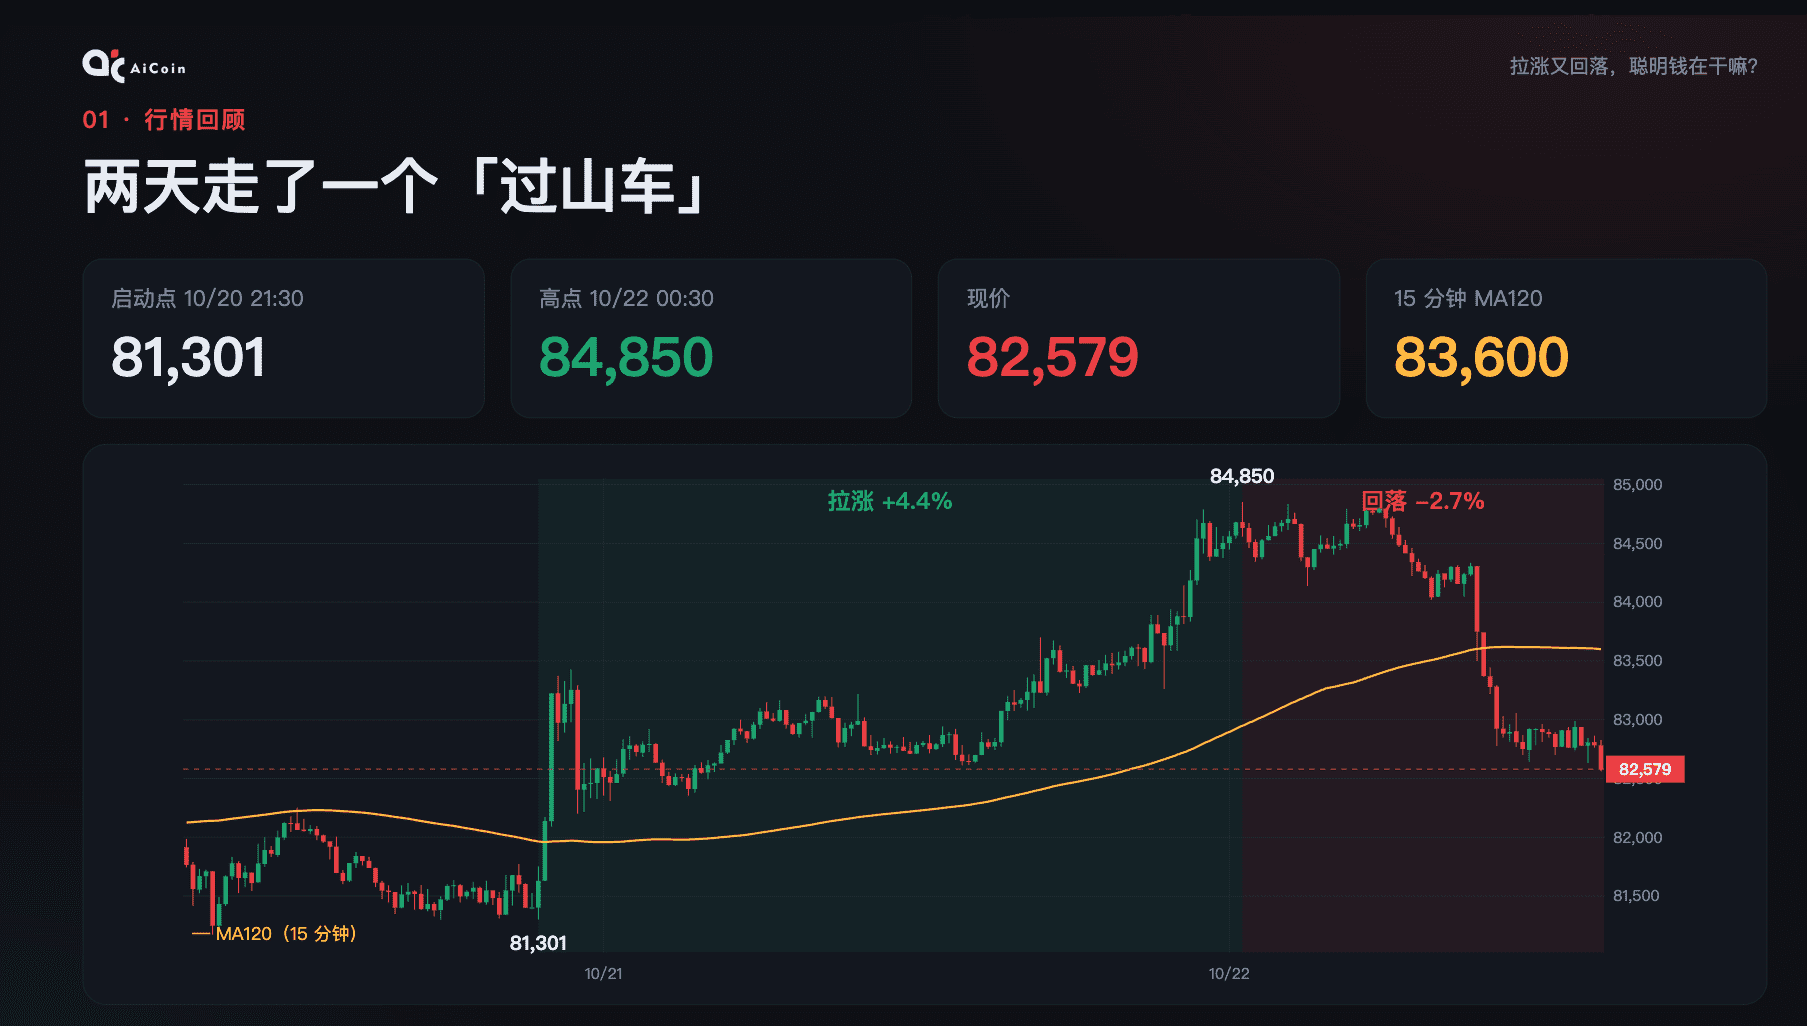
At 9:30 PM on October 20, BTC started at around 81,300, climbing to about 84,800 by 12:30 AM today, gaining 4.4%.
However, the good times didn’t last – around 10 AM today, a large bearish candle came down, bringing it back to approximately 82,500, a drop of 2.7% from the peak.
Take note of this yellow line; it is the MA120 at the 15-minute level, currently around 83,600. The price has already fallen below it; this position will be referred to repeatedly, so remember it.
So, who is pushing and who is running with this wave? The first thing to look at is the open interest, which is OI.
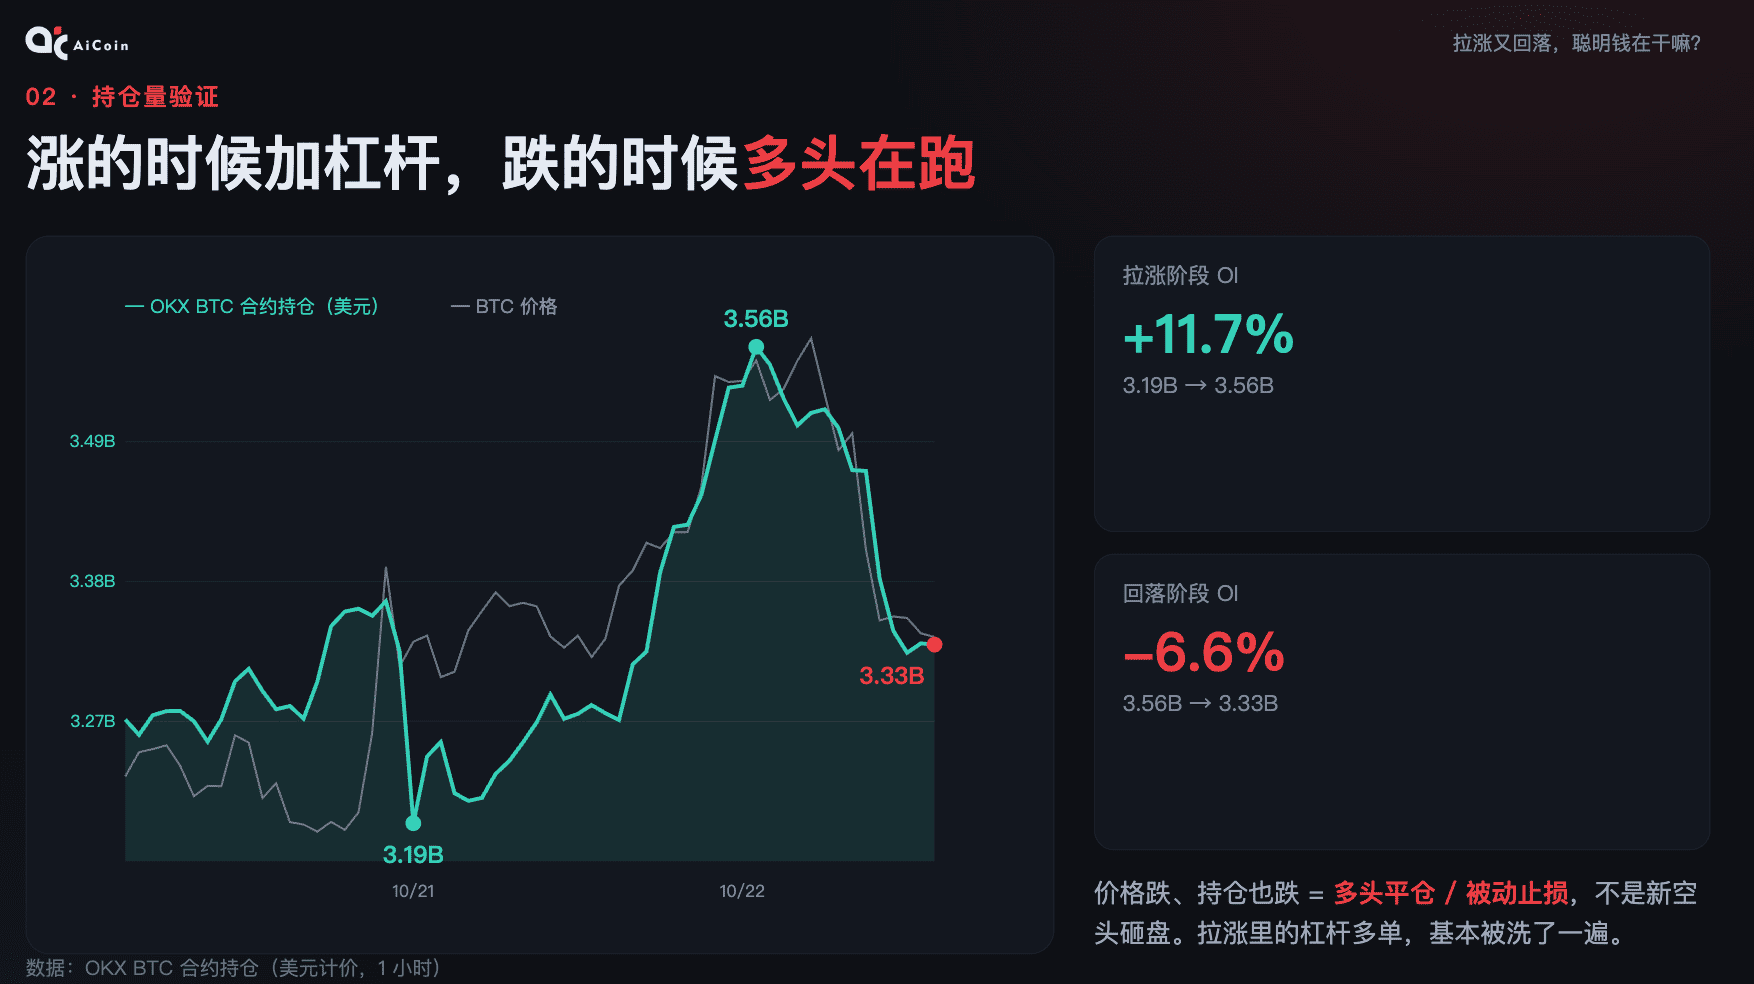
During the rise, open interest went from 3.19 billion to 3.56 billion, increasing by nearly 12%. The price and OI both rose, indicating an increase in open positions; combined with the rising process, signs of chasing leverage can be observed, but OI alone cannot determine which side initiated the opening.
What about during the pullback? The open interest dropped from 3.56 billion to 3.33 billion, a decrease of 6.6%.
The price and OI both fell, indicating a contraction of positions. Coupled with the subsequent opening and closing records, I prefer to interpret this pullback as long positions closing with stop losses involved, rather than excluding new shorts solely based on OI.
This suggests that the previously accumulated leverage has been released, but we cannot assume that all long positions have been cleared.
With leverage down, the market has less crowd pressure, but whether it can rise later will still depend on actual buying.
Next, let's check the funding rates, which can reflect the enthusiasm for chasing longs.
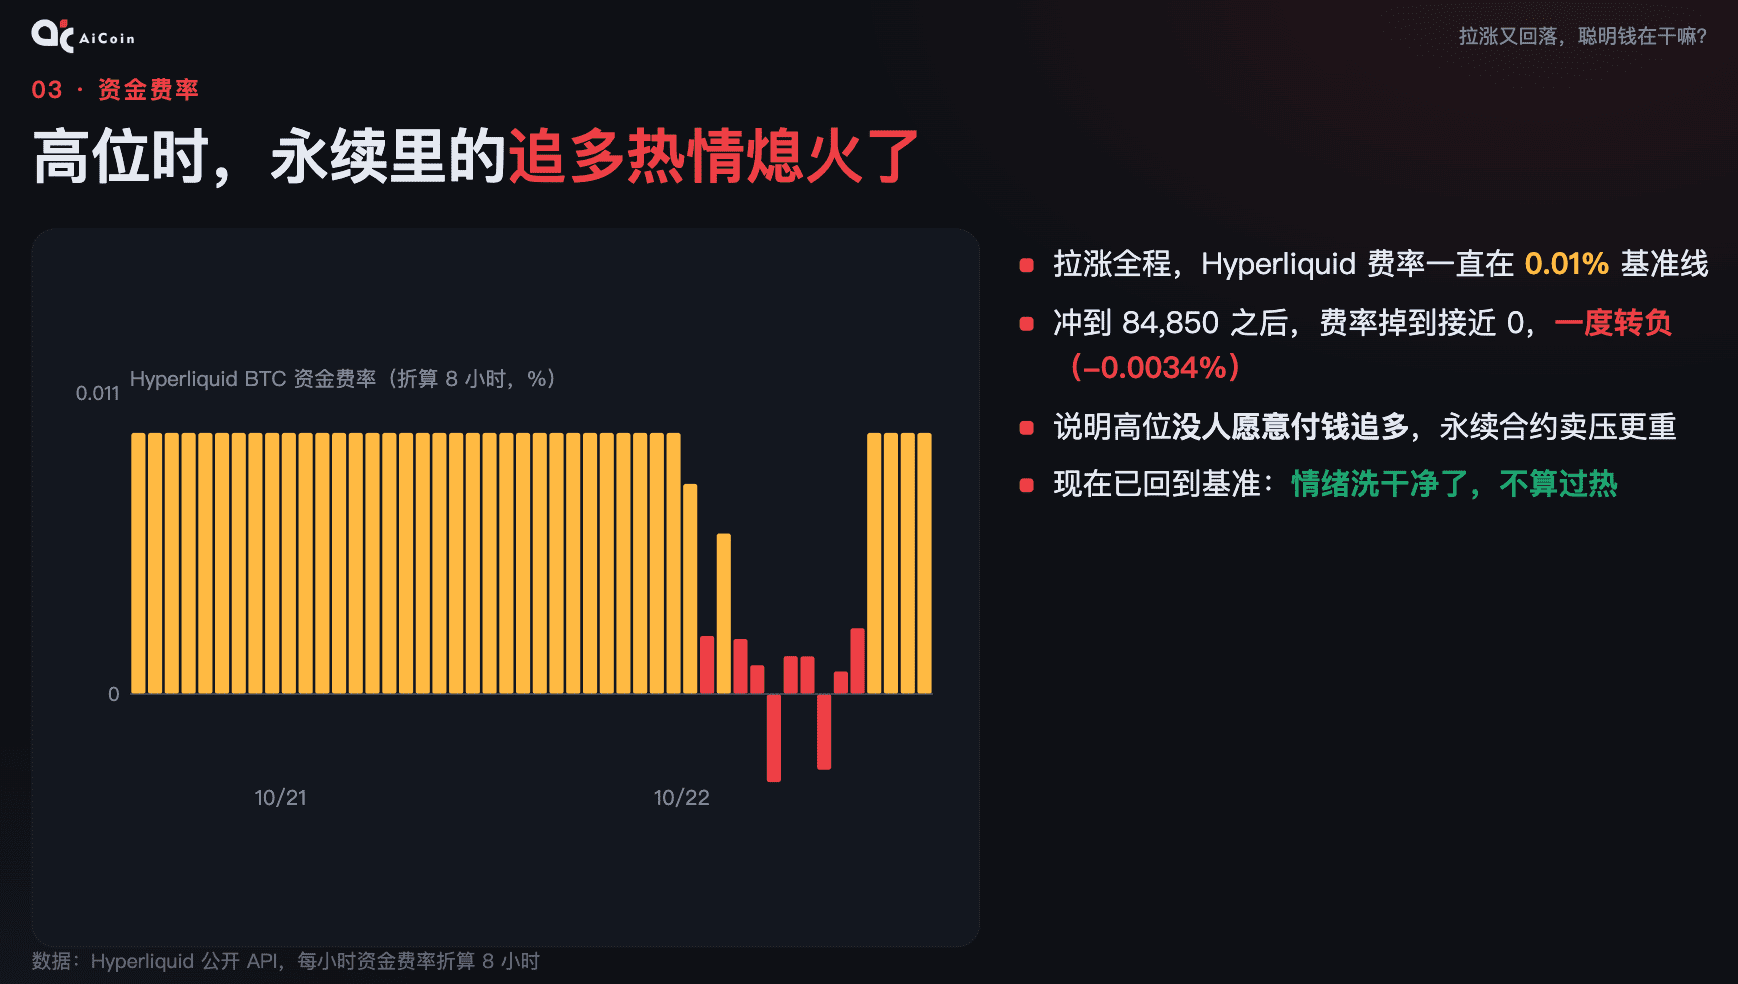
During the entire process of the rise, Hyperliquid's rate remained stable at the 0.01% baseline.
However, after soaring to 84,800, the rate suddenly dropped close to zero, even turning negative for a time.
This suggests that enthusiasm for chasing longs at high positions may be waning, and we still need to combine it with price and transaction confirmations.
The good news is that the rate has now returned to 0.01%; this shows that sentiment has returned to a relatively mild level, and should not be viewed as a reversal signal on its own.
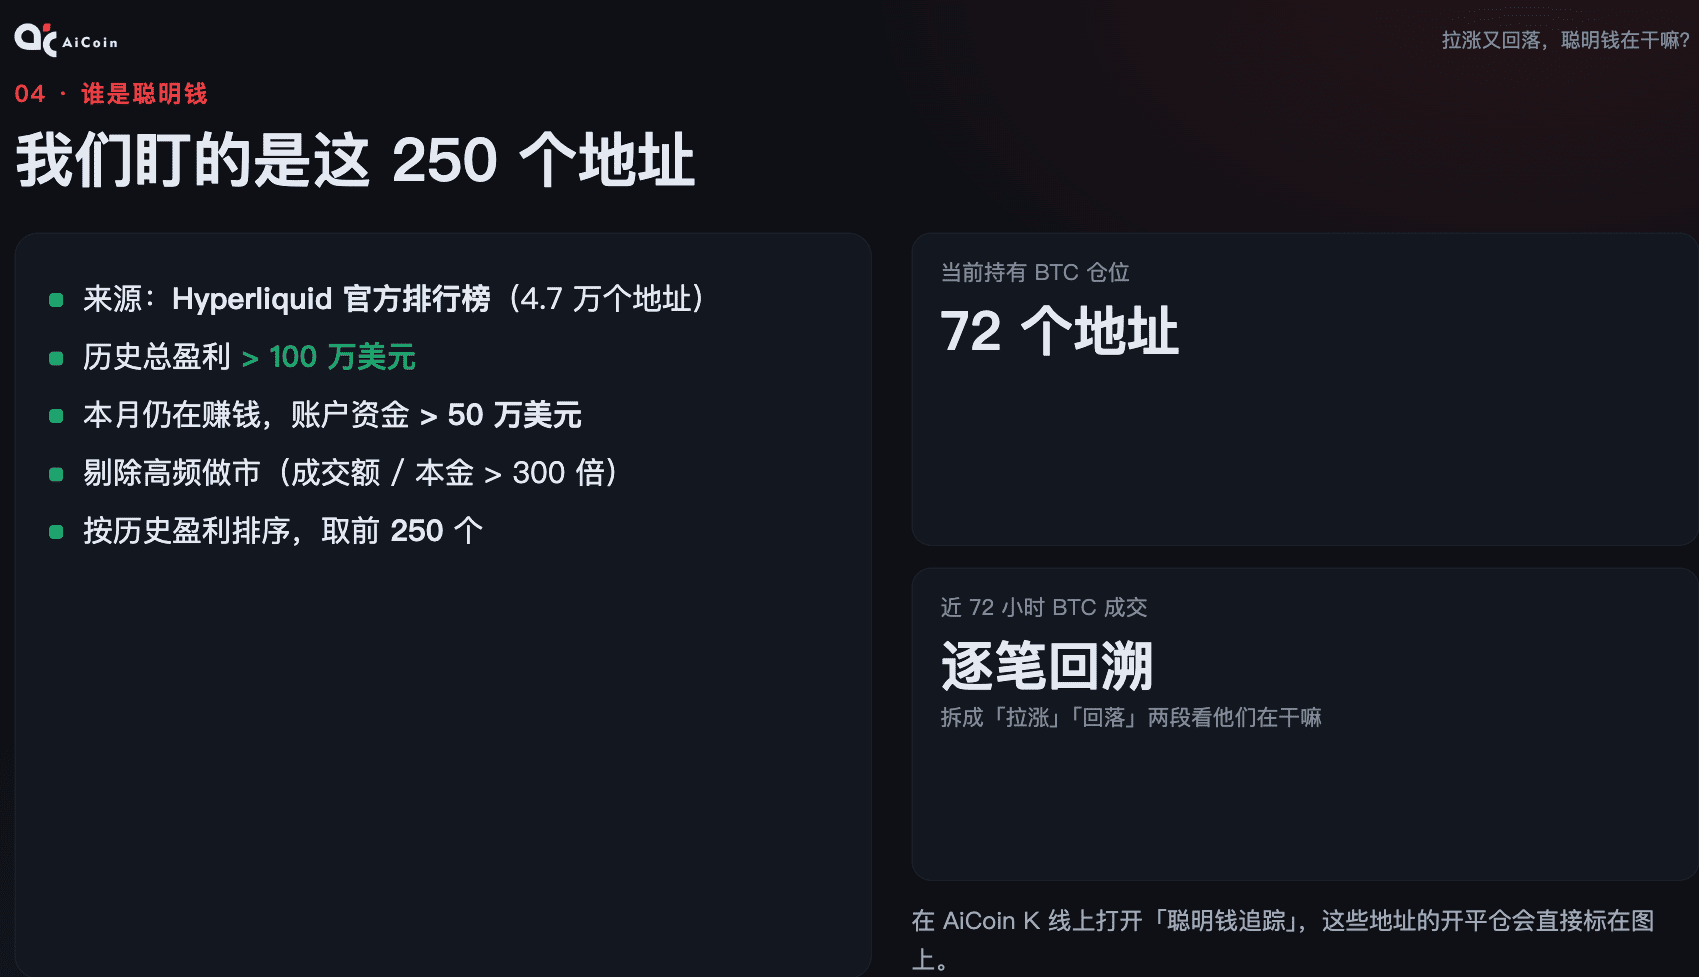
What is smart money? I filtered it this way: from Hyperliquid's official leaderboard of 47,000 addresses, I selected those with a historical total profit exceeding one million dollars, still making profits this month, and having at least five hundred thousand dollars in their accounts.
I then removed those market makers making high-frequency trades throughout the day and ranked the remaining by profit, taking the top 250. It's important to note that this is just a sample I've selected and does not represent all market funds; this type of profitable address can also have losses.
Among these 250 addresses, 72 currently hold BTC positions.
I reviewed every BTC transaction they made over the last three days, dividing them into "upswing" and "pullback" segments to see what they have been doing.
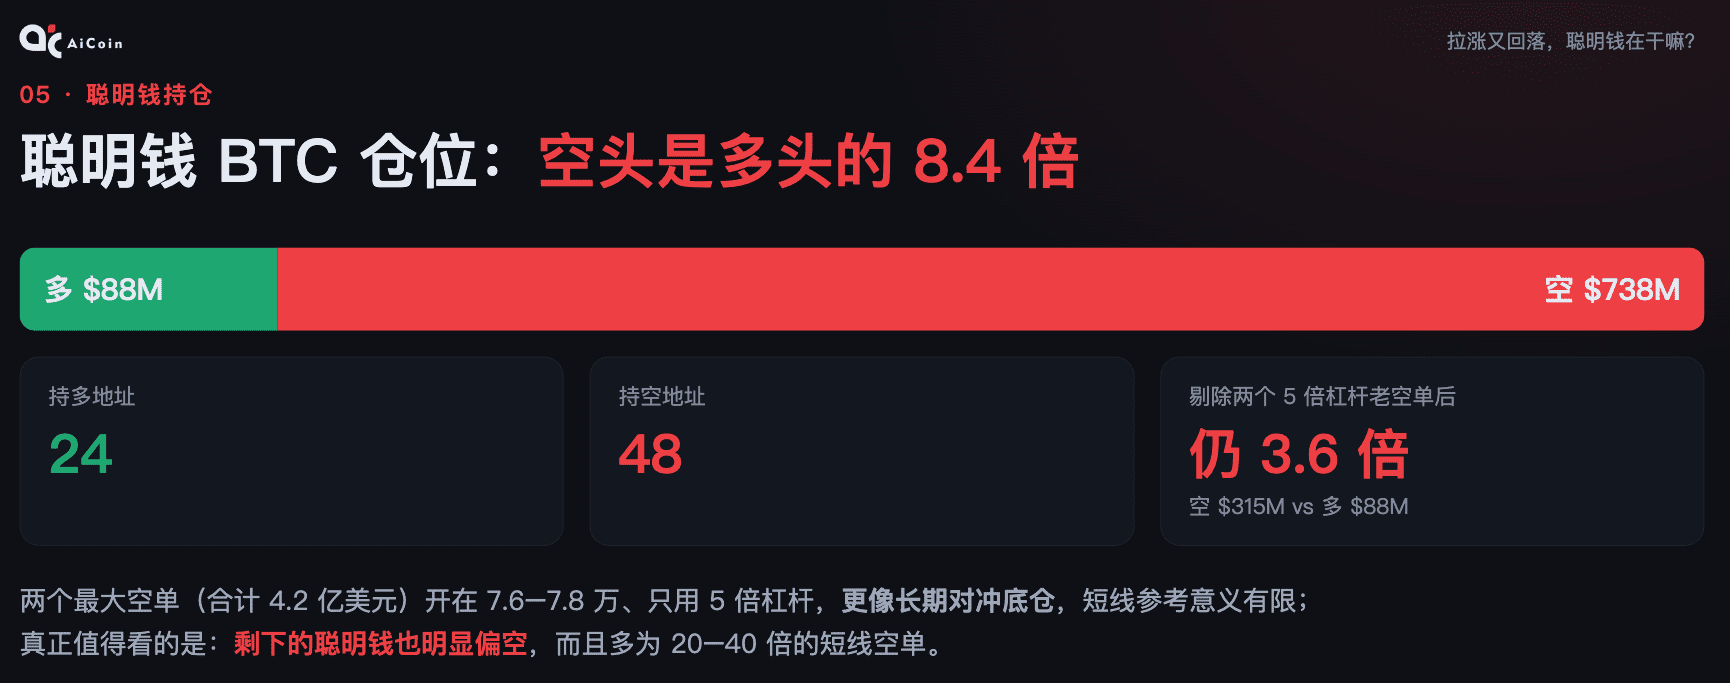
First, looking at the results, it might be a bit shocking: smart money holds a total of 738 million dollars in shorts and only 88 million in longs, with shorts being 8.4 times the longs.
There are 48 addresses holding shorts and only 24 holding longs.
However, don't rush to conclusions. There are two super big holders here, with shorts totaling 420 million dollars, opening positions at 76,000 to 78,000, and using only 5 times leverage; this is more like a long-term hedge position, with less short-term relevance.
If we remove these two and look again: shorts at 315 million, longs at 88 million, are still 3.6 times.
Moreover, the remaining shorts mostly consist of short-term positions of 20 to 40 times leverage. Thus, the conclusion is clear: this sample of smart money is generally bearish.
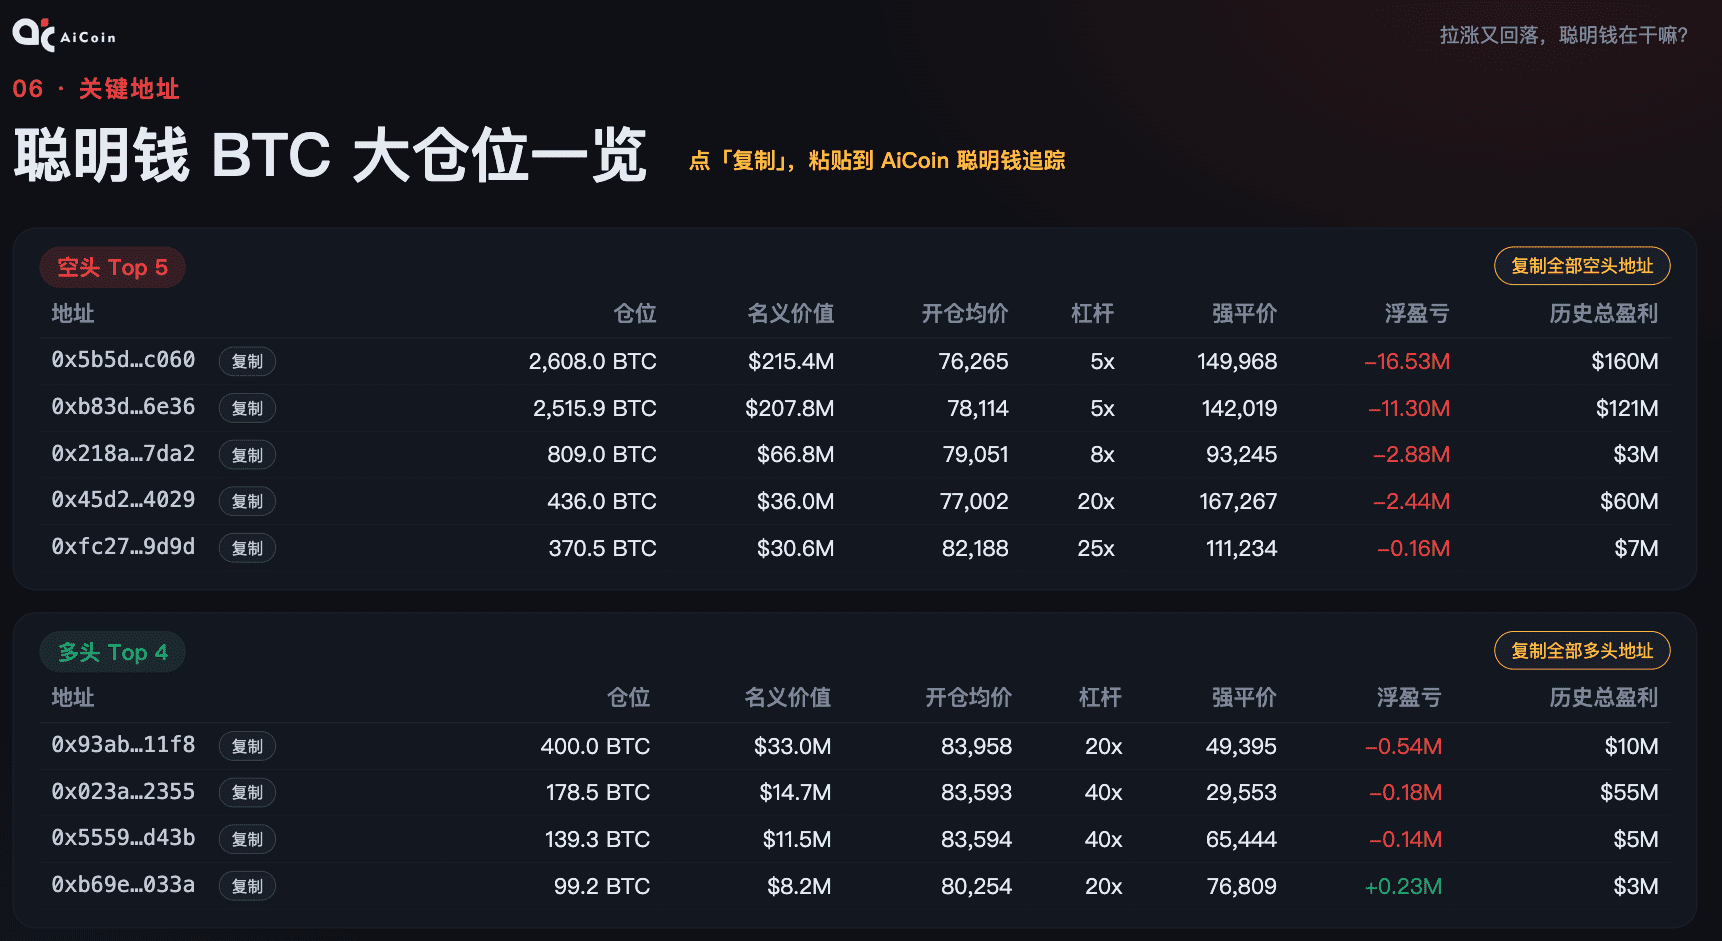
This page shows several addresses with the largest positions in smart money, the top five shorts and the top four longs.
You can see that the fifth address among the shorts opened at 82,200 with 25 times leverage, basically opening near the current price, a recent short-term position.
0xfc27136e42af1732ddc9ce2605ea9bff1b959d9d
Just now, on the long side, the largest address holds 400 BTC, worth 33 million dollars, with a cost at 83,900, now in a floating loss.
0x93ab7dbdeb996806454de19c35c8247f4b2511f8
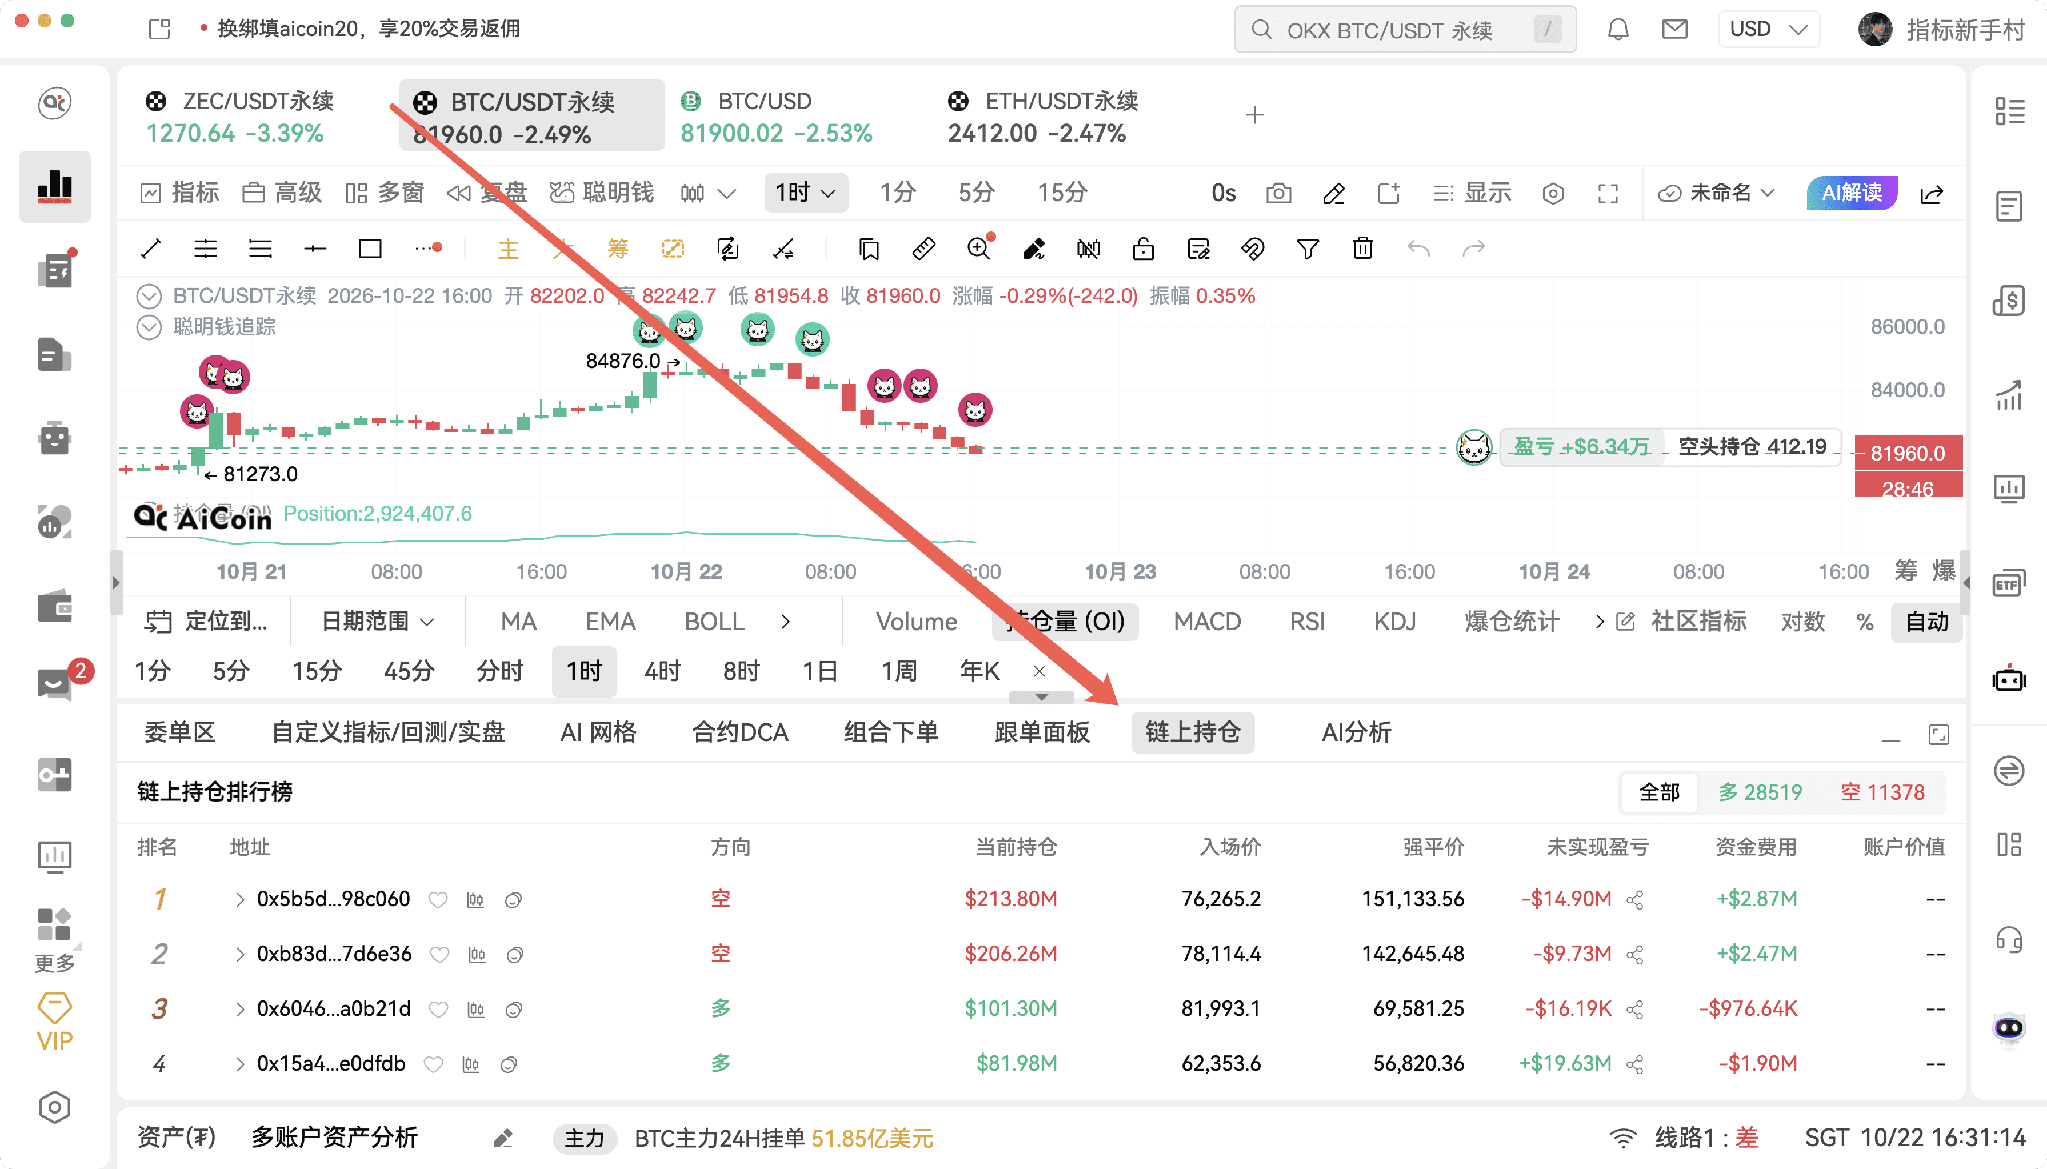
You can see these long and short addresses on-chain.
Just looking at the long and short ratio is not enough; we also need to check their cost prices, as this is the real key price level.
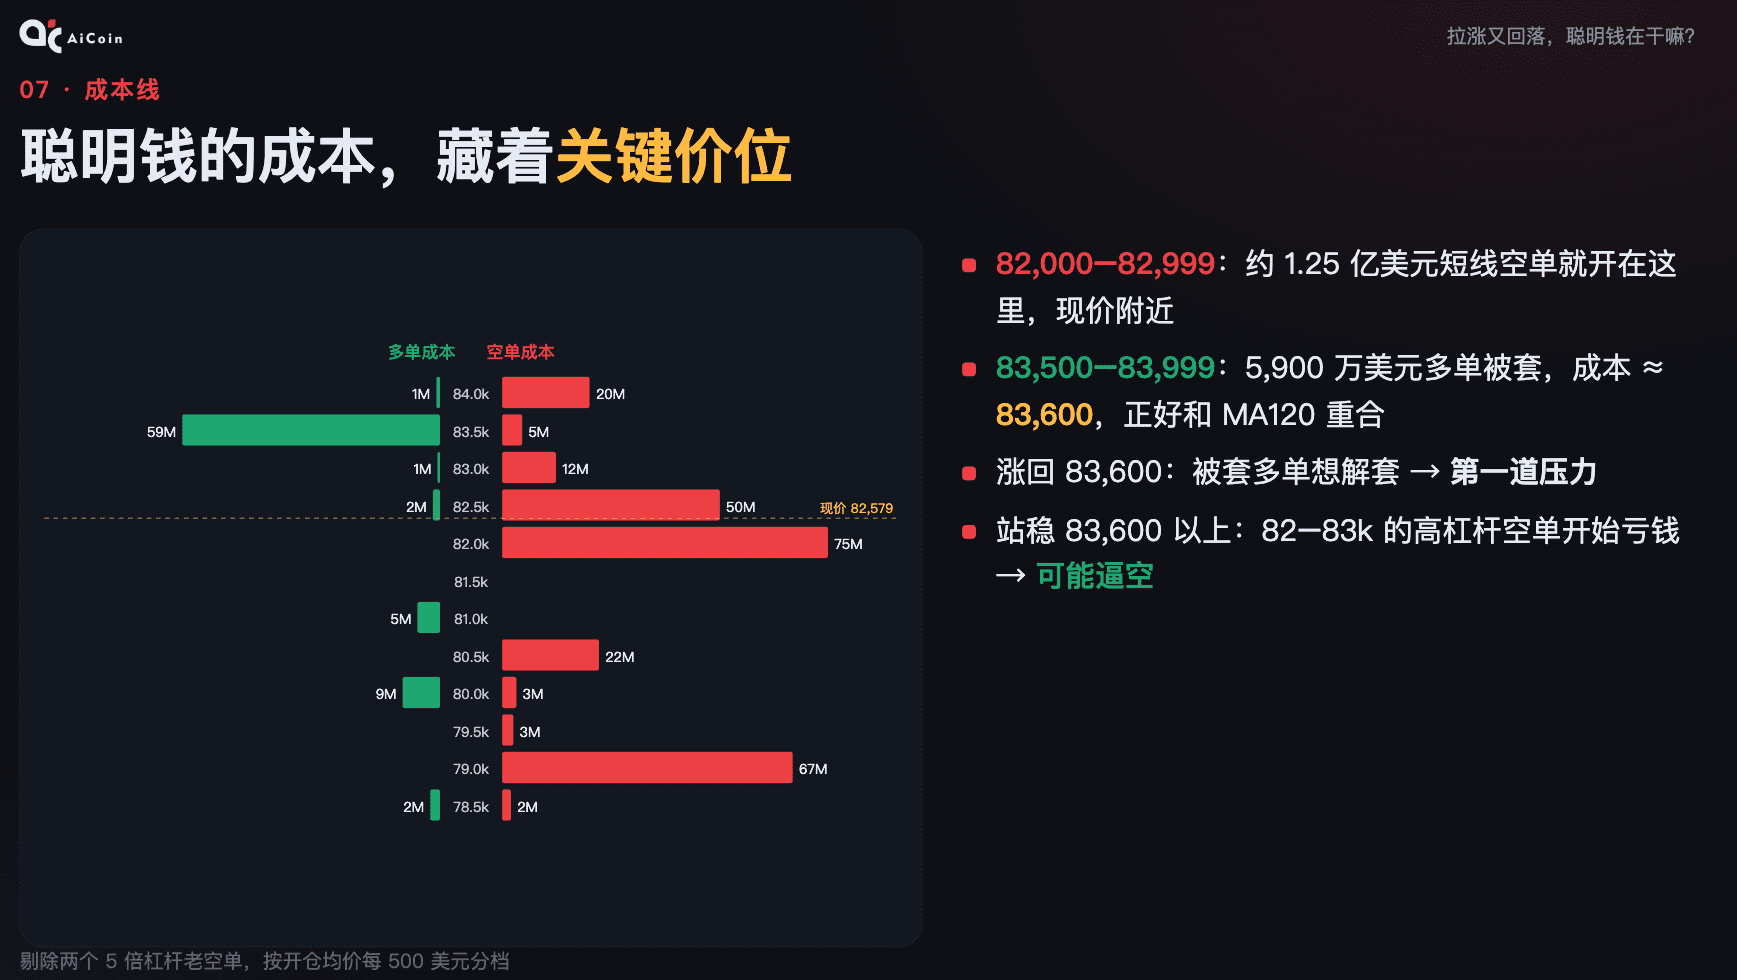
The left side in green is the cost of long positions, while the right side in red is the cost of short positions.
Looking at the right side, in the range of 82,000 to 83,000, there are about 125 million dollars in short positions opened near the current price, most being short-term positions with more than 20 times leverage.
Looking at the left side, in the range of 83,500 to 84,000, there are 59 million dollars in long positions that are currently underwater, with an average cost of around 83,600.
83,600, does that sound familiar? Yes, it's exactly that MA120 we just mentioned.
So if the price rises back to 83,600, those underwater long positions are likely to choose to exit to break even, creating the first pressure.
Conversely, if it can stabilize above 83,600, the high-leverage shorts in the 82,000 to 83,000 range will start to lose money, which might result in a short squeeze.
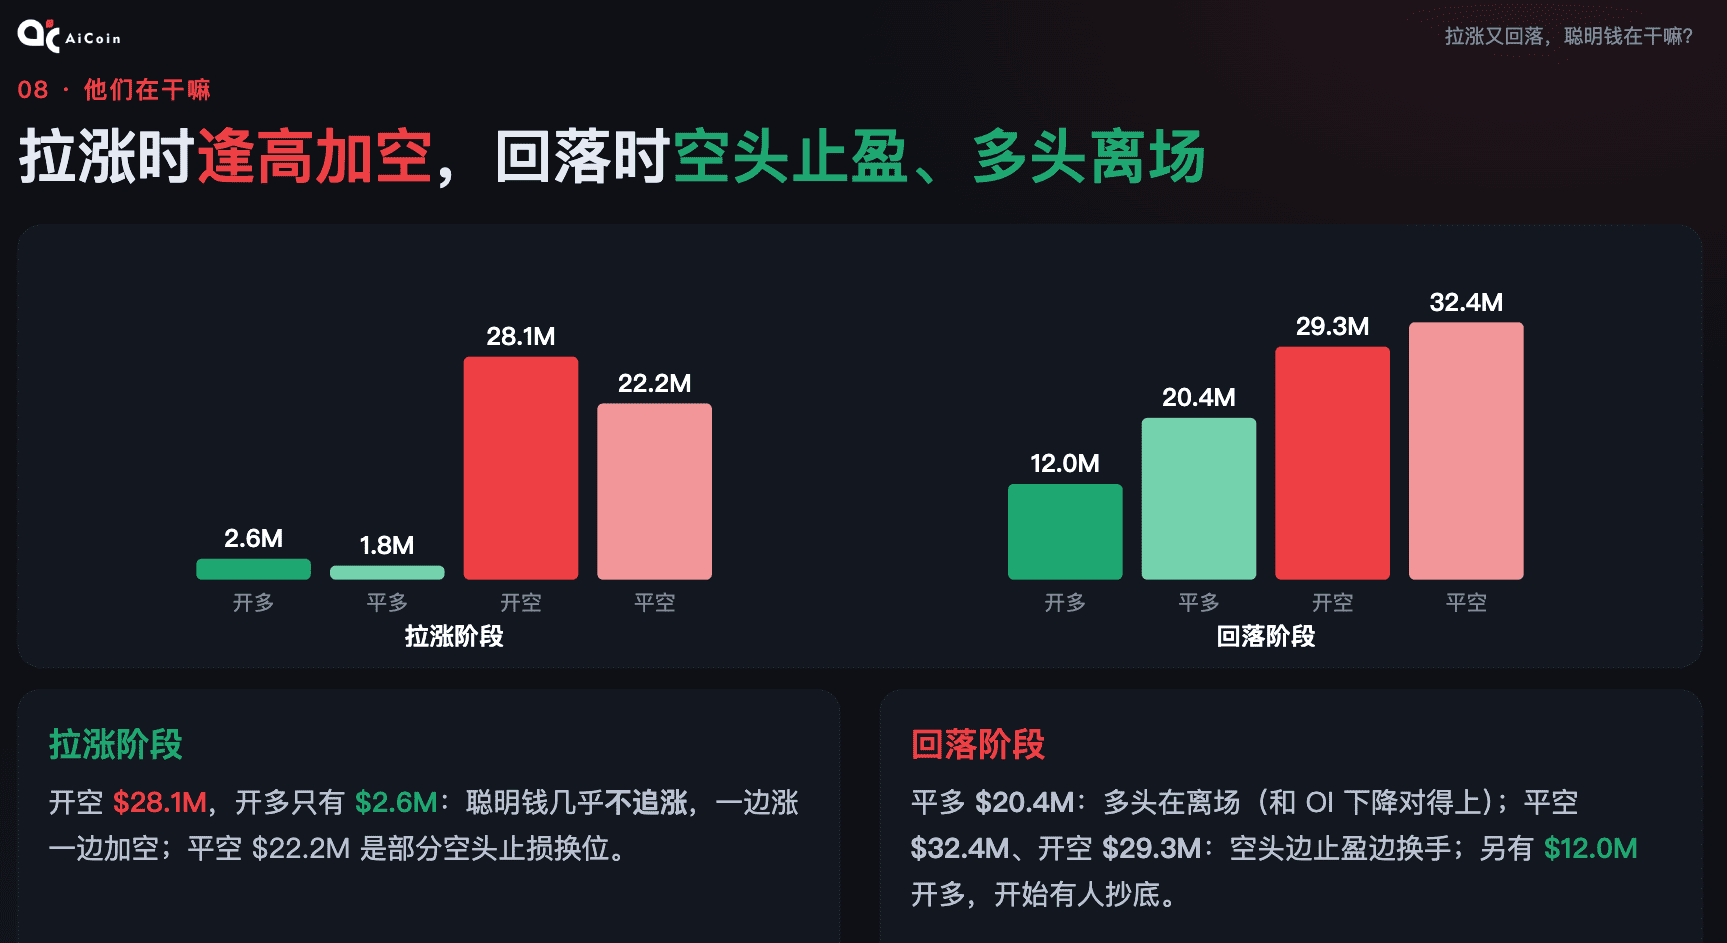
So how did the smart money operate specifically in the past two days? I divided the transactions into two segments.
During the upswing phase: smart money opened shorts for 28.1 million dollars, while opening longs was only 2.6 million. This indicates that this sample primarily increased shorts during the rise, with very few new longs. There were also 22.2 million in closed shorts, indicating some shorts exited; based on aggregated data alone, we cannot determine that these addresses will definitely reopen at higher levels.
During the pullback phase: they closed 20.4 million dollars in long positions, showing that the longs within the sample exited, aligning with the decline in OI; closed 32.4 million dollars in shorts, indicating that shorts took profits during the drop; at the same time, there were also 29.3 million in new shorts opened, suggesting that shorts were taking profits while swapping hands, without fully exiting.
But everyone should note that during the pullback, there were also new long positions opened for 12 million dollars, indicating that some smart money is beginning to bottom fish.
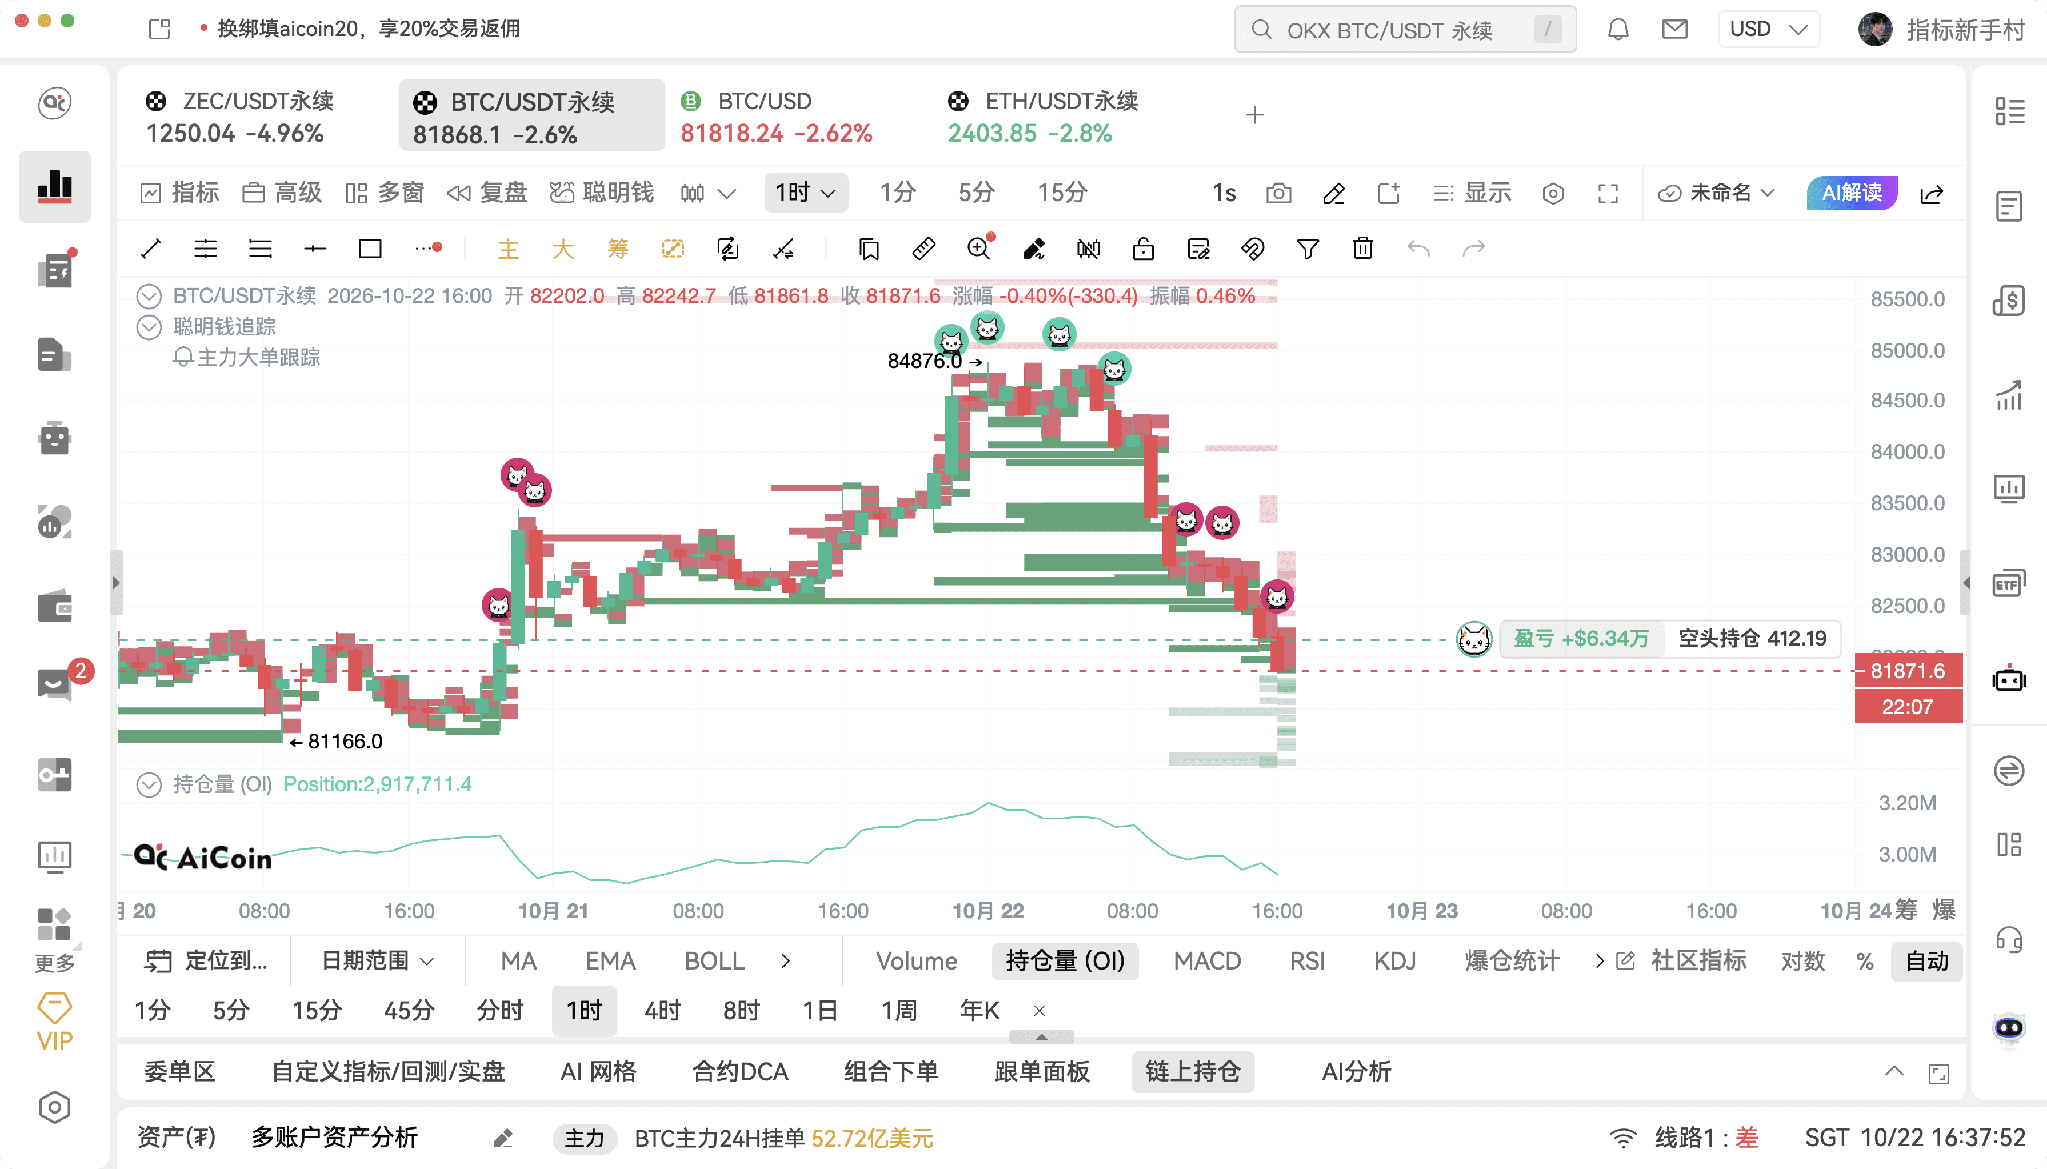
We can see a lot of buying below with primary large orders.
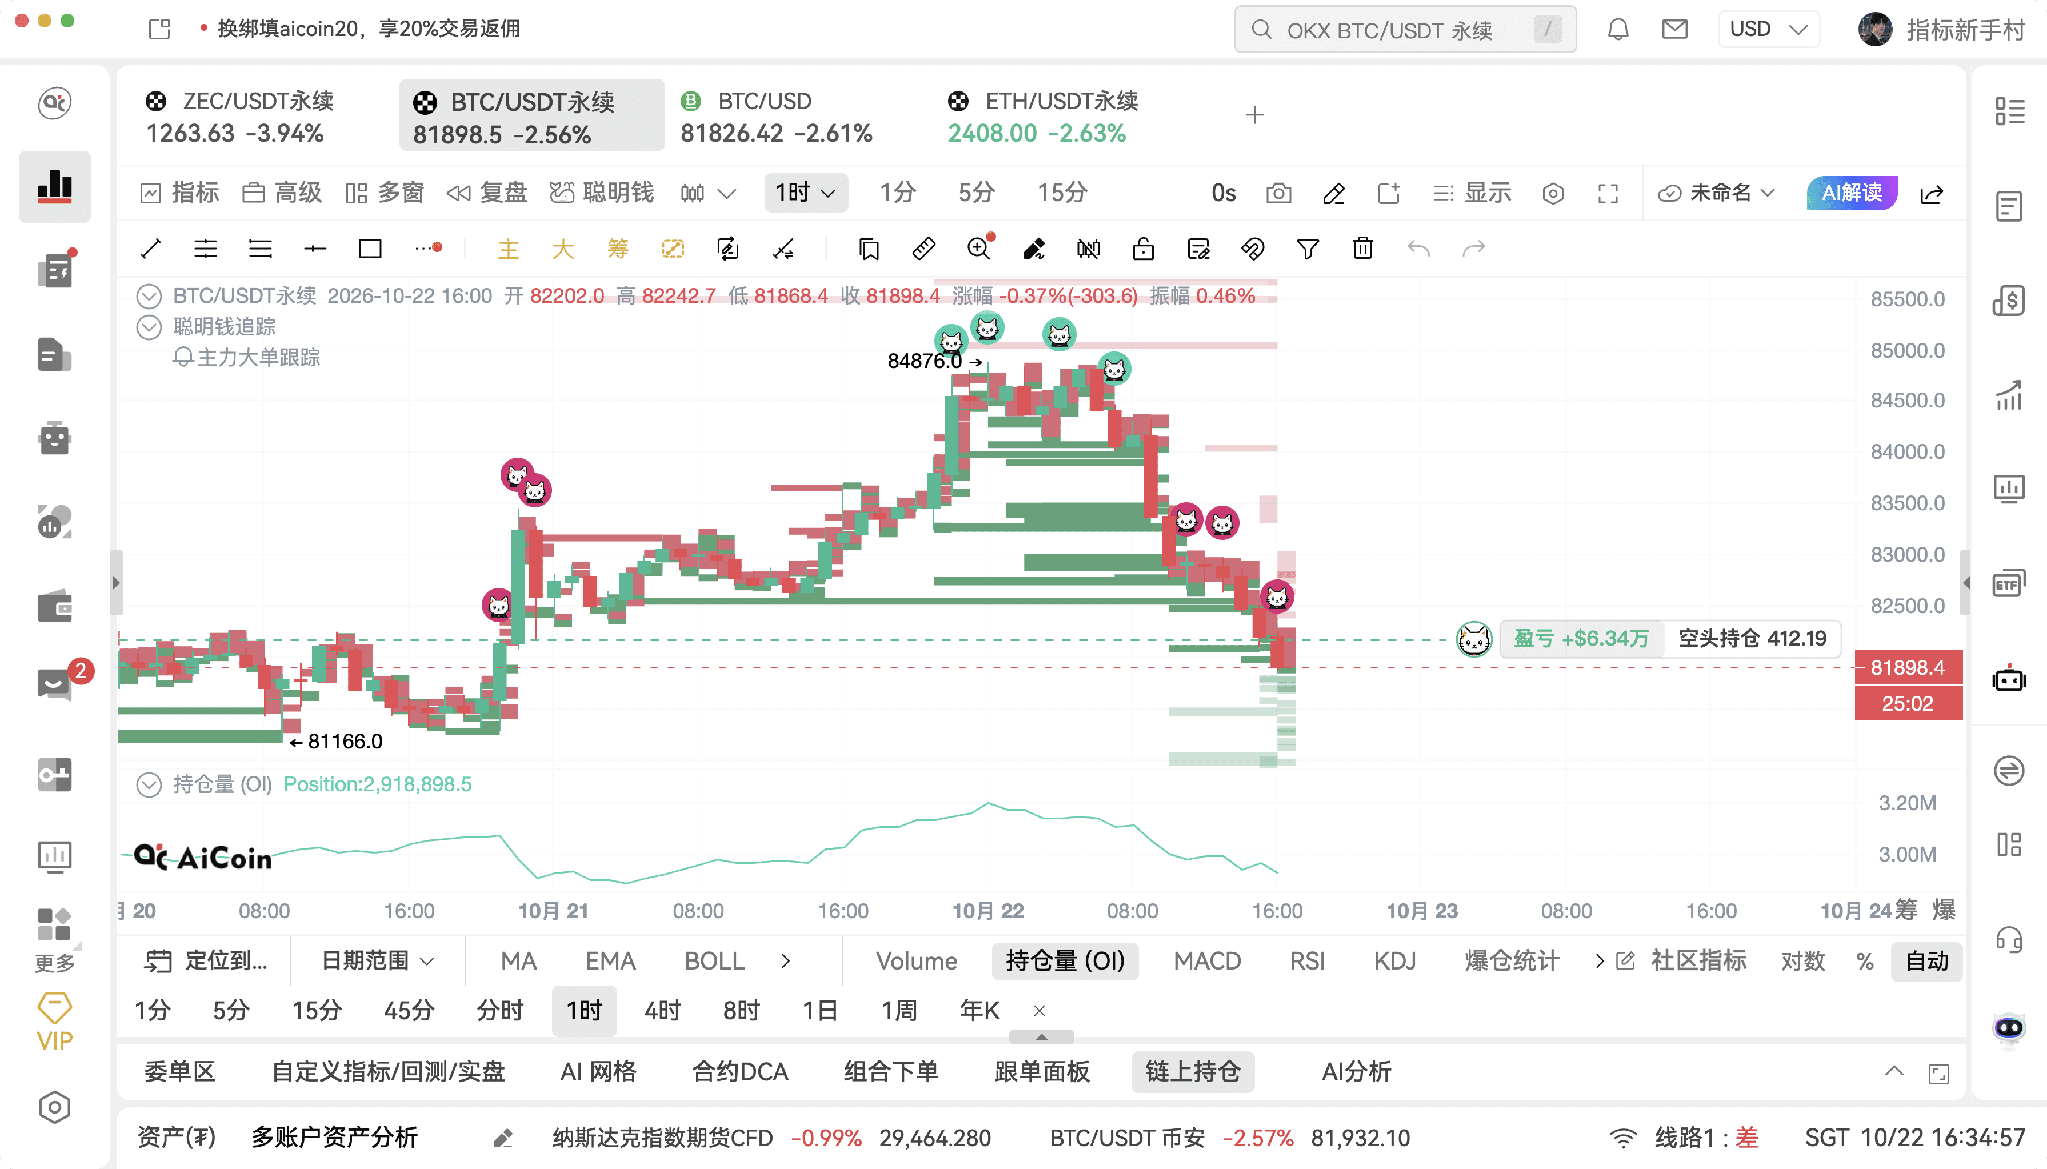
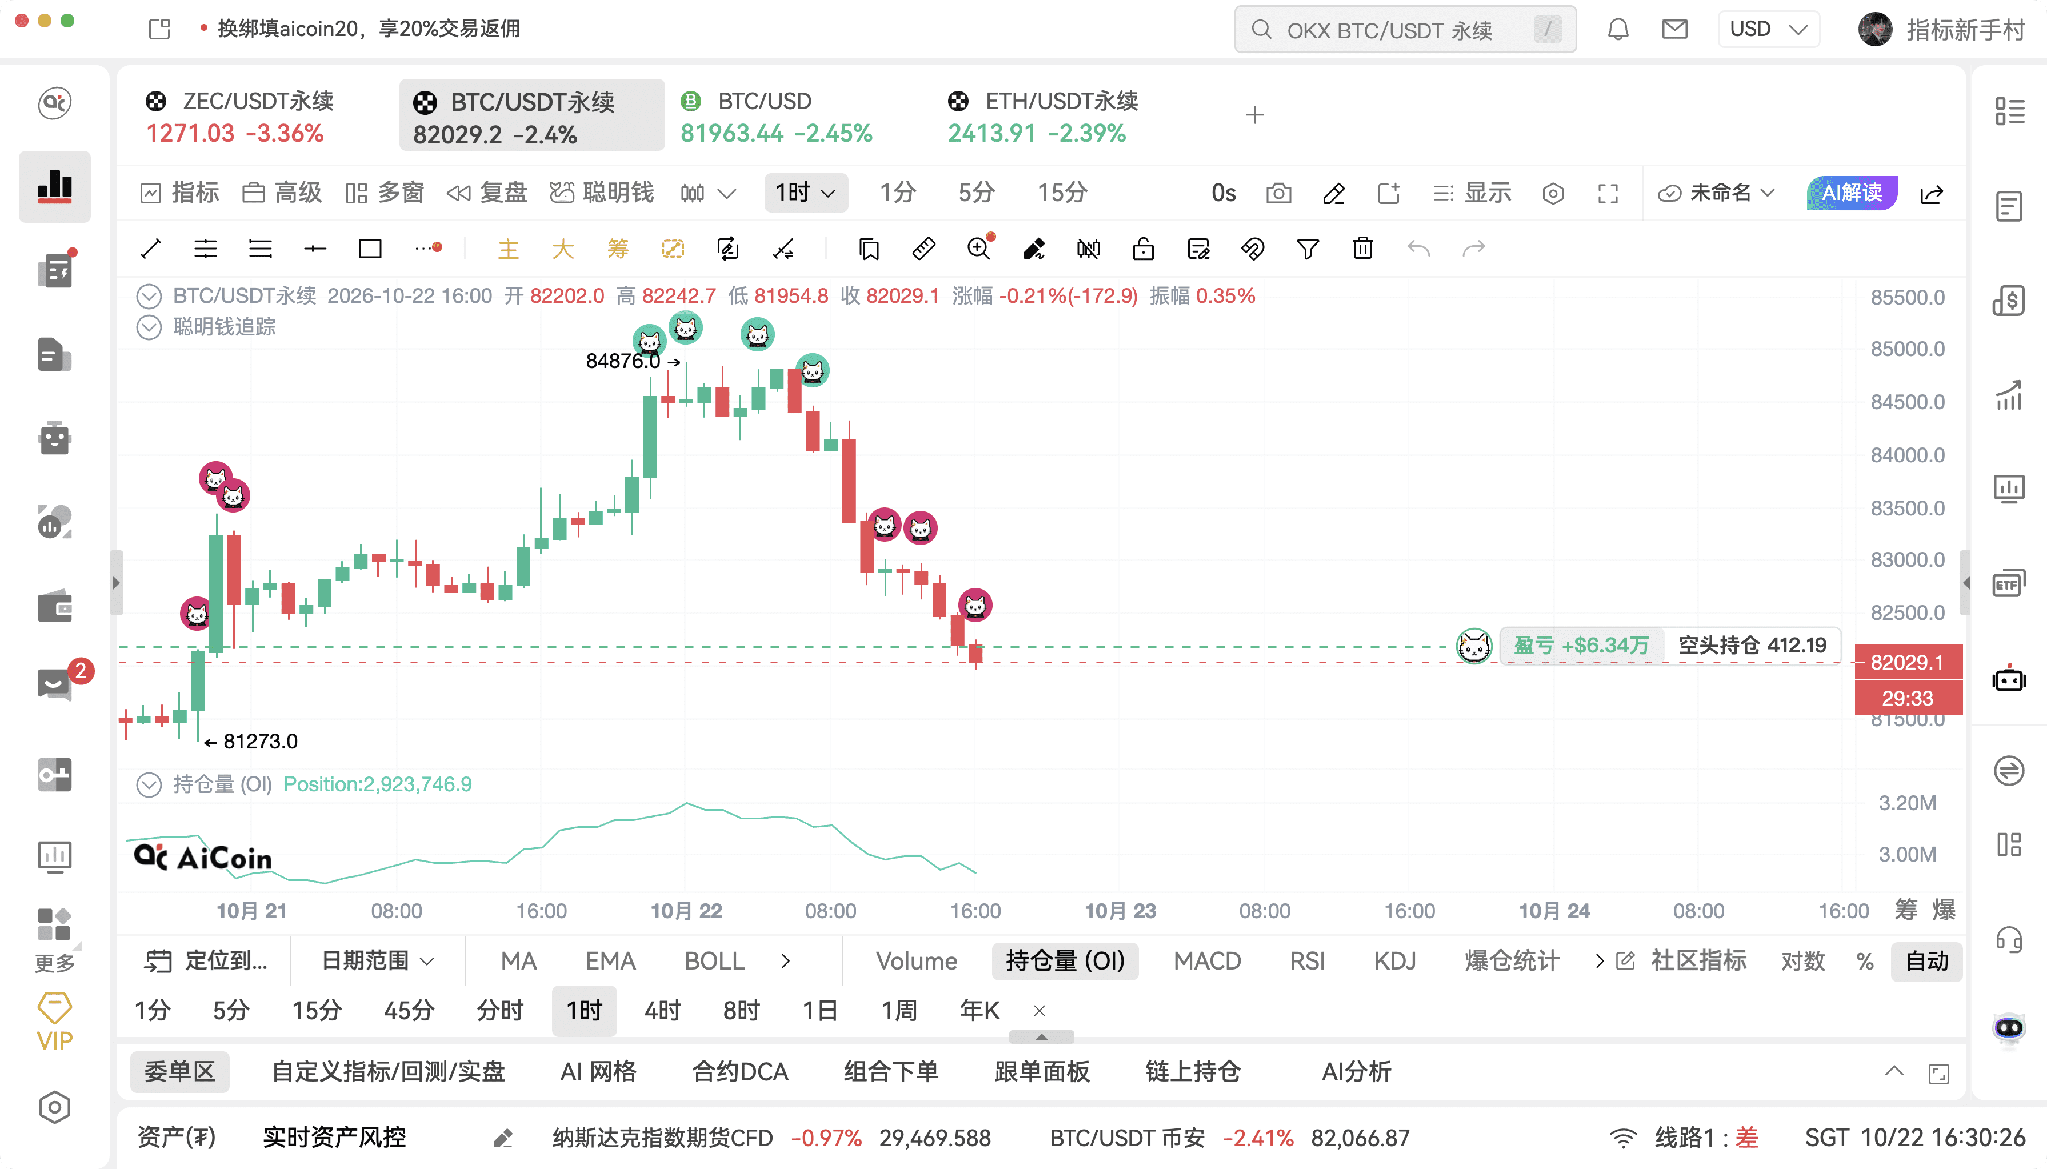
Now, I'll show you live how to add smart money addresses to the K-line: open AiCoin's K-line, click on the indicator in the top left corner, find smart money tracking, and paste in the addresses you just copied.
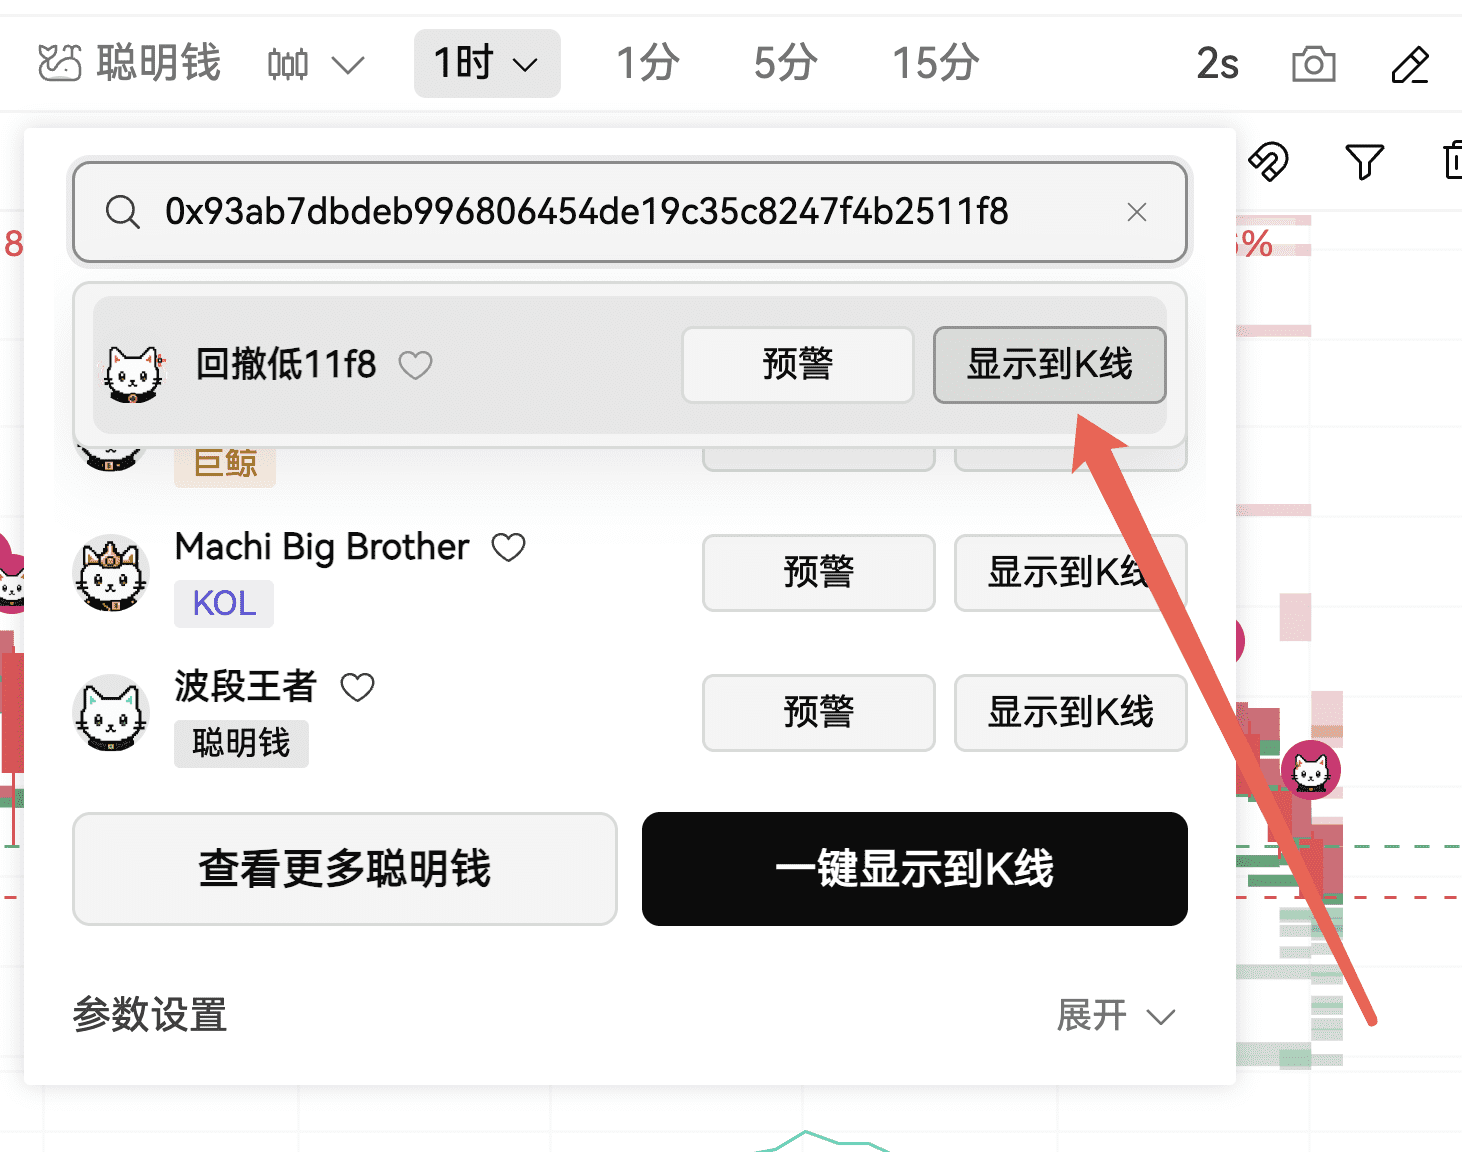
As you can see, the opening and closing positions of this address are marked on the K-line.
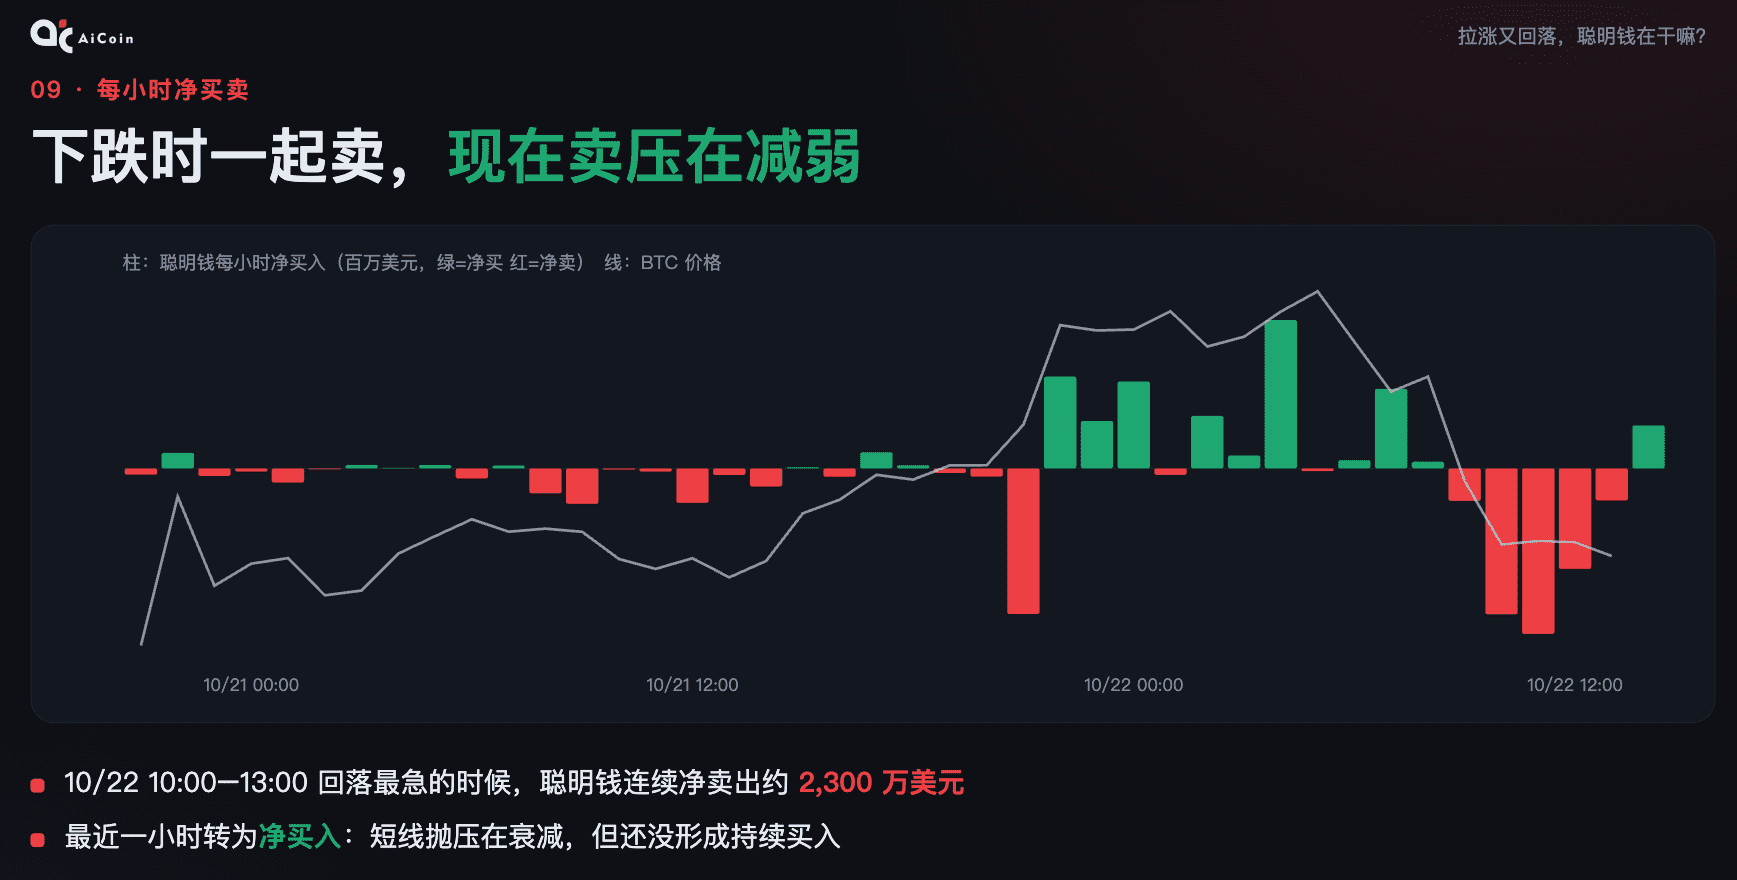
Let’s come back and refine the timeline a bit to see whether smart money is net buying or net selling each hour.
The green bars indicate net buying, red indicates net selling, and the white line represents price.
Looking at the hours from 10 AM to 1 PM today, during the steepest drop, smart money continuously net sold, totaling about 23 million dollars. They were selling along with the trend.
However, in the last hour, the bars turned green, shifting to net buying. This indicates that short-term selling pressure is weakening, but it’s only one hour, so we need to continue monitoring for sustained buying.
Now, are there any buyers waiting below? Let’s check Hyperliquid's order book.
Red indicates sell orders, green indicates buy orders. Below the current price, between 82,400 and 82,600, there was originally around 66 million dollars in buy orders hung beneath.
Further down, at 81,900 and 81,400, there are each over 20 million, representing the second and third lines of defense.
Above, at 82,700, there is a sell order of 41 million, and there are also sell orders at 82,900 and 83,200, which represent nearby pressure.
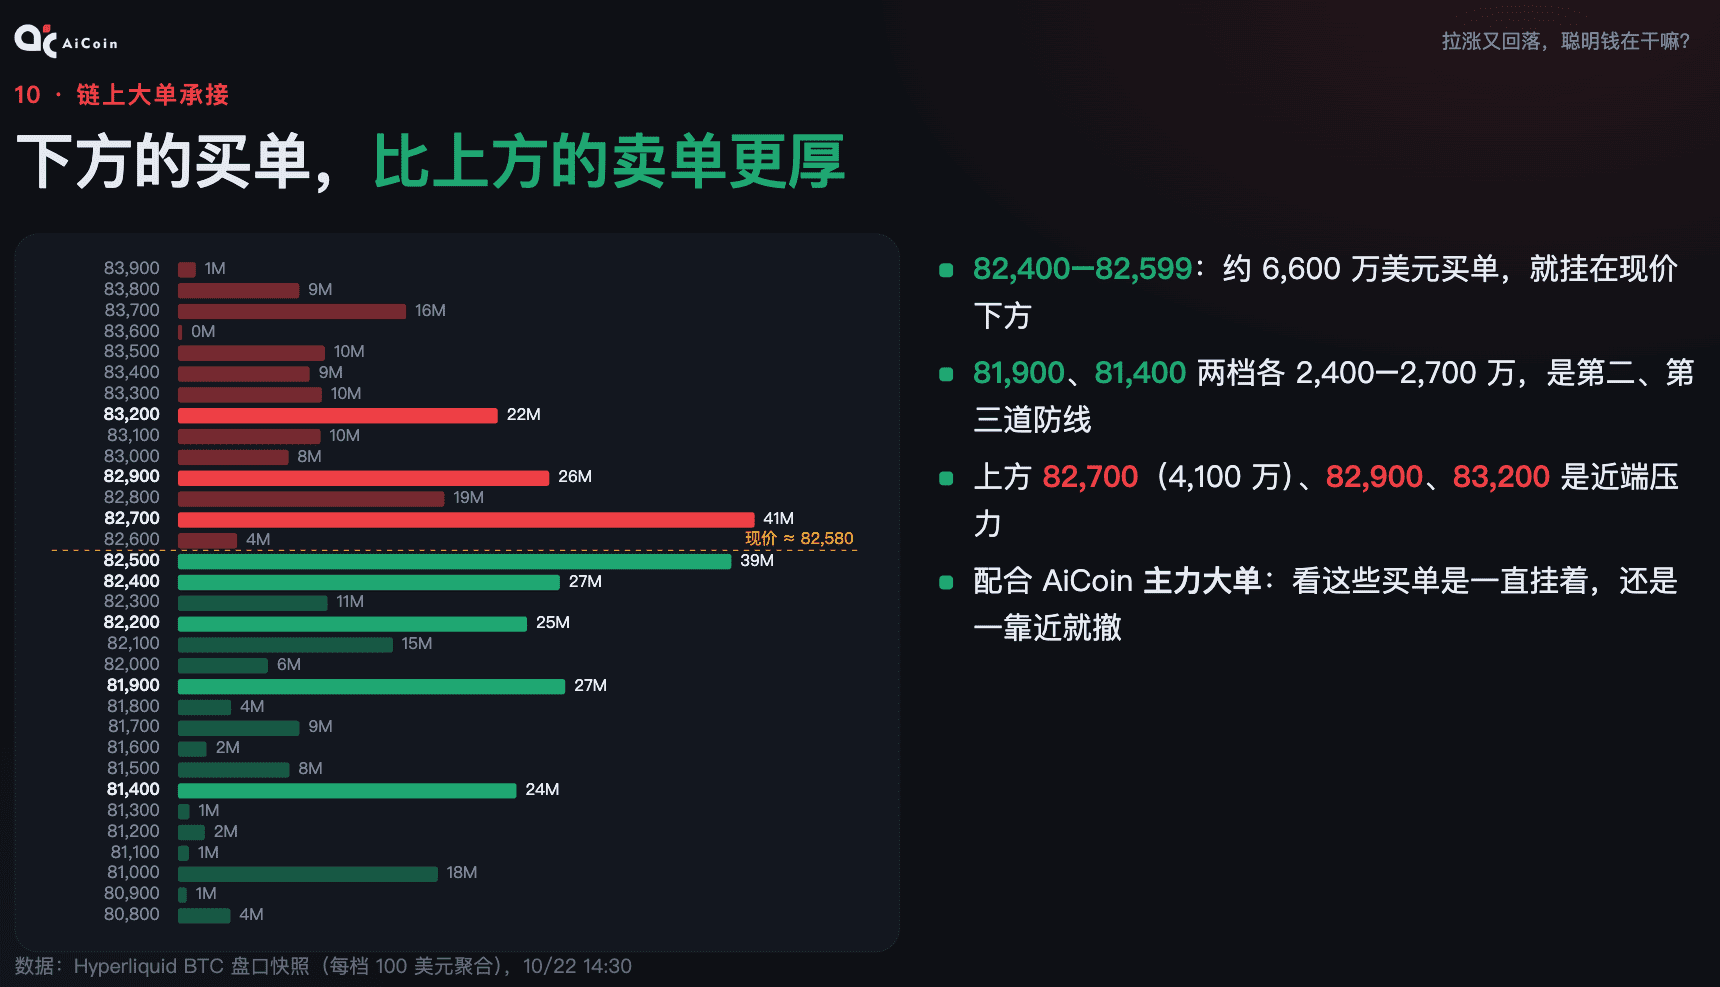
Here’s a little tip: orders in the order book can be canceled. So, it’s important to check alongside AiCoin’s major orders to see if these green lines stay or are retracted as prices approach. Sustained orders do not guarantee execution; only persistent retention and transaction confirmations constitute true support.
Alright, let’s summarize all signals together.
Clues supporting stabilization: open interest decreased by 6.6%, and leveraged crowding has been somewhat relieved; second, the funding rate returned to baseline, and sentiment is not overly heated; third, there were originally large on-chain buy orders at around 82,400 to 82,600; fourth, during the pullback, there have already been 12 million dollars in smart money initiating long positions to bottom fish.
Bearish aspects: first, this batch of smart money samples remains generally bearish; even after removing old shorts, it is still at 3.6 times; second, during the upswing, they increased shorts at higher prices instead of chasing longs; third, the price has already fallen below the MA120; fourth, around 83,600, there are underwater long positions and the MA120 creating dual pressure.
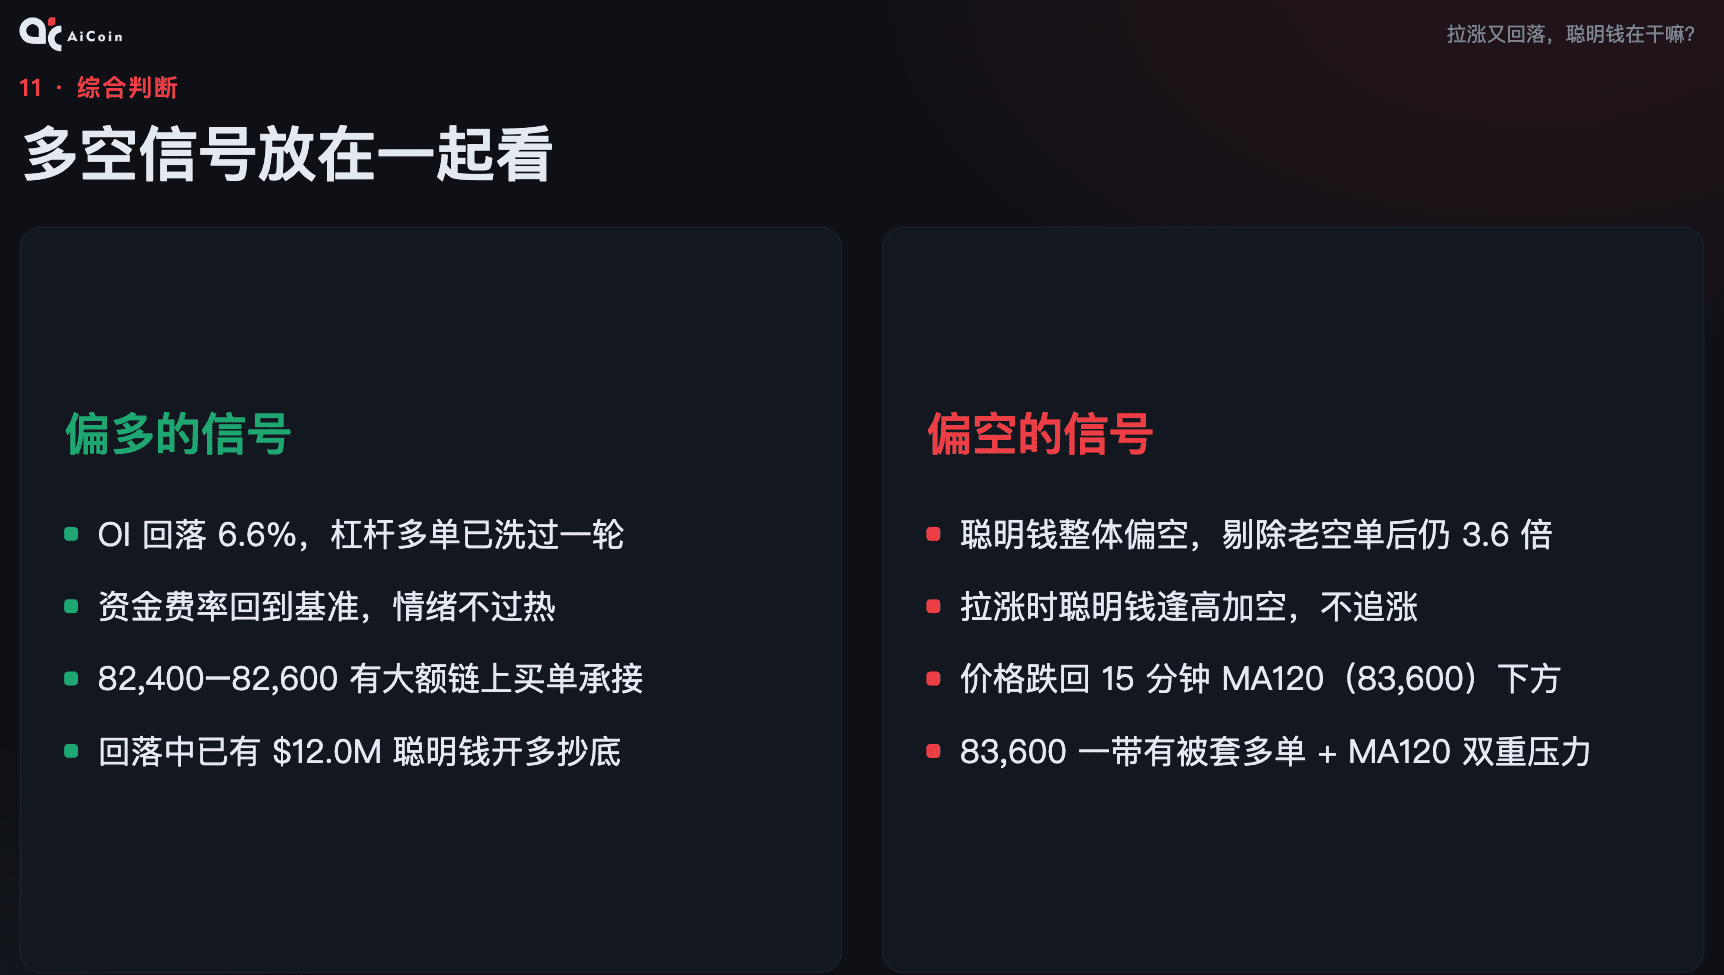
Both long and short signals exist, so moving forward isn’t about guessing the direction, but rather focusing on a few key price levels.
Therefore, I have prepared three scenarios for you.
Scenario A, effective support: holding at 82,400, then breaking back above 83,600. If at this point open interest rises again and smart money begins to close shorts, the shorts from 82,000 to 83,000 will be pressured, with the potential to test 84,000 to 84,800 again.
Scenario B, range oscillation: moving back and forth between 81,900 and 83,600. The longs have just been shaken out, and the shorts also dare not chase—personally, I think this is the most likely scenario. Keep an eye on whether buy orders remain at the lower boundary, and revert to the MA120 at the upper boundary.
Scenario C, support retracted: if the buy orders around 82,400 are withdrawn, and the price falls below 81,900, then watch the buy orders at 81,400 and 81,100.
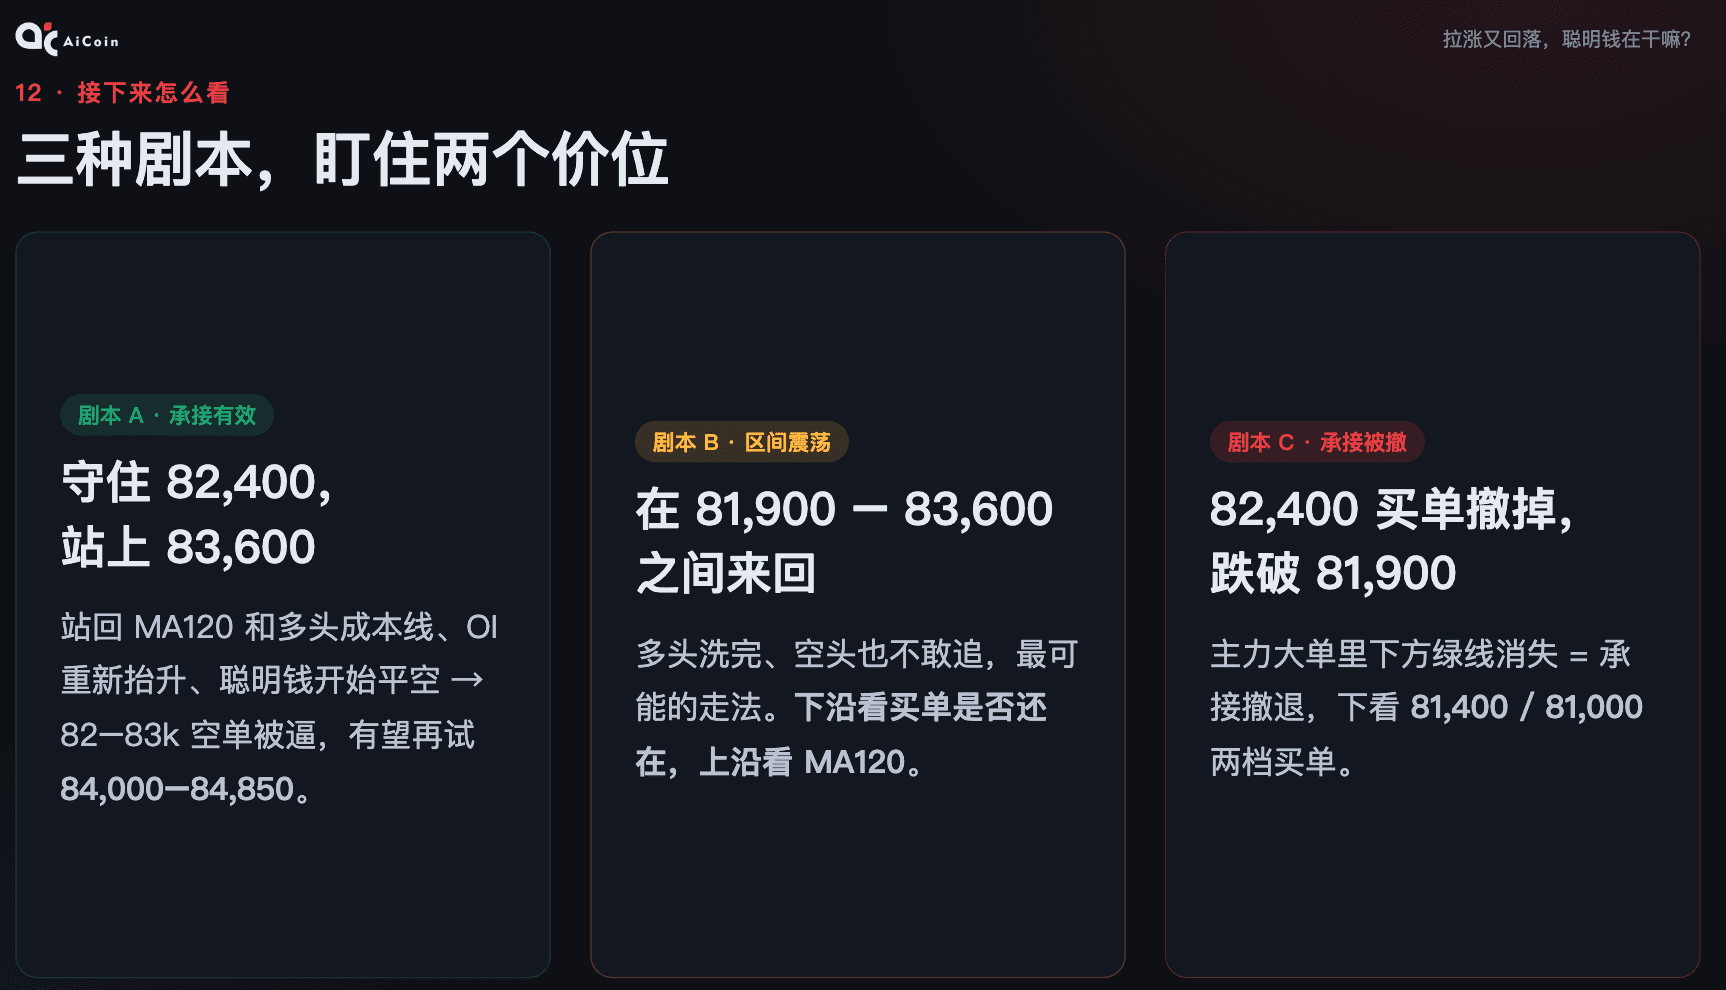
Just remember two price levels: 82,400 below and 83,600 above.
However, just now, the 82,400 level was breached.
The next line of defense for the longs is the 80,000 mark.
If this position is confirmed to be broken, the likelihood of a short-term weakening in market conditions will increase, coupled with pressures from the stock market. Thus, defensive measures must be taken.
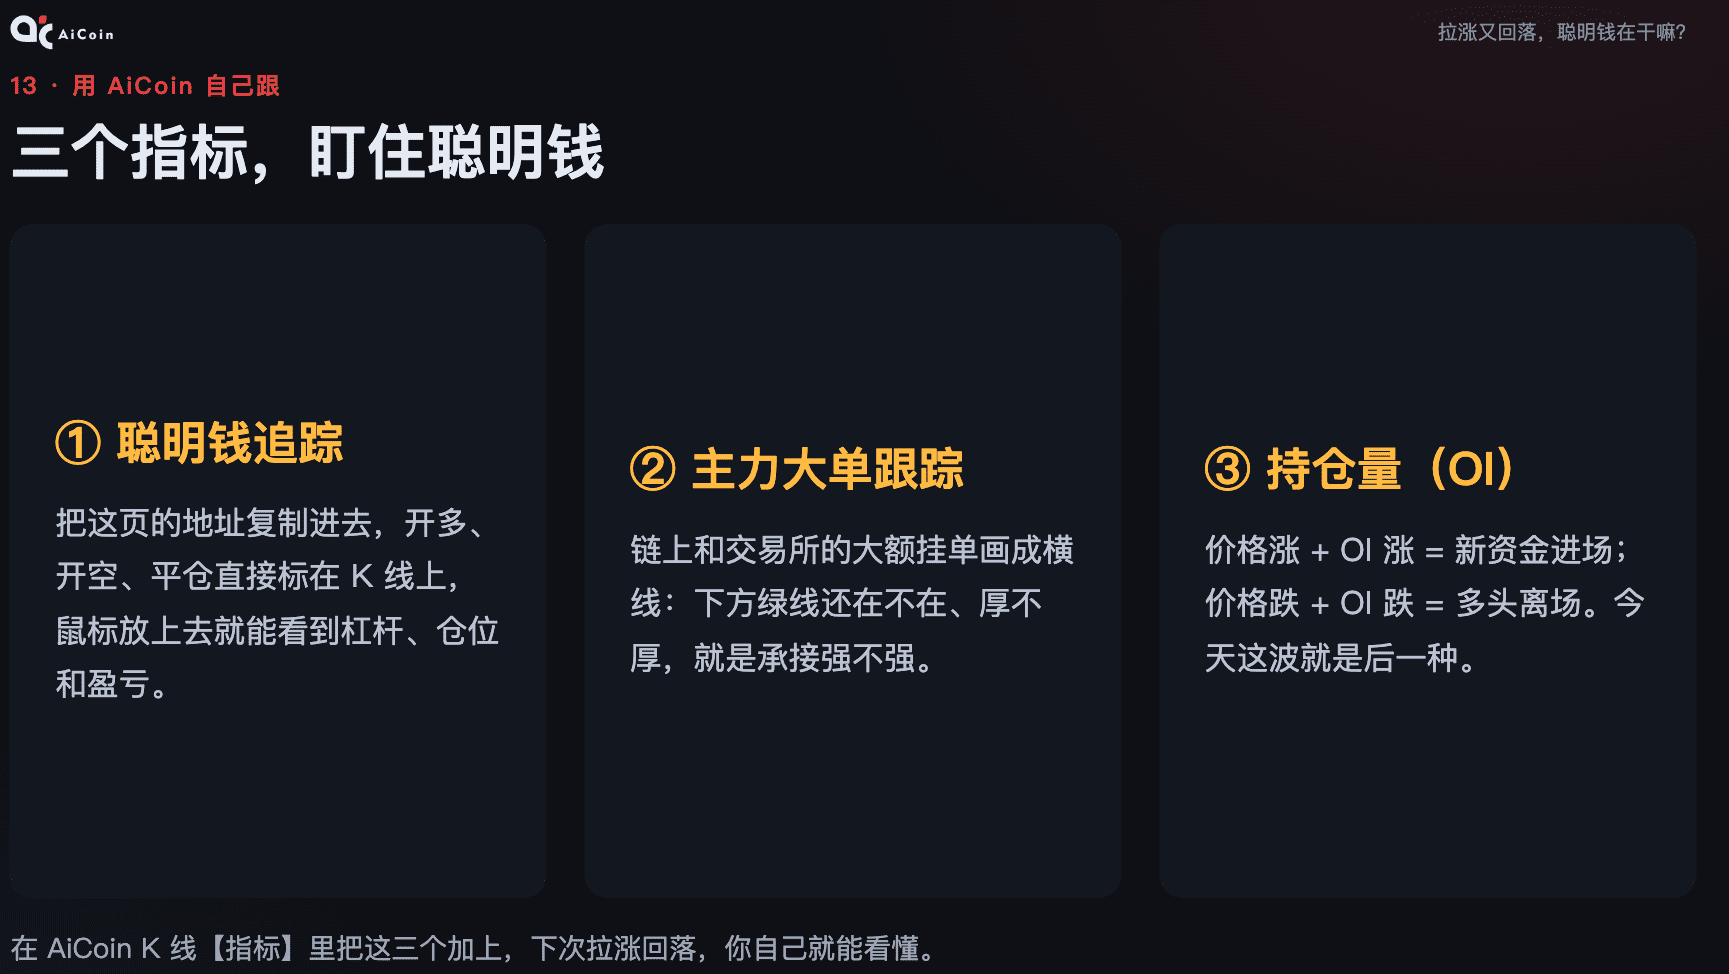
The tools used in this analysis can be found in AiCoin.
First, smart money tracking: copy those addresses from earlier into the tool, and every time they open or close a position, it will be marked on the K-line.
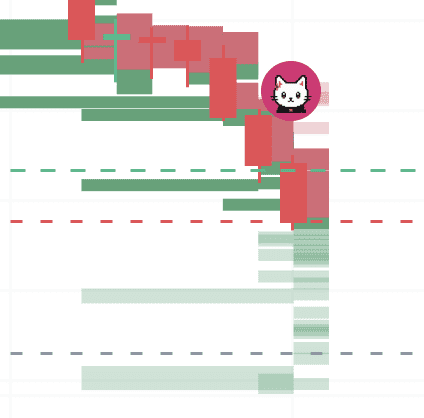
Second, major order tracking: large orders are marked as horizontal lines, watching whether the green lines are still there and how thick they are indicates how strong the support is.
Third, open interest OI: prices rise and OI rises, indicating new money is entering; prices fall and OI falls, usually accompanied by longs exiting, just like in today’s wave. A single change in OI does not directly indicate long or short outcomes, it must be judged alongside price, funding rates, and transaction data.
All three indicators can be found within the K-line indicators, and by adding them, next time you encounter a rise and fall, you will be able to understand what is driving the movements.
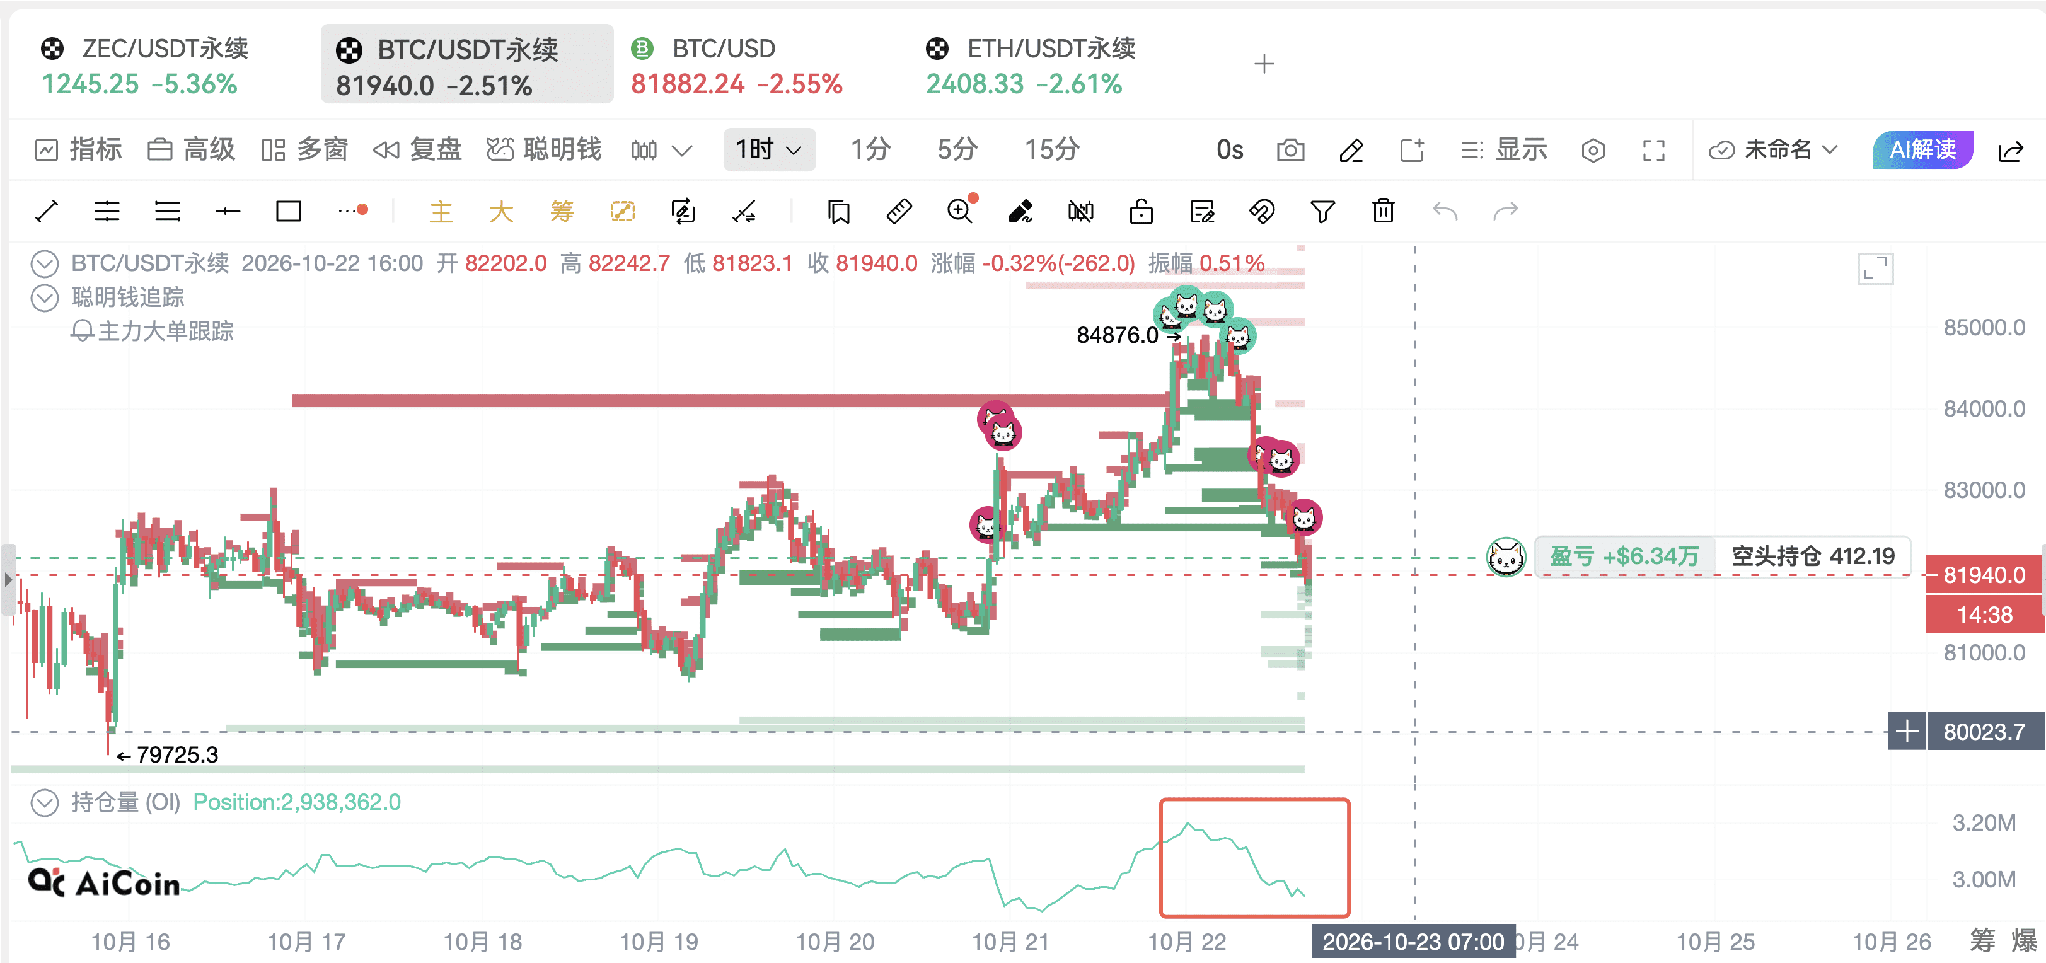
In the meantime, let’s highlight a few key points: combined with the opening and closing records of selected addresses, this pullback shows clear signs of long positions closing, but this does not exclude other selling pressures; the filtered smart money sample remains overall bearish; the large orders around 82,400 have been breached; above 83,600 is the MA120 plus the long position cost line, indicating key pressure. Only by breaking above can there be a chance for a squeeze; falling below 81,900 requires continued monitoring for further downturns.
The prices have been continuously falling, but OI is also falling, and together with previous transaction records, we can see closing actions from both sides within the sample. A decline in OI itself merely indicates a decrease in open positions, and does not imply that all longs and shorts have exited.
Currently, there are live broadcasts every day. Please continue to follow AiCoin, friends! Reserve your spot in advance 👇
https://www.aicoin.com/zh-Hans/live/list?tab=upcoming
Join our community, let’s discuss together, and become stronger!
Official Telegram community:
AiCoin's Chinese Twitter:
Hype Rebate:
https://app.hyperliquid.xyz/join/AICOIN88
Binance Rebate:
https://jump.do/zh-Hans/xlink-proxy?id=3
Invitation Code: aicoin668
Coinbase Rebate:
https://jump.do/xlink?checkProxy=true&proxyId=25
Invitation Code: Y8L23JL
免责声明:本文章仅代表作者个人观点,不代表本平台的立场和观点。本文章仅供信息分享,不构成对任何人的任何投资建议。用户与作者之间的任何争议,与本平台无关。如网页中刊载的文章或图片涉及侵权,请提供相关的权利证明和身份证明发送邮件到support@aicoin.com,本平台相关工作人员将会进行核查。