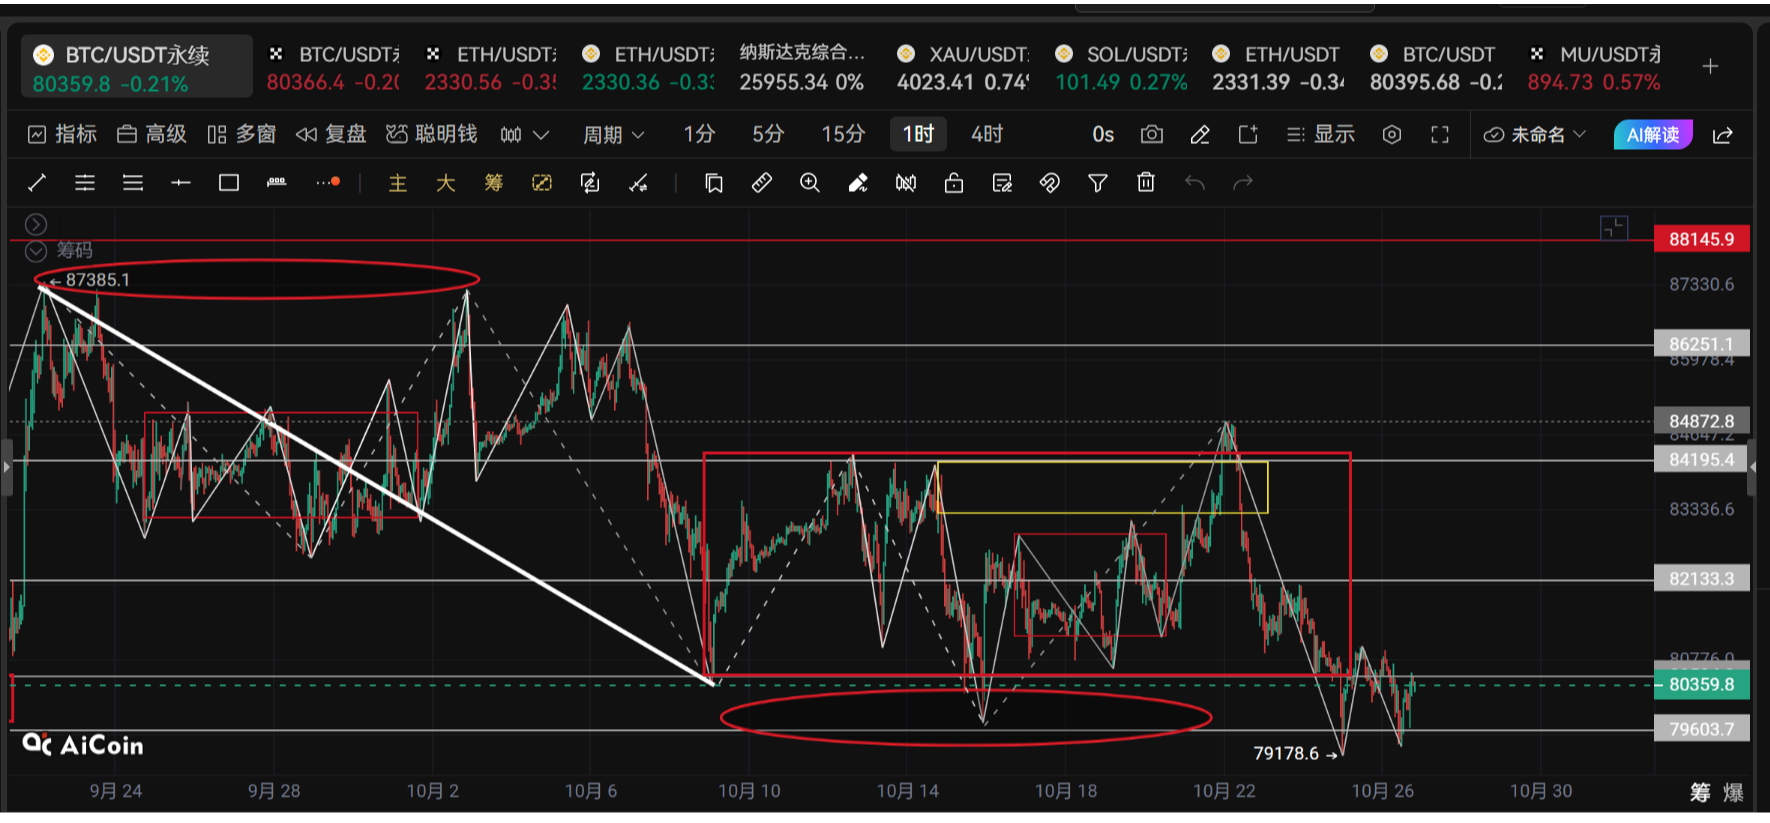
Cryptocurrency Scholar: On October 27th, Bitcoin (BTC) tested the same moving average three times, and the support has quietly changed its nature
To be frank, the current market is really not suitable for heavy positions. I have only made three trades in the past two weeks, two profitable and one losing, totaling less than 20 points. Why? Because the market is too fake; on the four-hour chart it looks like it's about to rise, but the daily chart is preventing it; while the daily chart indicates a drop, there’s funding supporting it on the four-hour. At times like this, the more you want to make quick money, the easier it is to be harvested in both directions. The aggressive strategy provided today is for those who are impatient and really want to enter the market, and the position must be controlled within 10% of the total funds
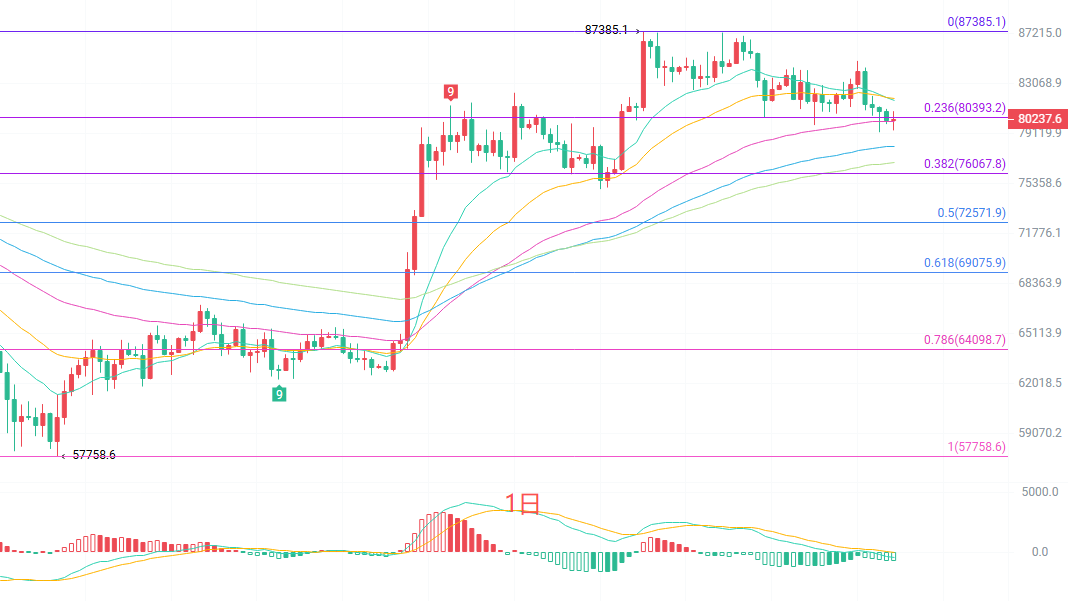
The daily K-line TD sequence has reached the fifth count down of the ninth, which means that this wave of correction on the daily level is not yet over; at least three to four more K-lines are needed to confirm the bottom. In terms of the moving average system, the price is currently above the EMA60 at 80064, which is the last bottom line for bulls; however, the EMA15 at 81773 and the EMA30 at 81888 are firmly suppressing it, with both moving averages flattening and slightly declining, indicating that the medium-term bearish pattern has not been broken. The MACD green bars are still expanding, and while the volume is contracting, it hasn’t crossed and turned positive. The Bollinger Bands middle track is at 82059, and the price has been operating below this middle track for three consecutive days, which is a weak signal. In summary: whether the daily line is a continuation of the downtrend or a consolidation at the bottom depends on whether 80060 can be held
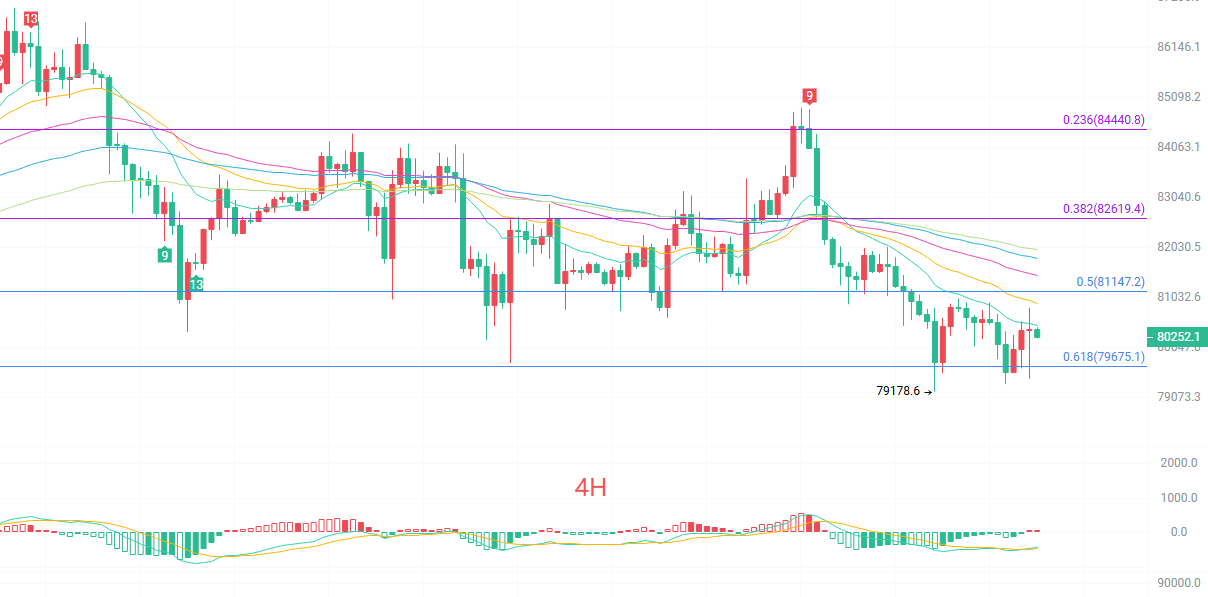
The four-hour K-line shows signs of a short-term reversal. The most critical change is that the MACD four-hour level has seen a return of bullish momentum for the first time after the pull-up from 79400, indicating that there is capital buying at that low point. As for moving averages, the price is just stuck around the EMA15 at 80539, with the EMA30 at 80978 and EMA60 at 81514 exerting layers of pressure above. The Bollinger Bands middle track is at 80641, and the price is right at the upper edge of this middle track, with the lower track at 79574 serving as strong short-term support
Short-term reference:
Going north from 80100 to 79600 faces resistance, stop loss at 500 points, target at 80800 to 81500
Going south from 81500 to 82000 shows stagnation, stop loss at 500 points, target at 80500 to 79500
Specific actions depend on real-time market data; for more information, you can consult the author. There may be delays in article publication; suggestions are for reference only and risks are to be borne by yourself.
Reminder: The above content is updated simultaneously by the Cryptocurrency Scholar on major trading platforms like Binance, OKEx, Huobi, etc. If you need assistance, you can follow me on Binance and join my fan group.
免责声明:本文章仅代表作者个人观点,不代表本平台的立场和观点。本文章仅供信息分享,不构成对任何人的任何投资建议。用户与作者之间的任何争议,与本平台无关。如网页中刊载的文章或图片涉及侵权,请提供相关的权利证明和身份证明发送邮件到support@aicoin.com,本平台相关工作人员将会进行核查。