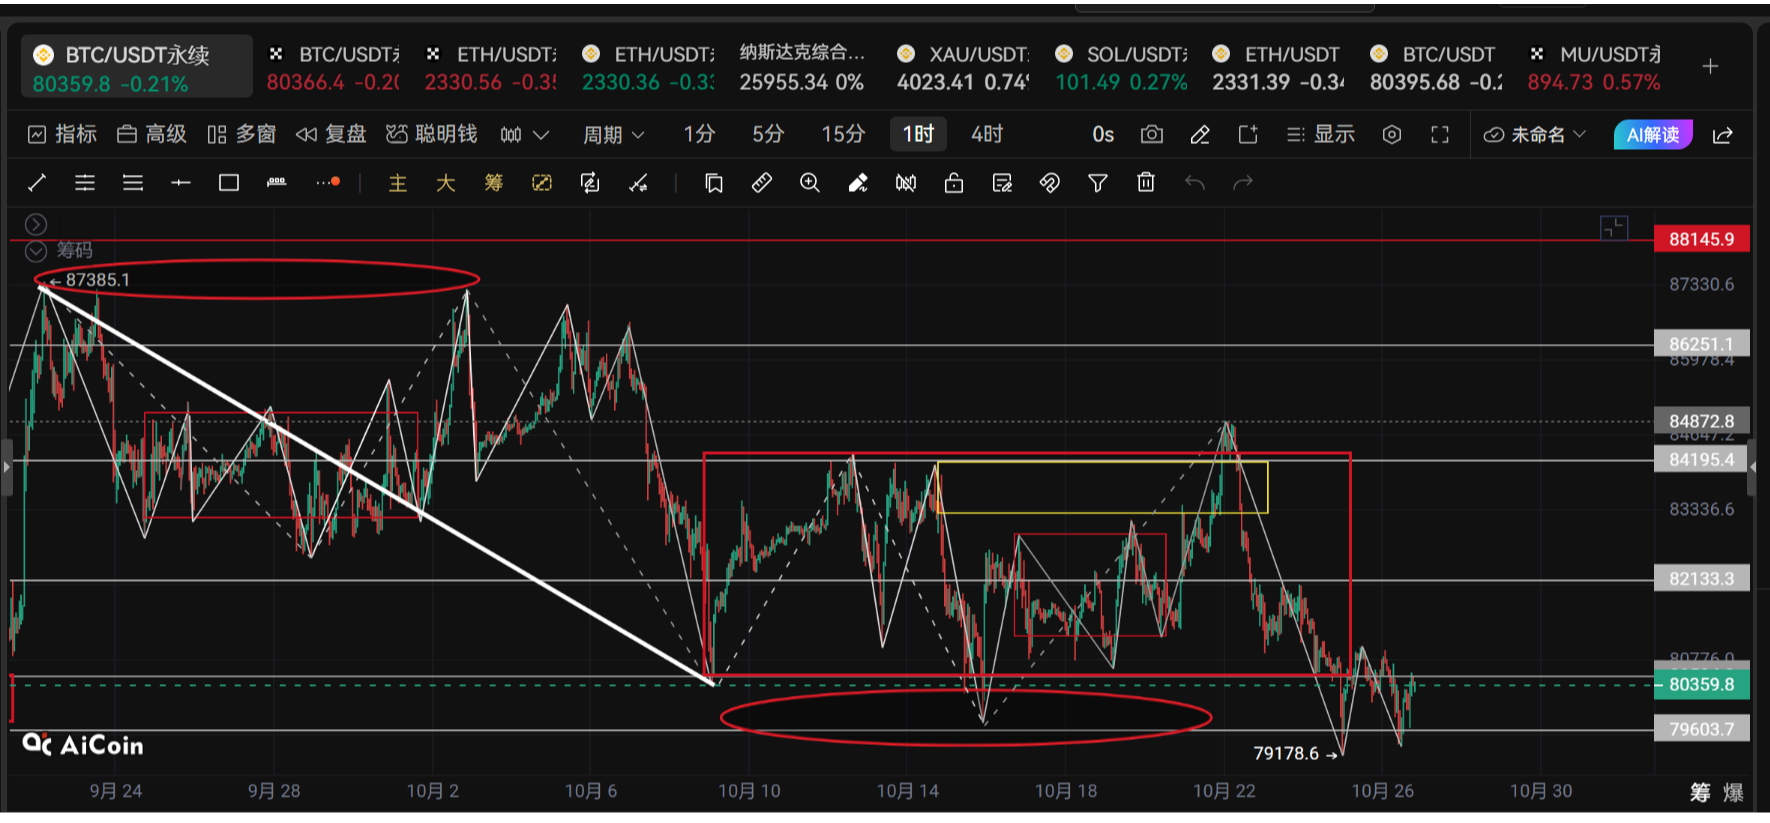
Crypto Circle Academician: On October 27, Ethereum (ETH) daily and weekly charts resonate bearishly, but a small signal is quietly sprouting. Are the smart people already laying in ambush?
Today, let’s talk about something different. I noticed an interesting phenomenon: when the market is good, everyone feels like they are stock gods; when the market drops, everyone comes out asking, "What should I do, teacher?" I just want to ask, when you first entered the market, why didn’t you think it might drop? The most difficult part of trading is not reading the charts, but controlling yourself. No matter how clear the chart looks, when it’s time to place an order, greed and fear fill your mind. When it rises, you’re afraid of missing out and chase it; when it drops, you’re afraid of losing more and cut your losses, getting slapped back and forth. My biggest realization after these years is: do less and observe more. The signals a chart gives you each day are just one or two. Don’t act until the right level is reached.
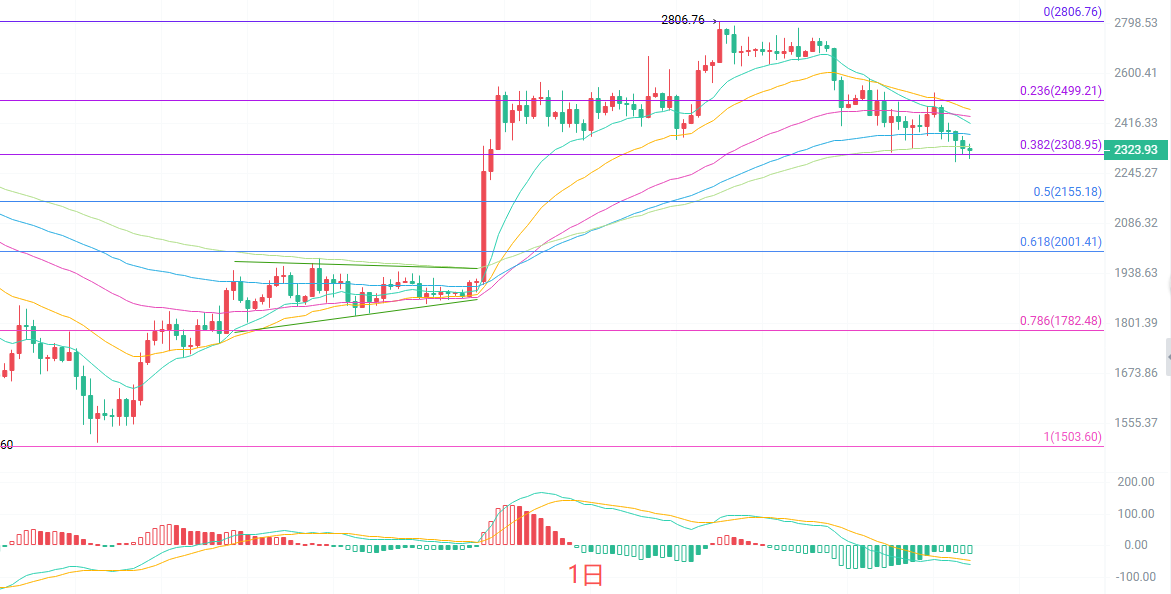
The daily candlestick chart is currently pressing down on the EMA120 life line, with the lower Bollinger Band at 2311, and below that is today’s low point at 2292. In terms of moving average arrangement, EMA15 is at 2418, EMA30 at 2466, and EMA60 at 2440, all pressing down from above, indicating that the medium-term trend is still dominated by bears. In terms of MACD, green bars are still increasing, indicating that the daily level bearish momentum has not fully released. The Fibonacci retracement level at 0.382 is at 2308, and the current price is just a bit above this level. The TD nine-turn daily chart has reached 5, which means the daily level still hasn’t shown a reversal signal, so don’t rush to catch the bottom.
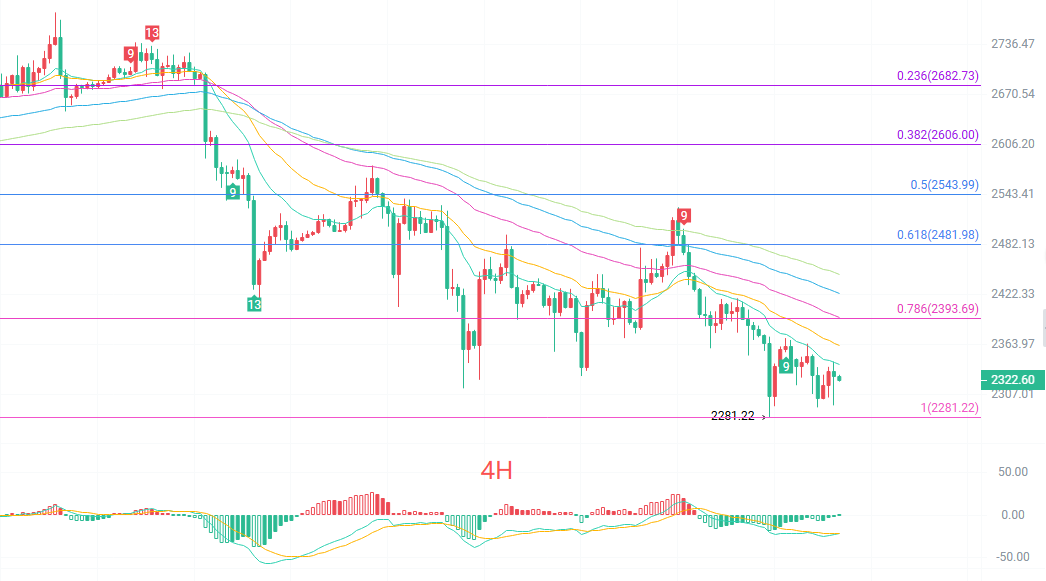
In the four-hour candlestick chart, EMA15 is at 2343, EMA30 at 2365, EMA60 at 2398, and EMA90 at 2426, indicating a typical bearish arrangement with prices being pressed down by all moving averages. The Bollinger Bands' four-hour lower and middle bands range between 2293 and 2353, indicating a decision point in the short term. In MACD, it's nearing the zero axis, and bearish momentum is dwindling. The TD nine-turn four-hour chart just flipped to 1, meaning if the next few candlesticks continue to rise, it might trigger a buy count, but it’s only the first one, and the signal is too early to be relied upon.
Short-term reference:
For the upward movement, being blocked from 2280 to 2240, stop loss 30 points, target looking at 2320 to 2380.
For the downward movement, stagnating from 2380 to 2420, stop loss 30 points, target looking at 2330 to 2280.
Specific operations should be based on real-time market data. For more information, you can consult me; the article has a publication delay, and is suggested for reference only, risk is to be borne by yourself.
Friendly reminder: The content above is by the Crypto Circle Academician and is updated simultaneously across major platforms like Binance, OKEx, Huobi, etc. More content can be followed on Binance and you can add me to my fan group.
免责声明:本文章仅代表作者个人观点,不代表本平台的立场和观点。本文章仅供信息分享,不构成对任何人的任何投资建议。用户与作者之间的任何争议,与本平台无关。如网页中刊载的文章或图片涉及侵权,请提供相关的权利证明和身份证明发送邮件到support@aicoin.com,本平台相关工作人员将会进行核查。