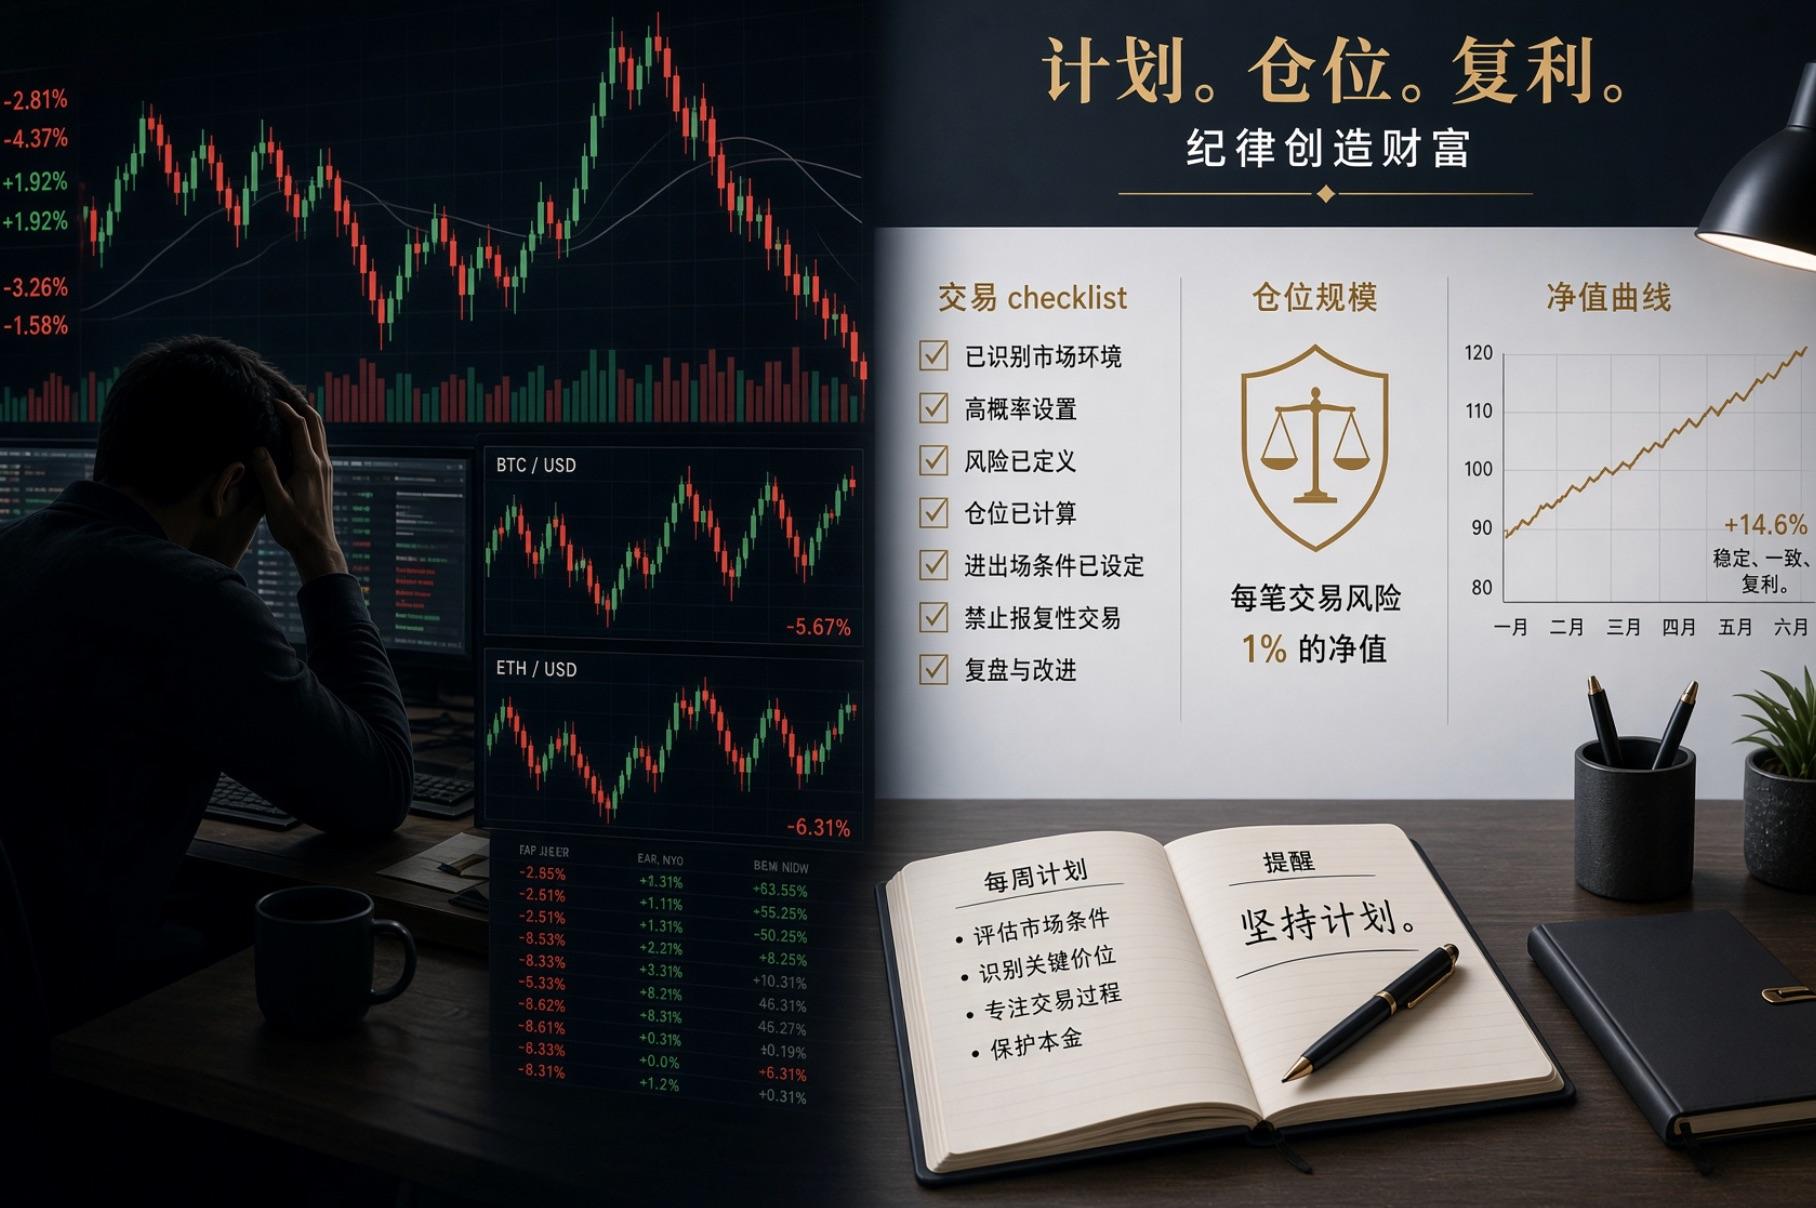
Many people study Chan theory, but few make money with it. This statement may sound unpleasant, but it is a fact.
I have seen too many people read "Chan Theory" three times, can recite the definitions of classification, strokes, segments, and centers, and talk about the first type of buying point with confidence. But when it comes to real trading, they still bear losses when they should stop loss, and they still indulge when they should exit.
The problem is not with the technique, nor with intelligence.
It lies in the fact that the vast majority of people misunderstand where the difficulties of Chan theory lie.
Article Outline
01
The difficulty lies in the chain, not in the concepts
02
Three reasons why learning still leads to losses
03
Classification rather than prediction
01 · WHY IT'S HARD
Why it's hard to learn: It's not the concepts that are difficult, but the length of the chain
Let's start with a counterintuitive judgment: each individual concept of Chan theory is actually not difficult.
The difficulty is that they must be strung together in order and according to rules, with each link connected to the next.
The real analytical chain is as follows: first handle the inclusions of K lines → find classifications based on the merged K lines → connect strokes based on classifications → calculate the characteristic sequences and segments from strokes → recursively derive the trend types from segments → identify centers within the trend types → finally assess divergence based on comparisons of the strength of entry and exit segments.
This chain has a fatal characteristic: if any link is approximated or substituted, everything that follows is wrong, and it may not be obvious.
If the inclusion relationship is handled incorrectly, the classification is wrong; if the classification is wrong, the stroke is wrong; if the stroke is wrong, the segments, centers, and divergences are all wrong—but the chart still looks beautiful.
This is the real threshold of Chan theory. It is not “I understand this concept,” but “I completed this chain step by step without skipping any links.”
Three specific difficulties
The first difficulty is that the handling of inclusions must be absolutely consistent. For the same market segment, how you handle the inclusions directly determines what the subsequent classifications, strokes, and segments look like. When drawing manually, it is very easy for people to be inconsistent here: it may fit today but not tomorrow, and during the review, even they cannot reconcile it.
The second difficulty is with segments, which is the easiest link to get wrong. The correct approach is to first calculate the characteristic sequences, consider the inclusion situation of the characteristic sequences, and then calculate according to whether there are gaps in the classifications formed by the characteristic sequences. Many simplified methods skip over “characteristic sequence inclusion” and simply connect the highs and lows.
The result is that the segments may appear correct, but under certain formations, systematic deviations can occur—you might have drawn it correctly for half a year until you encounter that formation, and then all your judgments are based on a false foundation.
The third difficulty is the lack of the comfort of having a “standard answer.” Strokes may have “old strokes” and “new strokes,” segments may allow for “one stroke forming a segment,” and how to merge centers—these already exist as differing schools of thought in the original text. Once you finish learning, you will find that different people give you different answers, and all make sense.
A system that requires you to make choices, where the choice affects all conclusions, is inherently more difficult to learn than a system where you just “follow the formula.”
02 · WHY IT WORKS
Why it's useful: It turns “fuzziness” into “verifiable”
Having discussed the difficulties, let's talk about why it is worth learning.
Let me illustrate with a specific scenario. Suppose you are currently judging whether a particular asset is about to reverse. Using traditional technical analysis, you might say: MACD has a high position death cross, volume is shrinking, and it may be at a top. Is this judgment correct? You can't verify it because it is based on “may.”
Chan theory approaches it differently. It will tell you: what kind of trend type is currently present; where the centers are and how many there are; what the strength of the exit segment and entry segment are; whether the divergence is established and what algorithm it is based on.
The key lies in this last sentence: what algorithm is it based on.
Chan theory's determination of divergence has at least three different methods: the area of the MACD column, the vertical heights of the entry and exit segments, and the high-low difference of the MACD yellow and white lines. These three methods often yield different conclusions.
When traditional technical analysis encounters this situation, it falls into mysticism—“I feel like there’s going to be a divergence.”
Chan theory does not. It lays out the data: the number of centers, entry segment strength, exit segment strength, the strength of the last segment and the antecedent three segments. You can verify it yourself, rather than just accept a conclusion of “it’s a divergence.”
This is the true meaning of “useful”: it does not guarantee you are right, but it guarantees you can find out why you are wrong.
A system that allows for error checking has a far greater long-term value than one that “can never clearly state right or wrong.” Because you can iterate from your mistakes, rather than spiraling in mysticism.
03 · WHY PEOPLE LOSE
Why after much learning still leads to losses: it does not resolve decision-making issues
This is the most crucial section of the entire text, and also the section that most people are reluctant to face.
The proportion of those who study Chan theory and can ultimately profit consistently is dismally low. The reasons are not complicated, and I will break them down into three points.
The first point: treating “definition problems” as “decision-making problems”
Chan theory clearly states in the original text that definitions: how to handle inclusions, how to calculate classifications, how to connect strokes, and how to define centers. These are things that can be left to rules; there is no need to reinvent them every day.
However, Chan theory never tells you whether you should buy, how much to buy, or what to do if you incur losses.
Many people who finish learning Chan theory develop a kind of illusion—“I understand the structure, so I know whether I should trade.” This is treating the map as the road.
Structural analysis answers “what is now,” not “what should I do.” Between these two things lies capital management, risk tolerance, holding period, and your own psychology.
The second point: treating “precision” as “effectiveness”
The most charming aspect of Chan theory is that it appears extremely precise: when to buy and sell, how many segments and strokes, with clear price levels.
But precision does not equal effectiveness.
A divergence calculated by the area of the MACD column and one calculated by vertical height may point to entirely opposite operations. At this moment, which one you choose is not something Chan theory can answer; it is a judgment you must bear yourself.
Moreover, divergences may fail, buying and selling points may become ineffective, and centers may be breached. Structural analysis describes trends that have already happened; it does not predict the future.
To treat “this position historically had buying points” as “this position will definitely rise now” is to confuse induction with deduction.
The third point: treating the precision of tools as one’s own discipline
This point is the most piercing.
Many people draw lines using Chan theory with extreme precision, without any mistakes, but then what? When it’s time to stop loss, they hold on because “the structure hasn’t changed yet”; when it’s time to exit, they cling because “there might still be another segment.”
Chan theory has provided them with an extremely refined rationale to rationalize their emotions.
This is the most dangerous state: it’s not that there are no methods, but that there is a seemingly flawless method that is used to justify erroneous decisions.
The more precise the tool, the easier it becomes to serve as a cover for psychological shortcomings.
04 · EAST VS WEST
The biggest difference from Western theory: one is classification, the other is prediction
This is the point I want to clarify the most.
Mainstream Western technical analysis—Dow Theory, wave theory, Gann, moving average systems, indicator systems—their fundamental assumption is “patterns will repeat.”
So what you see is that head and shoulders will fall, golden crosses will rise, and after five waves, there will be adjustments.
The underlying logic of this system is inductive: finding repeating patterns from history and then assuming they will reoccur.
The underlying logic of Chan theory is entirely different. It does not do this.
Chan theory categorizes.
Given a segment of movement, Chan theory does not predict where it will go next; instead, it classifies it: is this a trend or consolidation? Is this level at this level or at another? Has the center composition been completed? Is the divergence established?
What it provides is a coordinate system of structure rather than a directional roadmap.
“Western technical analysis asks how the next move will go, while Chan theory asks what this segment is now.”
This difference leads to two direct consequences.
The first consequence: Chan theory does not provide you with psychological comfort. Western theories will tell you “head and shoulders bottom, bullish,” and that can make you feel at ease to place an order. Chan theory will only tell you “this is a consolidation, the direction is undetermined”—no comfort, only facts. Many people can't continue learning Chan theory, not because it is difficult, but because it does not coddle them.
The second consequence: the precision of Chan theory is used for “positioning,” not “predicting.” Western theories pursue “accurate predictions,” while Chan theory pursues “clear classifications.” The former wins on hit rate and has nothing to say when it loses; the latter wins on retraceability because every judgment has evidence to check.
This is also why the high incidence of “learning Chan theory still leads to losses” exactly coincides with those who use it as a predictive tool. They come to learn with the question “how will it move next,” and after learning, they continue to ask “how will it move next,” only to find that Chan theory does not answer this question, then turn around and blame the theory for being useless.
∞ · POSTSCRIPT
My perspective
First, the threshold of Chan theory is not in understanding, but in the consistency of execution. Whether you can apply the same set of rules consistently over three years to handle inclusions, link strokes, and draw segments determines its value. If you can't do this, no matter how much you learn, it will only increase the topics for discussion.
Second, the greatest gain from learning Chan theory may not be buying and selling points, but “knowing where you are.” It forces you to translate “I feel like it’s going to rise” into “what level of trend this is, where the center is, and whether the divergence holds.” Even if the conclusions are the same, this process itself is training you.
Third, do not expect any theory to answer “whether to buy.” Chan theory, wave theory, and Dow all only answer “what is now,” not “what should I do.” What lies between them is the truly difficult part of trading.
Why can some people use Chan theory to achieve stable profits while others cannot? The difference does not lie in understanding Chan theory but in understanding oneself.
05 · RISKS
Risk Warning
This article discusses technical methods and personal observations, does not constitute any investment advice, does not constitute an offer or invitation, and the author does not promise any returns.
END
I am Zen Wuce, focusing on blockchain investment research and trading insights sharing.
If you found value in today’s article, feel free to like and share as we work together to cultivate trading awareness!
免责声明:本文章仅代表作者个人观点,不代表本平台的立场和观点。本文章仅供信息分享,不构成对任何人的任何投资建议。用户与作者之间的任何争议,与本平台无关。如网页中刊载的文章或图片涉及侵权,请提供相关的权利证明和身份证明发送邮件到support@aicoin.com,本平台相关工作人员将会进行核查。