Academician of the Coin Circle: On October 30, Bitcoin (BTC) formed a long lower shadow that swallowed three days of decline. Who is really leading this rebound?
I am still holding the position at 79800, with not much unrealized profit, about one thousand eight hundred points. This kind of market happens every day in the coin circle; the key is whether you have the patience to wait for it to come out. When it plummeted yesterday, someone in the comments was cursing me, saying I was bullish at half the mountain. I ignored him. In trading, right or wrong is not determined by a single candlestick; it's about whether your entire trading system can make money in the long run. I currently have my stop-loss at 80500, and even if it reverses back, I won’t be upset because the profit cushion is thick enough. Don’t follow my heavy positions; trade lightly according to the signals. Whether you make a lot or a little, it’s still profit. What the coin circle lacks the least is opportunities; what it lacks the most is the determination not to be washed out by volatility. Take it slow, don’t rush.
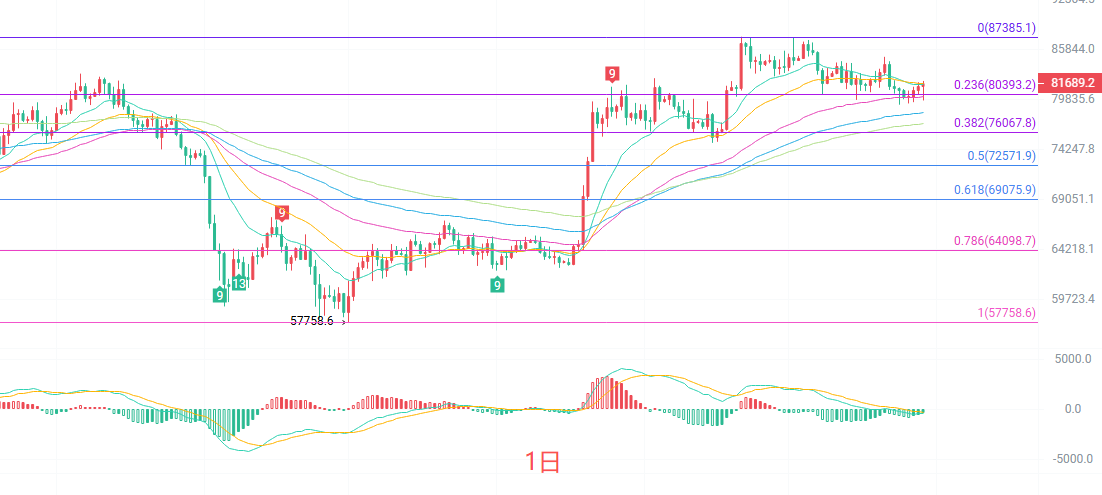
The daily candlestick closed with a bullish line with a long lower shadow. As for moving averages, EMA15 is at 81577, and EMA30 is at 81753, which is just above the current price, marking the short-term dividing line for bulls and bears; EMA60 at 80165 constitutes downward support. The MACD green bars are still present but noticeably shortening, indicating that bearish momentum is waning. The middle line of the Bollinger Bands at 81846 is a key resistance level, while the upper line at 83940 is still far away. Overall, the daily line is in a recovery phase after a sharp decline, and whether it can stabilize above EMA30 will determine the quality of this rebound.
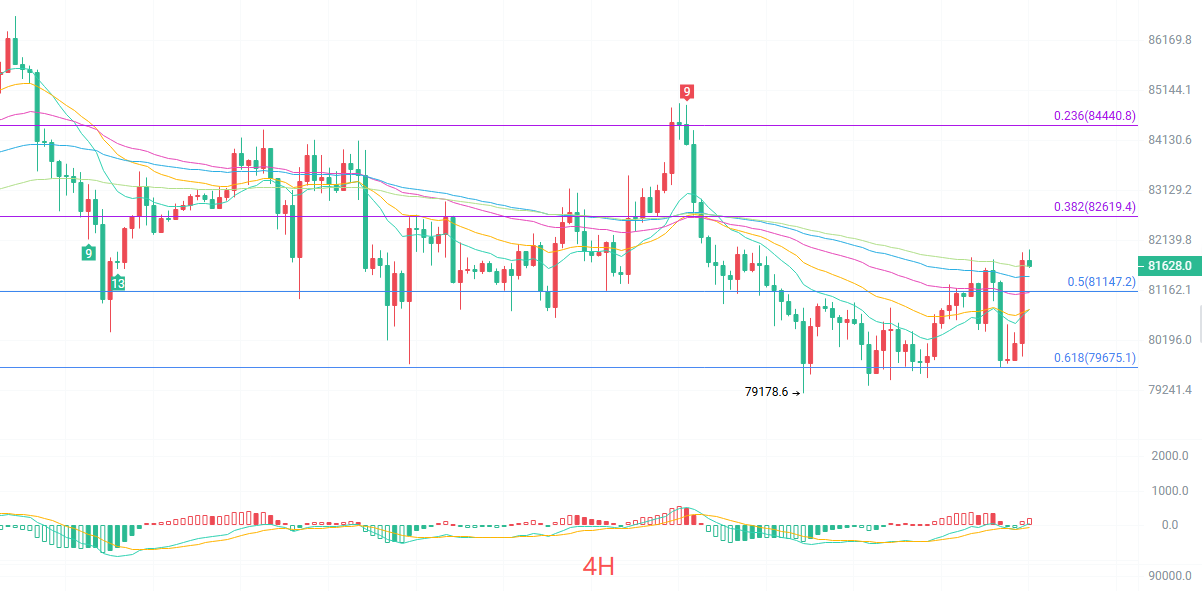
The four-hour candlestick was initiated from the long lower shadow at 79178. The TD nine turns at the bottom gave reversal signals at 9 and 13, and then it continuously closed bullish to reach 81631. In the moving average system, EMA15 at 80662 has already crossed above EMA30 at 80731 to form a golden cross, with the price standing above all short-term moving averages; however, the upper EMA60 at 81096 was just broken through, and EMA90 at 82407 is the next hurdle. The MACD bullish momentum is being released. The upper line of the Bollinger Bands at 81756 is just near the current price, indicating a short-term need for a touch on the line and a pullback.
Short-term reference:
If it rises from 81000 to 80500, it faces resistance. Stop-loss at 500 points, target looking at 82500 to 83000.
If it declines from 82500 to 83000, it faces stagnation. Stop-loss at 500 points, target looking at 81500 to 81000.
Specific operations should be based on real-time market data; for more detailed information, you can consult me. The article is published with a delay, so it is suggested for reference only, and risks are to be borne by yourself.
Kind Reminder: The above content is updated synchronously by the Academician of the Coin Circle on major trading platforms such as Binance, OKEx, Huobi, etc. For more content, you can add me as a friend in Binance and join my fan group.
免责声明:本文章仅代表作者个人观点,不代表本平台的立场和观点。本文章仅供信息分享,不构成对任何人的任何投资建议。用户与作者之间的任何争议,与本平台无关。如网页中刊载的文章或图片涉及侵权,请提供相关的权利证明和身份证明发送邮件到support@aicoin.com,本平台相关工作人员将会进行核查。