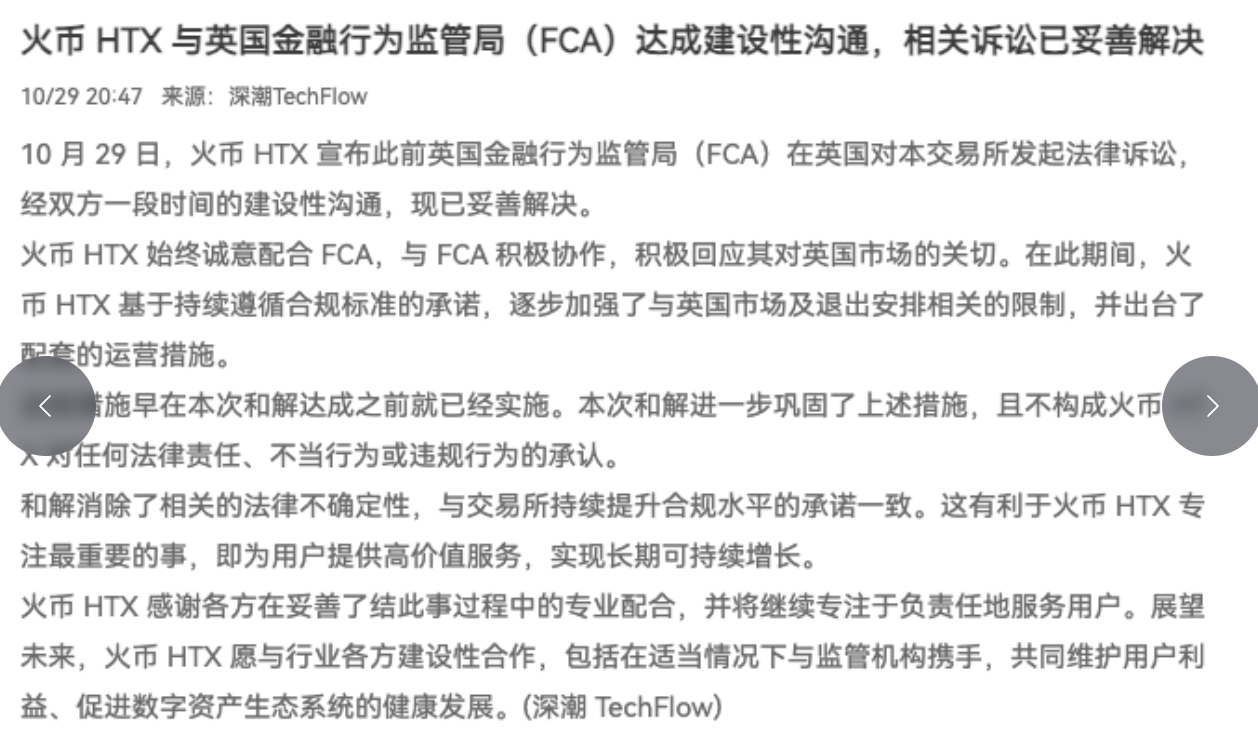
Let's start by discussing the two most critical news items. The first item is that the FBI has officially determined that the North Korean hacker group TraderTraitor is responsible for the $6 billion theft from Binance. Binance has already utilized 50% of the SAFU fund to cover losses and transferred 7,500 BTC from SAFU to replenish reserves. The impact of this news is not just in the amount but on the trust aspect; the narrative of exchange security has been severely damaged. The second item is that market expectations for a 25 basis point interest rate hike by the Federal Reserve in December have reached 70.7%. Combined with a 7.2% drop in the Philadelphia Semiconductor Index and Intel's largest single-day drop in 40 years, the macro environment for risk assets is clearly tightening. On one side, there is a crisis of trust in the industry, and on the other, liquidity expectations are turning. BTC is currently at 77728, and the pressure is very real.
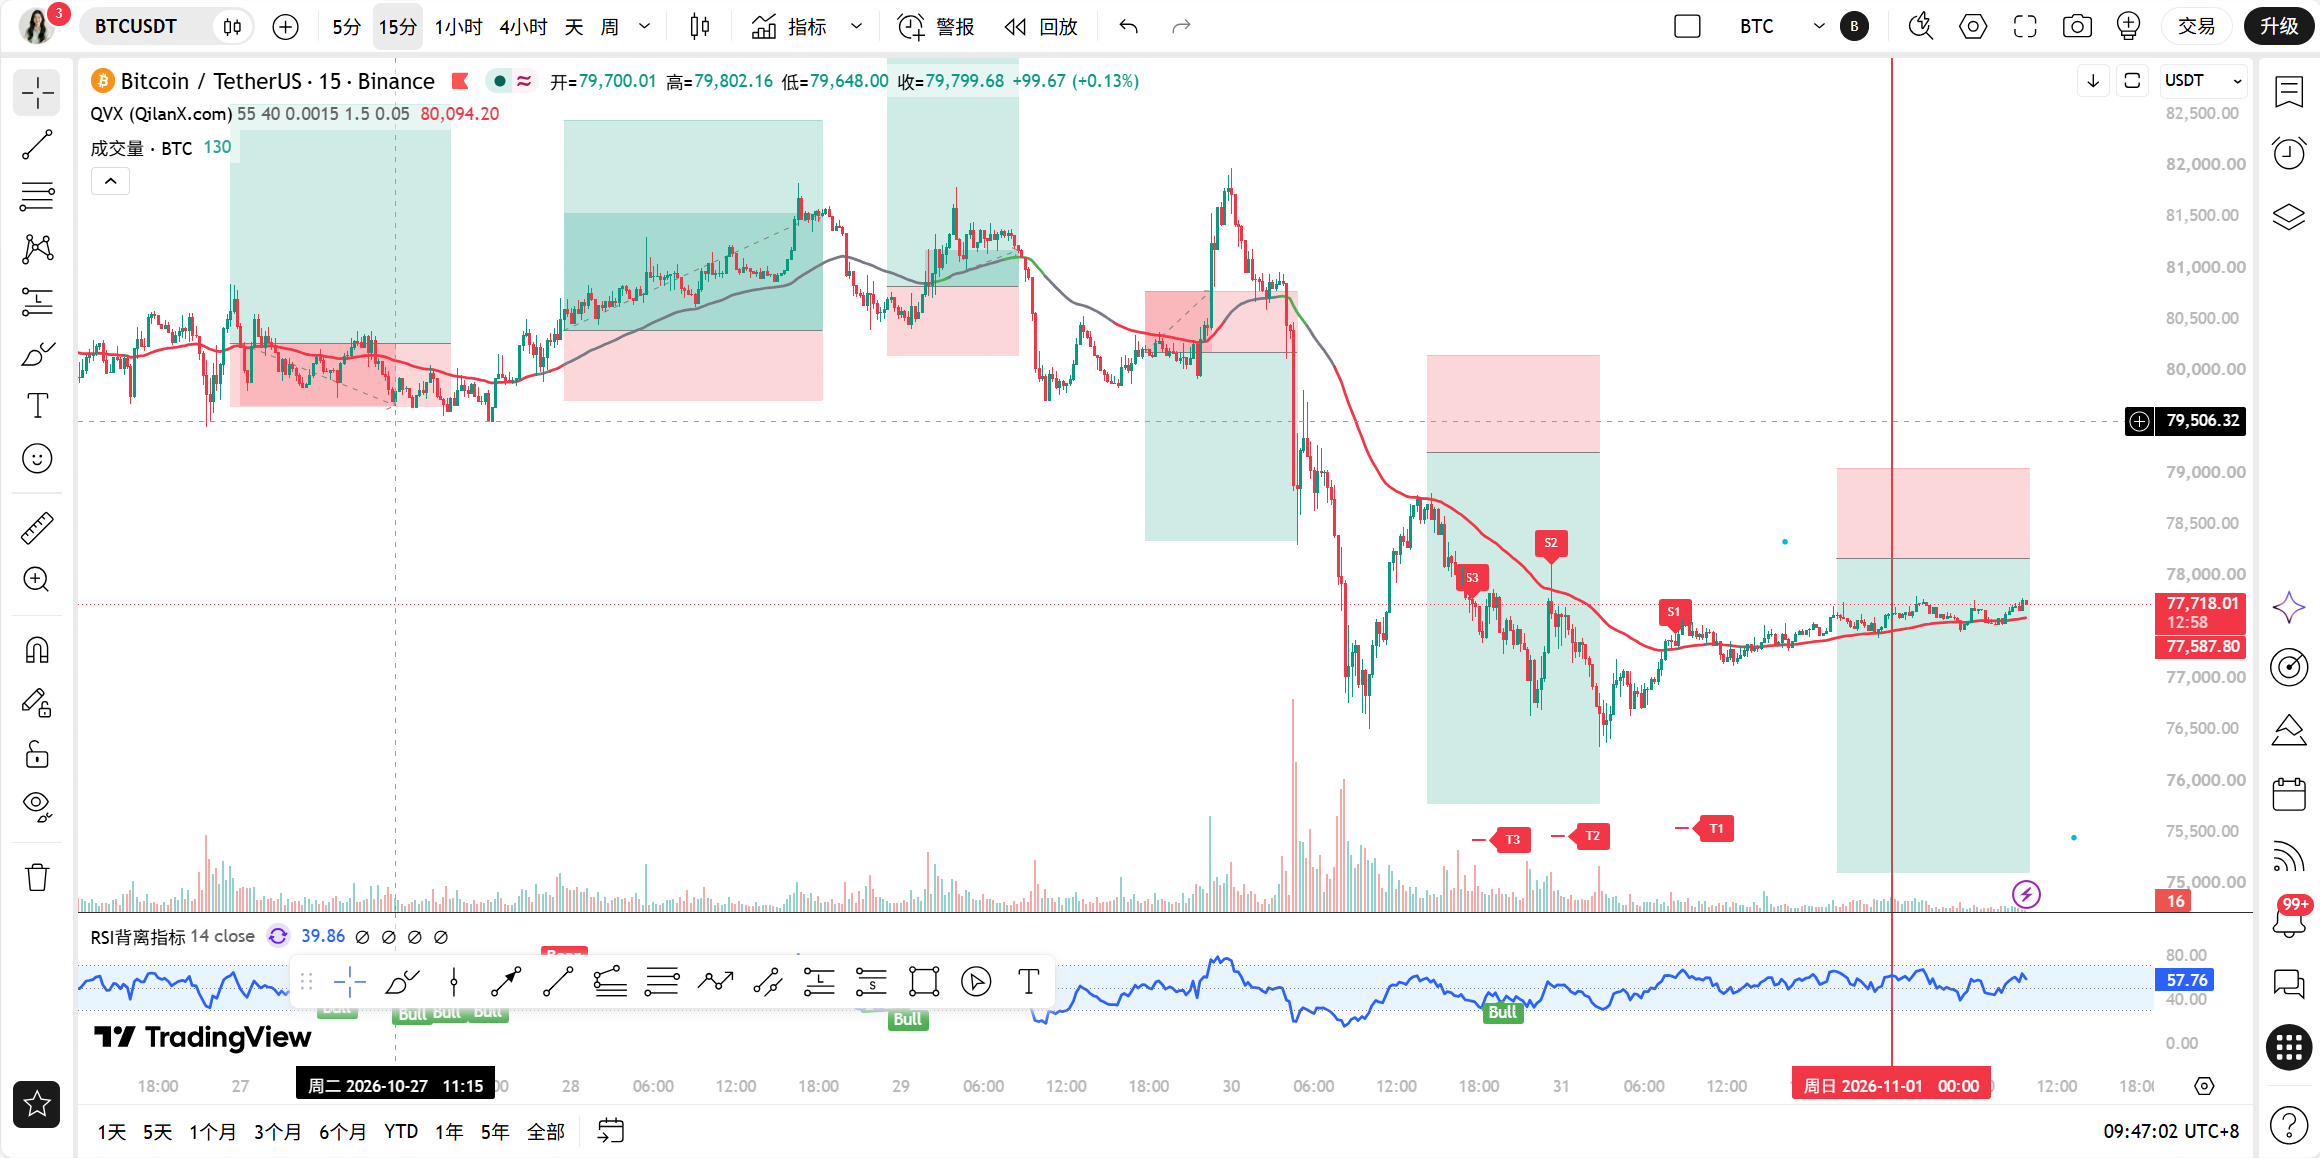
The current time is November 01, 09:50, BTC's latest price is 77728 USDT, with a 24-hour change of 0.42%. BTC's market share stands at 59.22%, and the Fear and Greed Index is at 34, indicating a state of fear. Note a detail: after the $6.3 billion theft from Binance, Bitcoin only dropped by 4%, which is relatively resilient given the magnitude of the event, suggesting that there is actually buying support below. However, resilience does not equal reversal; we still need to verify each point using the TPV system.
First, let's look at the multi-timeframe analysis. On the daily level, MA5 is at 78402.91, MA10 is at 79530.66, and MA30 is at 81900.86. The moving averages are clearly in a bearish arrangement. MACD shows a DIF of -1144.81, DEA of -652.09, and a histogram of -492.72, with green histograms still expanding. The daily RSI is at 31.41, close to oversold but has not entered extreme territory. The overall daily structure is clearly bearish, and any rebound is merely corrective in nature. The 4-hour level is interesting, with MA5 at 77628.04 and MA10 at 77460.03, with prices above these short moving averages, but MA30 is still high at 79265.62. The MACD has just formed a golden cross, with a DIF of -780.42, DEA of -795.20, and a histogram value of 14.78. The 4-hour RSI is only 24.57, indicating a typical technical correction after being oversold; the golden cross has just appeared, and momentum is very weak, so it can only be defined as the early stage of a rebound, not as a trend reversal. On the 1-hour level, MA5 is at 77646.17, MA10 is at 77636.60, and MA30 is at 77440.27. The short moving averages are starting to converge upwards. The MACD has a DIF of 13.50, DEA of -24.89, and a histogram of 38.39, with red histograms expanding. The 1-hour RSI at 55.25 is neutral with a bullish bias, but the critical dividing line, EMA55, is at 77993.35, and the current price of 77728 is still 265 points below it. On the 15-minute level, MA5 is at 77710.56, MA10 at 77646.92, and MA30 at 77617.80, showing a bullish arrangement in moving averages, and the MACD histogram is at 17.09 with continuing red bars, while the RSI is at 54.27. The short term appears strong, but the 15-minute time frame is just an executing period and does not change the larger directional trend.
Next, we will conduct the TPV signal verification, which is a core action that we go through every day in the Qinglan Crypto Classroom. First, let's assess the trend location; the current price of 77728 is less than the 1-hour EMA55 of 77993.35. According to the system rules, we are in a bearish trend area, and there is no dispute about this. The conditions for going long require three simultaneous fulfillments: First, the price needs to stay above the 1-hour EMA55, with two consecutive 1-hour closing prices above EMA55. There have been 0 out of 8 closing prices greater than EMA55 in the past 8 1-hour candles, with 0 crossover occurrences; this condition is completely unmet. Second, there needs to be a support stabilization; the 15-minute level indeed has short moving averages supporting it, but the 1-hour level has not shown effective long lower shadows or bottom confirmation. Third, declining momentum must be exhausted; the 1-hour MACD has expanding red bars, RSI has recovered from low to 55.25, indicating that momentum is indeed recovering, but only one of the three conditions is satisfied, so the long signal is not valid. As for the conditions to go short, the first condition that the price is under pressure below EMA55 is met. However, the second condition that pressure encounters resistance without clear long upper shadows or top confirmation is not satisfied, and the third condition of weak rebounds is also invalid, as the 1-hour MACD bars are still expanding and the 4-hour has just formed a golden cross. Therefore, the conclusion is very clear: currently, there is neither a qualified long signal nor a qualified short signal, and we are in a rebound correction phase under a bearish trend. Also, looking at the oscillation auxiliary data, the last 8 1-hour candle closing prices above EMA55 is 0/8, with 0 crossovers. The price's distance from EMA55 is 0.34%, not reaching the 0.3% oscillation threshold, and the system determines that current conditions do not satisfy the oscillation scenario, so it may be in a unilateral trend, indicating that the directional choice has not yet been completed; do not take positions prematurely.
On-chain and funding aspects contain substantial information. The Fear and Greed Index is at 34, indicating market sentiment is in the fear zone. Such a position often corresponds to two types of movements: either panic selling leads to a last decline, or emotional recovery brings a rebound. ETFs have seen a net outflow of $202.4 million this week; although IBIT has counterintuitively attracted $176.9 million, overall institutional demand is weak. The Bitcoin premium index on Coinbase has remained negative for 38 days, and buying power in the U.S. market continues to be sluggish, which is a fundamental flaw on the demand side. Another crucial data point to monitor is that Bitcoin short-term holder cost is approaching $76,000, which is a key test of holding confidence; dropping below this may trigger a chain sell-off. Additionally, NXTT plans to sell $450 million worth of Bitcoin, citing the Binance theft and quantum computing risks as reasons; such institutional sell-offs will increase short-term supply. On the positive side, Ethereum's staking volume has reached a historical high of 43.8 million coins, accounting for 35.9% of total supply. The reduction of locked assets in circulation serves as long-term support for ETH but has limited direct impact on BTC. Overall, the funding aspect leans bearish, with the only bullish logic being that limited drops indicate strong buying support.
I will provide very clear critical defense positions. The first resistance above is at 1-hour EMA55 at 77993, which is the dividing line for the TPV system, and failing to break above means all rebounds are corrections within a bearish trend; the second resistance is near daily MA5 at 78402; strong resistance is around 79265, which is the position of the 4-hour MA30. The first support below is at 77440, corresponding to the 1-hour MA30; the second support is near the short-term holder cost of $76,000, which forms a dual psychological and chip defense line; if $76,000 is broken, the next level should look for deeper liquidity vacuum areas. The current price of 77728 is precisely caught between the short moving average cluster and EMA55, with limited room above and below, and we are waiting for directional choice.
Here comes the trading strategy; team members, take note. Direction assessment: bearish in the larger timeframe, a rebound at the minor level, prioritize following the trend, do not chase long positions. Short selling plan: the entry conditions are two; first, a price rebound touches the area between 77993 and 78402 with a clear long upper shadow or top confirmation, and second, the 1-hour MACD red bars start to shorten or RSI recedes from a high position; only upon resonating both conditions can we enter; place stop-loss above 78650, with the first target at 77440 and the second at 76000. Long plan: only engage on confirmed right-side trades; entry condition is two consecutive 1-hour closing prices above 77993 without breaking the retest, while the 1-hour MACD red bars continue; set stop-loss below 77400, with the first target at 78402 and the second at 79265. If the price continues to range between 77440 and 77993, wait in cash; do not participate actively; grabbing orders during oscillation is the easiest way to lose money. In terms of position management, in this densely macro bearish environment, control single-bet risk to within 1% of total funds.
Risk warning in one sentence: the geopolitical variable of possible restoration of U.S. military strikes against Iran on November 4, combined with December rate hike expectations, any sudden news could cause technical positions to instantly become invalid; strict stop-loss must always be the priority.
Follow Qinglan Crypto Classroom to seize more trading opportunities! Welcome to visit the official website www.qinglan.org
📊 Qinglan TPV trading strategy backtest reference
🕒 Last backtest time 11-01 07:00:02
Total analysis: 4805 Backtests: 4796 Accuracy: 76.7% (3677/4796)
免责声明:本文章仅代表作者个人观点,不代表本平台的立场和观点。本文章仅供信息分享,不构成对任何人的任何投资建议。用户与作者之间的任何争议,与本平台无关。如网页中刊载的文章或图片涉及侵权,请提供相关的权利证明和身份证明发送邮件到support@aicoin.com,本平台相关工作人员将会进行核查。