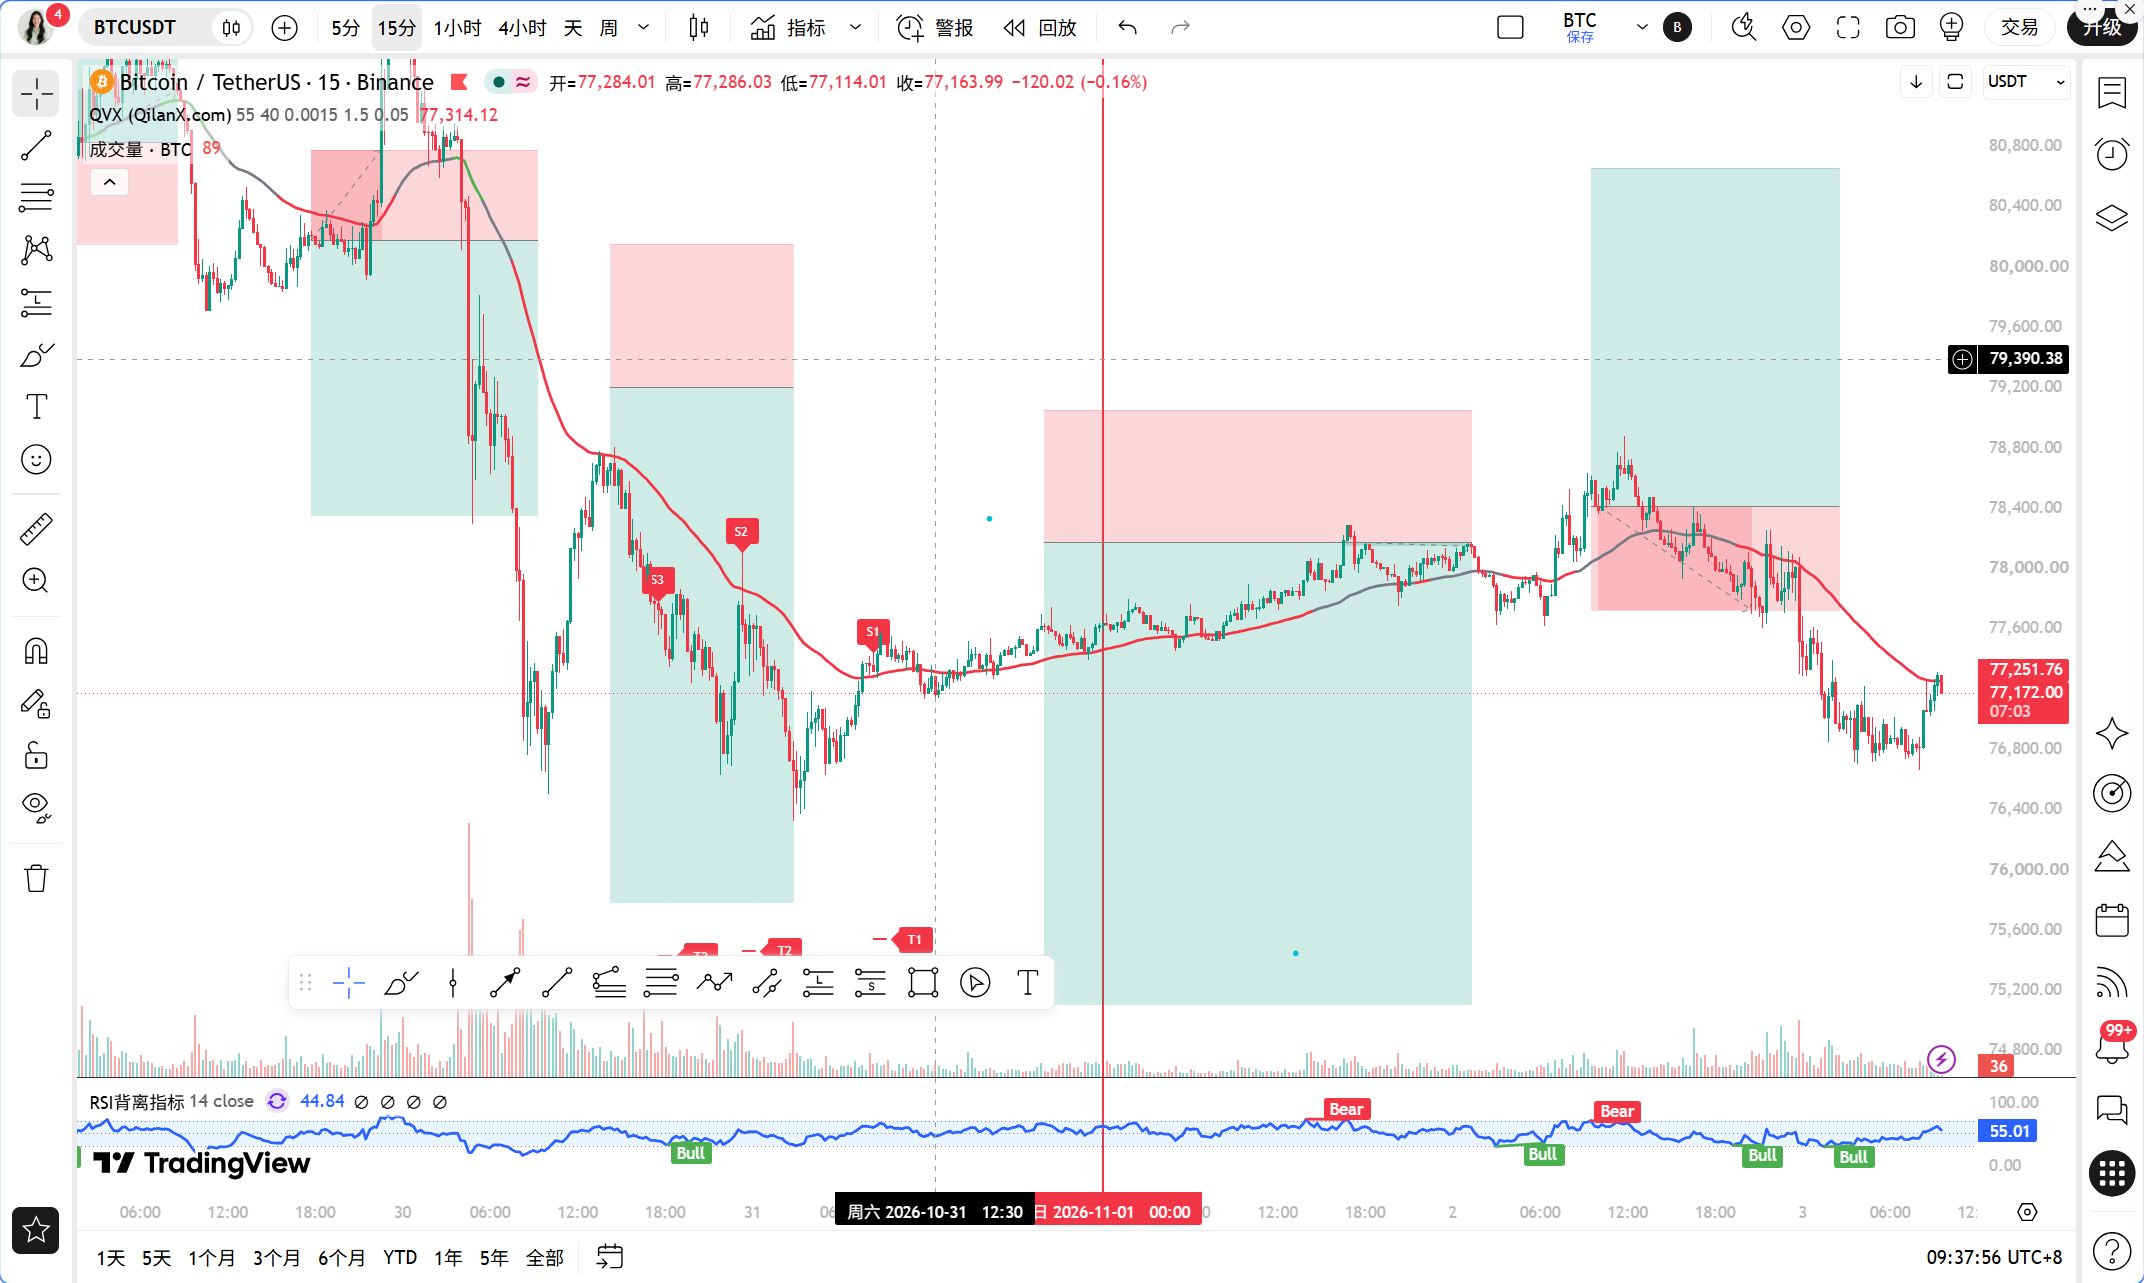
In the past 24 hours, the two most eye-catching news items in the market are that Binance experienced a net outflow of $5.8 billion in one day, and the Brazilian exchange Mercado Bitcoin was hit with a $46 million theft, leading to a pause in deposits and withdrawals while funds continue to move. Together, these two incidents point in the same direction: the trust cost of centralized platforms is being repriced. Interestingly, however, the market did not see a runaway selloff; the 24-hour decline for BTC was only 1.45%. Tom Lee even interpreted the Binance theft as a bullish signal, reasoning that the calm market response indicates that sentiment remains resilient. Sister Qinglan believes that panic is real, but the pricing of that panic has already moved ahead; the focus now is not on whether to be afraid, but whether the technical structure at this position still allows for further shorting.
Current Price and Time
As of November 3rd, 09:37, the BTC price is 77174 USDT. This price is 419 USDT away from the 1-hour EMA55 of 77593.18, a difference of about 0.54%, and it is below the moving average. The daily RSI has dropped to 27.58, which is clearly in the oversold range. The 1-hour RSI is 33.36, also low, while the 15-minute RSI has returned to 64.97, indicating that the short cycle has started to recover. This divergence of long and short cycle RSIs shows that the slope of the decline is slowing, but the trend direction has not reversed yet.
Multi-Cycle Status Overview
On the daily level, the price of 77174 is below the MA5 of 77458.97, MA10 of 78784.47, and MA30 of 81345.27, with a complete bearish arrangement of moving averages. The MACD histogram at -443.76 is still expanding below the zero axis, marking a standard bearish trend with no signs of turning bullish. The RSI of 27.58 only indicates a steep decline, not that the decline has ended.
On the 4-hour level, MA5 at 77299.95, MA10 at 77738.89, and MA30 at 78082.32 are all above the price. However, the MACD DIF at -469.64 and DEA at -469.93 are almost fused, with a histogram value of +0.30 just turning positive. This is the first signal of diminishing momentum at the 4-hour level. The RSI of 44.35 is in a neutral weak position, and the 4-hour is transitioning from a one-sided decline to low-level fluctuations.
On the 1-hour level, the price of 77174 is below the EMA55 of 77593.18, with MA5 at 76977.91 and MA10 at 77044.35 providing short-term support below the price, and MA30 at 77749.18 exerting resistance above. The MACD's DIF at -280.17, DEA at -237.31, and histogram at -42.86 are still negative but do not show large values; the RSI of 33.36 is weak, indicating a low-position consolidation in a bearish trend.
On the 15-minute level, MA5 at 77173.77, MA10 at 77016.80, and MA30 at 76946.29 show a bullish arrangement. The MACD histogram at +70.27 has clearly turned positive, and the DIF at 5.40 has crossed near the zero line. The RSI of 64.97 is strong, indicating a clear short-term rebound structure on the 15-minute chart.
When looking at all four cycles together, the daily and 4-hour are at low positions, the 1-hour is under pressure from the EMA55, and the 15-minute is rebounding. This is a typical recovery pattern at the end of a decline, not a trend reversal, but the risk-reward ratio for continuing to short is already poor.
TPV Signal Validation
First, let’s look at trend positioning. The current price of 77174 is below the 1-hour EMA55 of 77593.18. According to TPV system rules, prices below EMA55 are in the bearish trend zone; there is no dispute on this point.
Next, let's consider the conditions for going long. The first condition requires that two consecutive 1-hour candlesticks close above EMA55. Currently, there have been 0 out of 8 instances where the closing price was above EMA55, and no crossovers have occurred. This fails to meet the requirement. The second condition is for support to stabilize; the 15-minute level does show a short-term rebound structure, but the 1-hour level has not presented clear signals of a long lower shadow, bottom reversal, or strong volume. The third condition is for declining momentum to exhaust; although the 1-hour MACD histogram at -42.86 is not large in absolute terms, there hasn’t yet been confirmation of two consecutive periods of shortening, and the RSI 33.36 has not rebounded from below 30. None of the three conditions for going long have been met.
Now examining the conditions for going short. The first condition is that the price is under pressure below EMA55, with two consecutive 1-hour candlesticks closing below EMA55, which is satisfied. The second condition is encountering resistance; at the 1-hour level, there is indeed moving average resistance near 77593. However, the price is still 0.54% away from this level and has not yet reached a valid high point before falling back. The third condition is for weak rebounds; the 1-hour MACD histogram is still negative but has not shown consecutive shortening, and the RSI is rising from a low rather than falling from above 70, with no bearish engulfing patterns appearing. The shorting conditions meet the first condition, but the second and third are incomplete.
Regarding the oscillation judgment, the number of 1-hour closing prices above EMA55 over the past 8 candlesticks is 0/8, with no crossovers, and the price is 0.54% away from EMA55, which is above the 0.3% oscillation threshold. The system judges that the current conditions do not meet the criteria for oscillation and may be in a one-sided trend. However, Sister Qinglan wants to remind us that this one-sided trend is downward, and the downward momentum is decaying at the 4-hour level. Thus, a more accurate description is that this is the late stage of a bearish trend, rather than the mid-stage.
On-chain/Funding Conditions
The Fear and Greed Index is at 26, in the fear zone. Historically, this reading often corresponds to a stage of low prices, but fear can become more intense, and one cannot rely solely on this indicator to bottom-fish. The market share of BTC is 59.28%, and there is no significant capital flow moving to altcoins, indicating that the market is still in a defensive mode. Binance saw a net outflow of $5.8 billion in 24 hours, while OKX experienced a net inflow of $410 million, indicating that funds are moving between exchanges rather than exiting the market. This is a redistribution of liquidity rather than a complete withdrawal. Circle minted 1 billion USDC on Solana in ten minutes, increasing the supply of stablecoins. The subsequent movement of these funds is worth monitoring; if they flow into exchanges, it becomes buying power; if they remain on-chain, it indicates cautious capital. Strategy has added 810 BTC, increasing total holdings to 849,000 BTC. BitMine added 8,573 ETH; institutions continue to buy amid panic, which is a signal that should not be overlooked.
Key Defensive Positions
The first line of defense above is the 1-hour EMA55 of 77593. This is the demarcation line between bullish and bearish according to the TPV system. If the price cannot rise above it, any rebound will be a repair rather than a reversal. The second line is the 1-hour MA30 at 77749 and the 4-hour MA10 at 77738; these two positions almost overlap to form a dense resistance area around 77740. The third line is the daily MA5 at 77458, and note that this position is below the EMA55, indicating that the daily short-term moving average has been broken. A rebound to around 77458 will encounter the first wave of selling pressure.
The first support below is the 15-minute MA30 at 76946 and the 1-hour MA5 at 76977, forming a short-term support zone around 76950. The second is around the integer level of 76500, which acts as psychological support. The third is the mentioned 75000; if BTC drops below 80,000 and cannot hold 75,000 amid the panic selling wave, the next level to watch is around 74000.
Trading Ideas
Direction: Currently, the TPV system indicates a bearish trend zone, but the three conditions for shorting are incomplete while all three conditions for going long are unmet, leading to a signal vacuum period. Sister Qinglan's directional judgment is to wait for a confirmation of long signals and not to actively short.
Long Entry Conditions: Three confirmations must be seen simultaneously. First, two consecutive 1-hour candlesticks must close above EMA55 of 77593. Second, a retest must not drop below 77400 and should show either a bottom formation or a long lower shadow. Third, the 1-hour MACD histogram must show consecutive shortening and turn positive, or the RSI must rise from around 33 and stand above 40. Once all three conditions are met, enter the market; do not make a move if any one is missing.
Short Entry Conditions: If the price rebounds to around the dense resistance zone of 77740, showing a long upper shadow or a top formation, and the 1-hour MACD histogram expands again with the RSI falling from high levels, one can consider taking a small short position. However, this is against the direction of 4-hour momentum decay, hence the position should be kept minimal.
Stop Loss Settings: The long stop loss should be placed below 76900, that is, below the 15-minute MA30 and the 1-hour MA5, with a drop below indicating the failure of short-term support. The short stop loss should be placed above 77900, with a positioning above the dense area of the 4-hour MA10 and the 1-hour MA30 indicating that pressure has been broken.
Target Levels: For longs, the first target is the EMA55 at 77593, the second target is the dense resistance area at 77740, and the third target is the integer level of 78000. For shorts, the first target is the short-term support at 76950, the second target is 76500, and the third target is 75000.
Risk Warning
The daily RSI at 27.58 can remain oversold for a long time, and the fear index at 26 can intensify; until the TPV system gives a signal, any bottom-fishing is speculative rather than trading.
Follow Sister Qinglan’s Crypto Classroom to grasp more trading opportunities! Welcome to visit the official website www.qinglan.org
📊 Qinglan TPV Trading Strategy Backtest Reference
🕒 Last Backtest Time 11-03 07:00:01
Total Analysis: 4848 Backtest: 4839 Accuracy: 76.4% (3696/4839)
免责声明:本文章仅代表作者个人观点,不代表本平台的立场和观点。本文章仅供信息分享,不构成对任何人的任何投资建议。用户与作者之间的任何争议,与本平台无关。如网页中刊载的文章或图片涉及侵权,请提供相关的权利证明和身份证明发送邮件到support@aicoin.com,本平台相关工作人员将会进行核查。