The following market conditions and screenshots are from the historical market on November 2, 2026, and are not real-time data.
I have previously discussed four fundamental laws of volume-price analysis: large volume increases, small volume increases, large volume decreases, and small volume decreases. I have also emphasized that our research institute has always believed that the core essence of volume-price is actually market divergence — transactions occur only in the presence of divergence, and when the divergence is significant enough, trading volume will naturally increase.
Today, we will further dissect this logic by directly combining it with the market situation of that day to see where the volume-price state had progressed at that time. First, let's open the 5-minute candlestick chart of BTC.
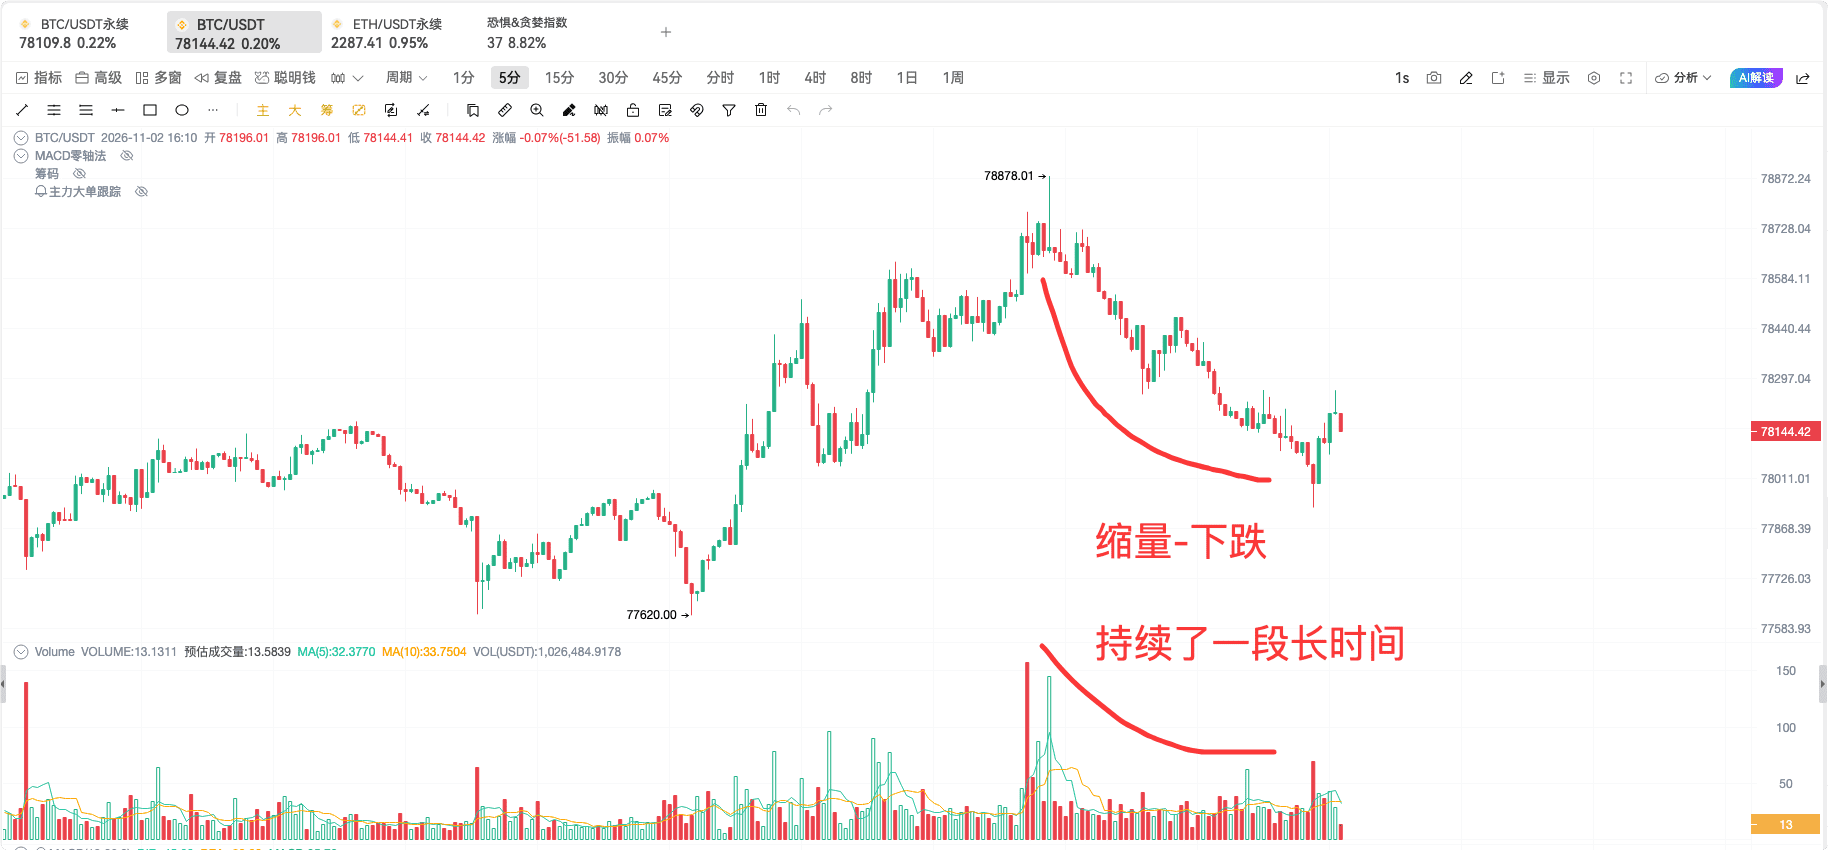
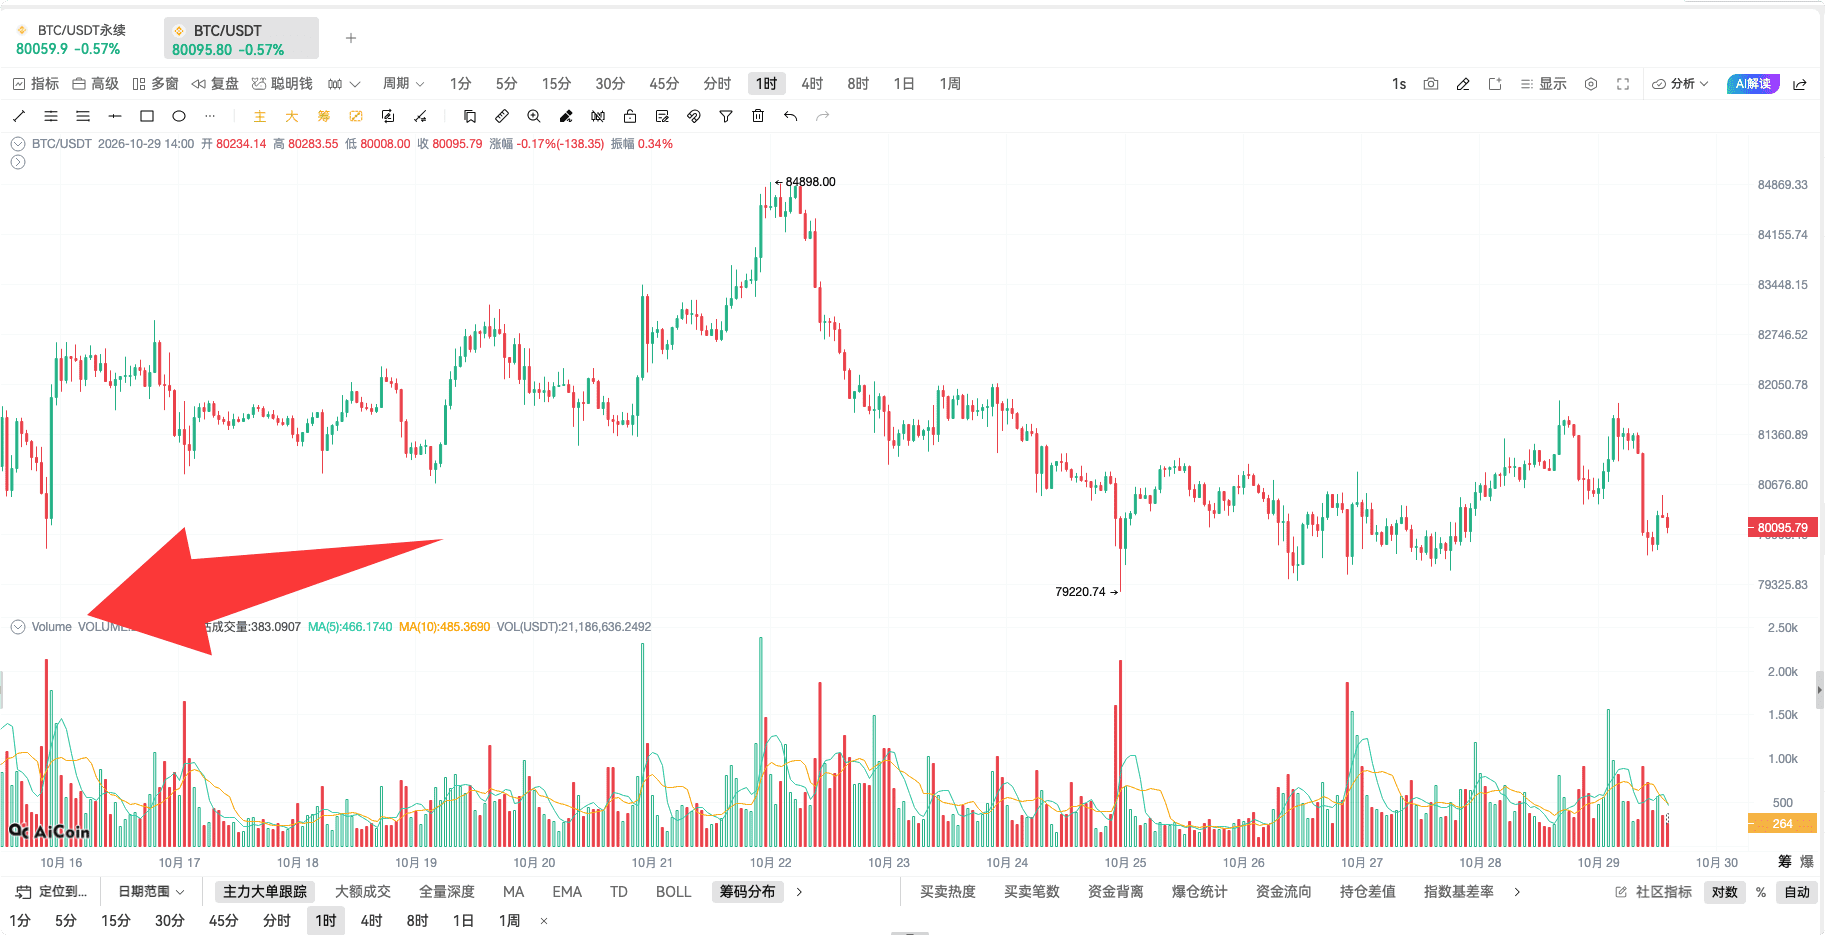
Let’s start with small volume declines. Our judgment logic is that during this stage, market divergence is minimal, with both bulls and bears not taking strong actions, so the trend often persists for a longer time until there is a significant change in volume. The moment this change occurs is often a noteworthy signal window for bottom fishing. You can see the changes in trading volume at that time.
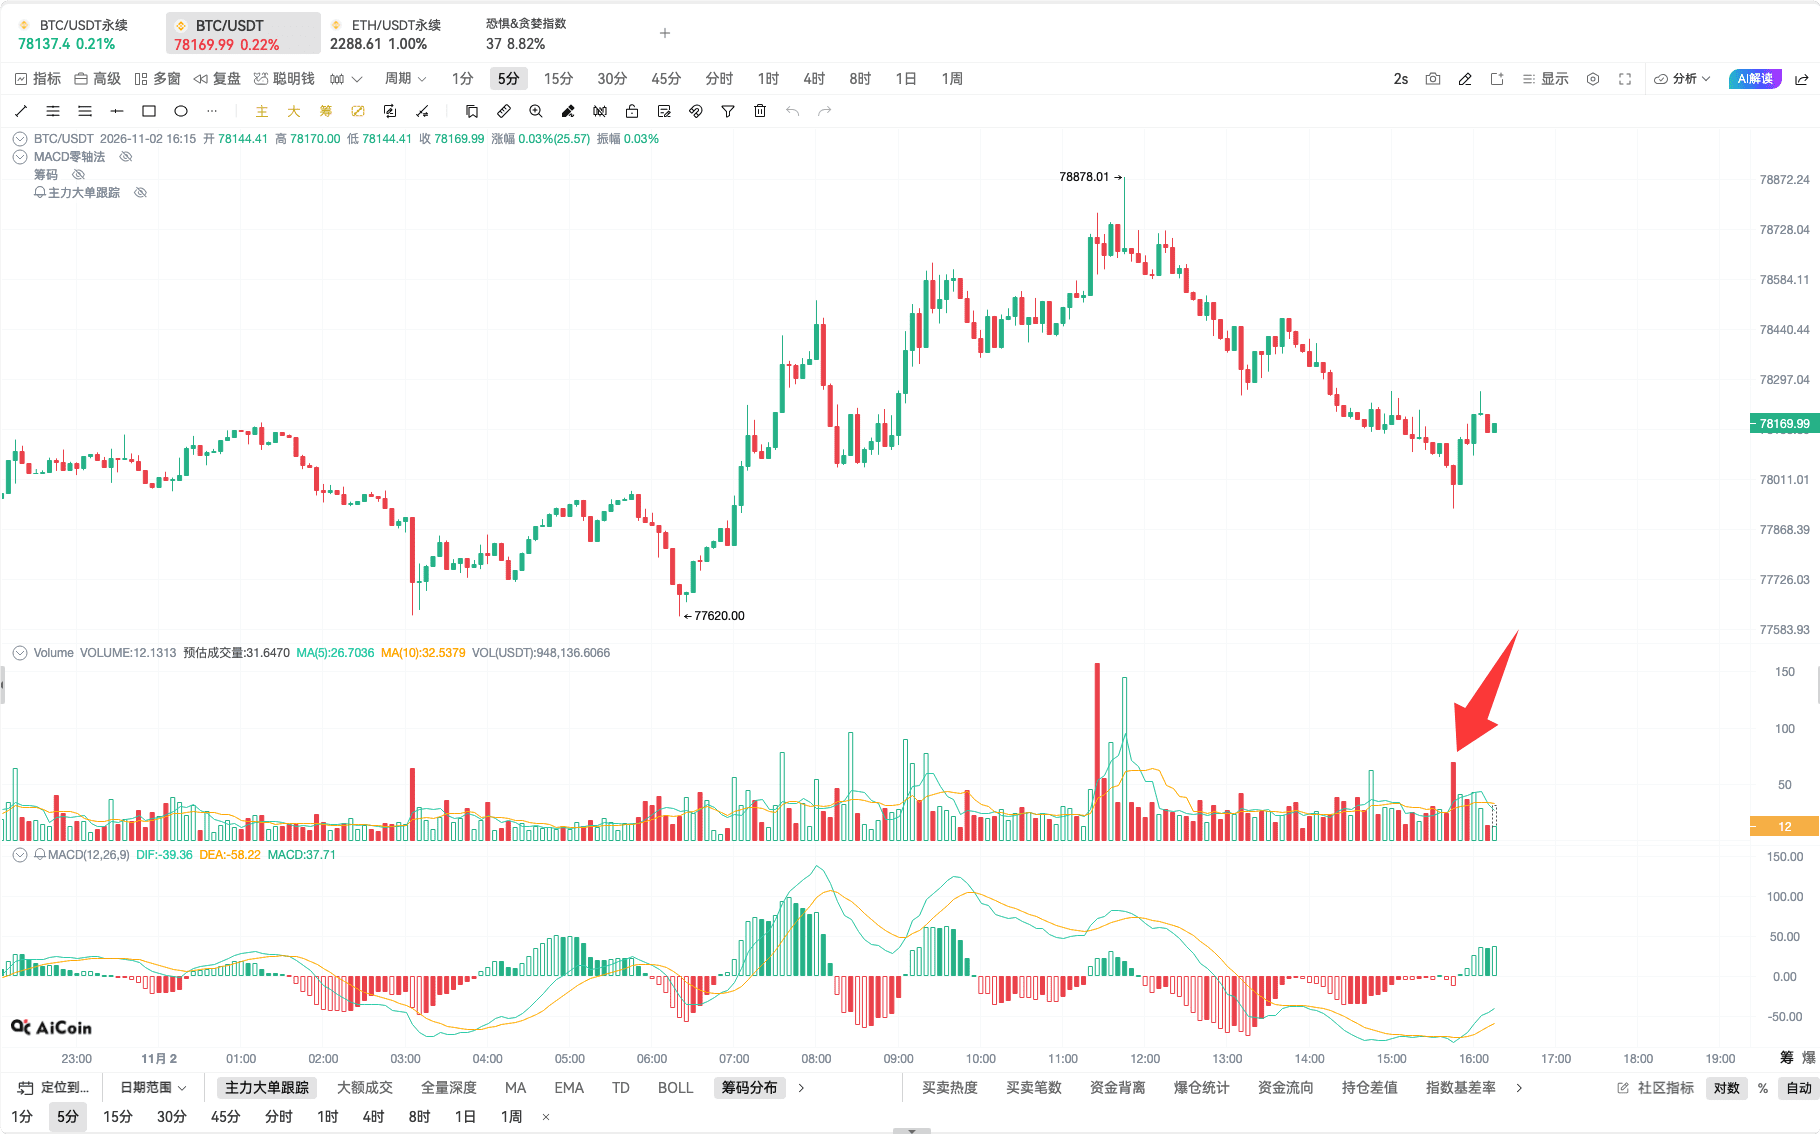
At that time, the volume change was not particularly drastic, but signals of slight anomalies were already visible. Looking at the volume and the candlestick pattern together makes it clearer: this is a candlestick with a long lower shadow, where the market was initially releasing selling pressure downwards, but trading volume suddenly expanded, forming a hammer pattern with a downward pin, though this "hammer" cannot be considered particularly standard.
This reflects the amplification of divergence: some are selling off in bulk, but simultaneously, there are buying orders supporting the price back up. From a volume-price perspective, the support strength at this position is quite strong.
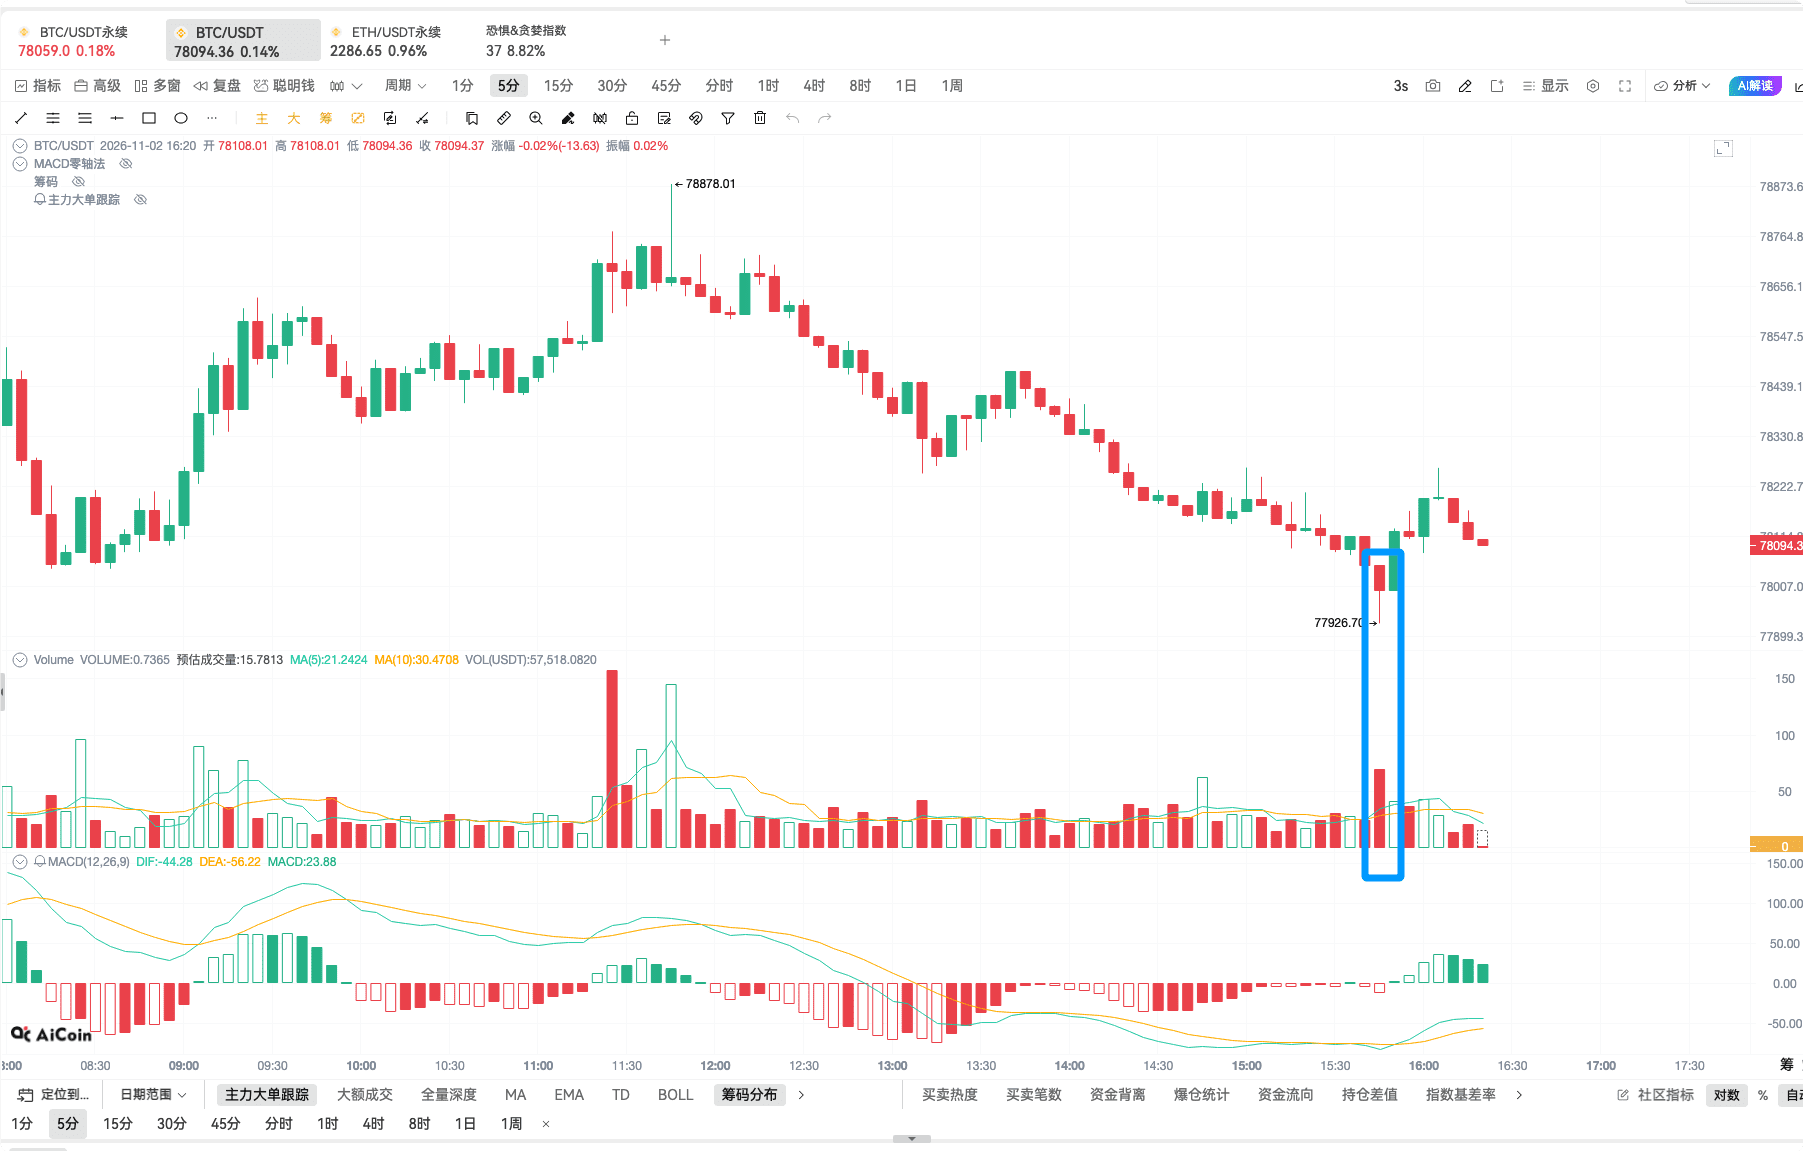
The position of this candlestick is the point of volume change during the small volume decline phase, and it is also a volume-price node where one can observe rebound opportunities.
The above analysis is based on fundamental volume-price theory regarding the market situation at that time. Now, let’s cross-examine it with AiCoin’s main large order and chip data to see if there are any supporting data points. First, we will retrieve the main large order data.
From the main large order data of BTC, there were large unmatched orders at both the upper and lower levels.
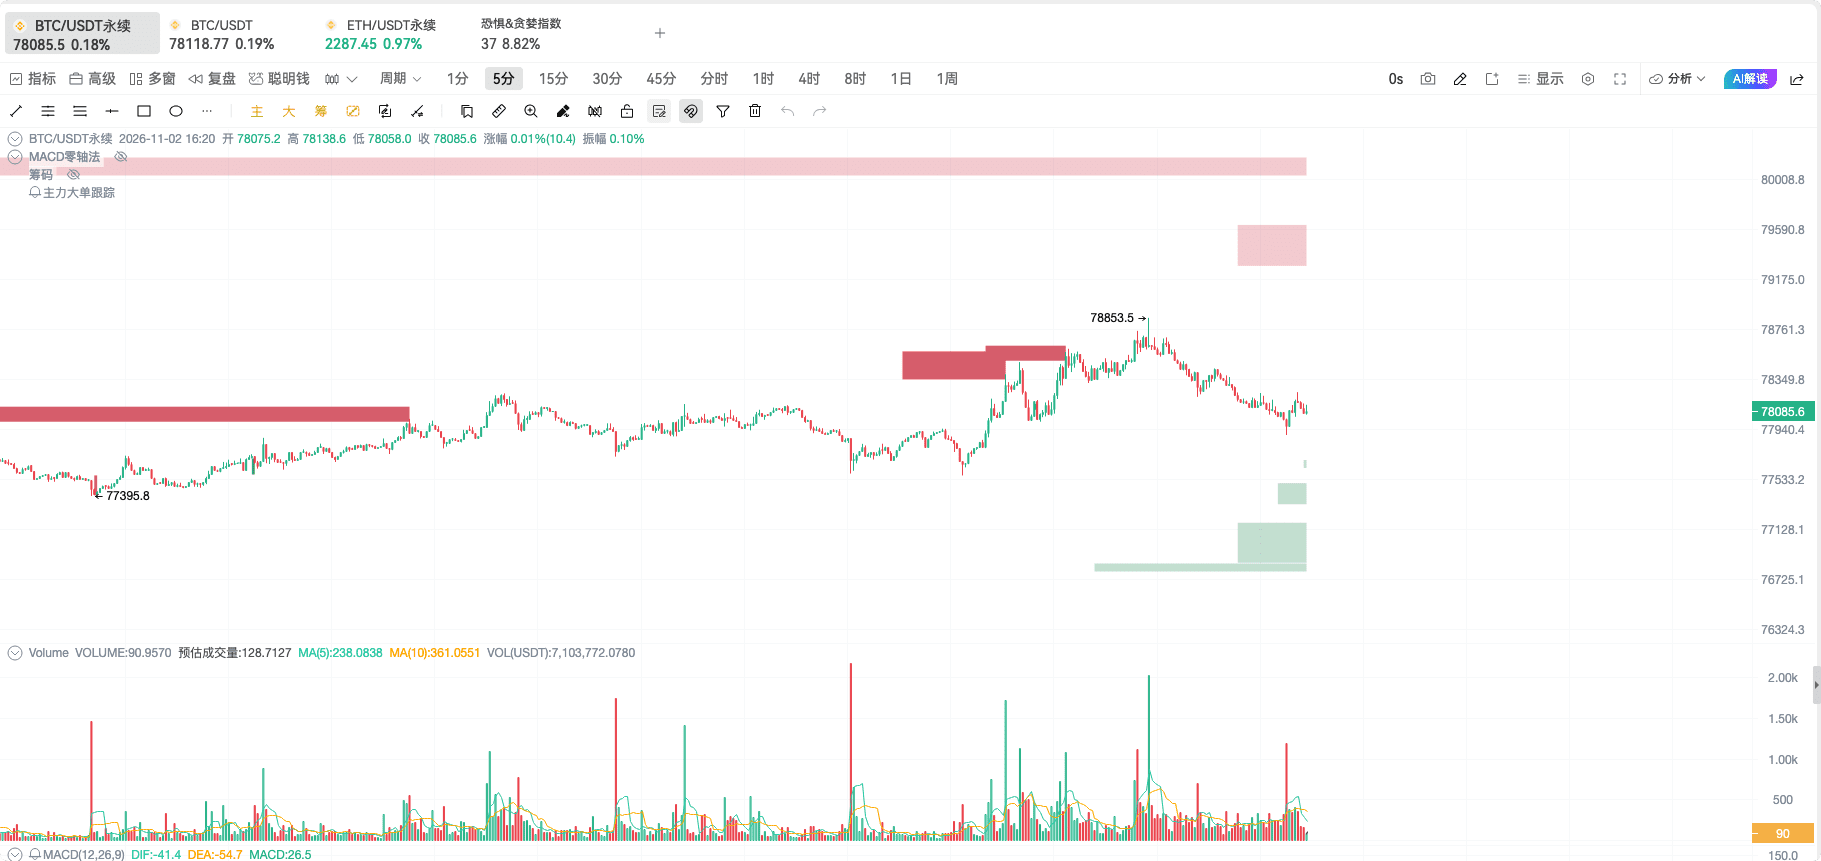
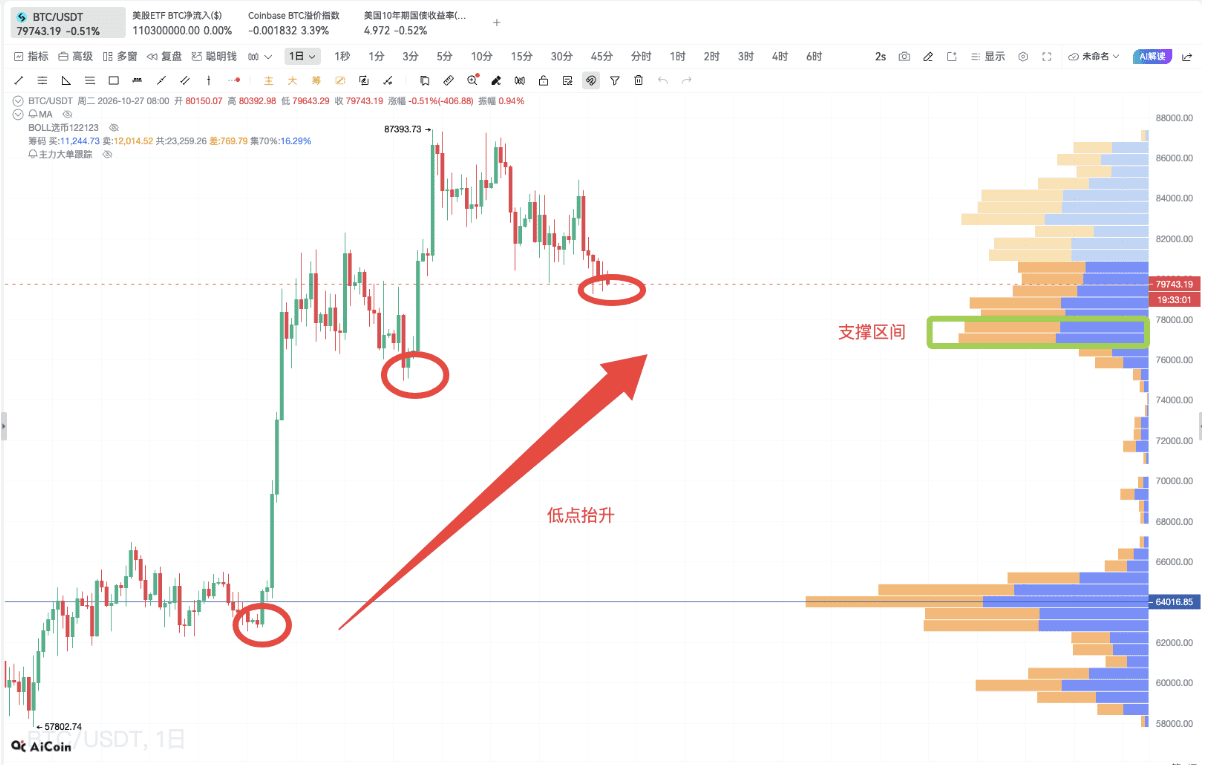
At that time, the main large order data did not show any new real-time anomalies. Let’s take a look at the chip distribution to see if we can find corresponding positions.
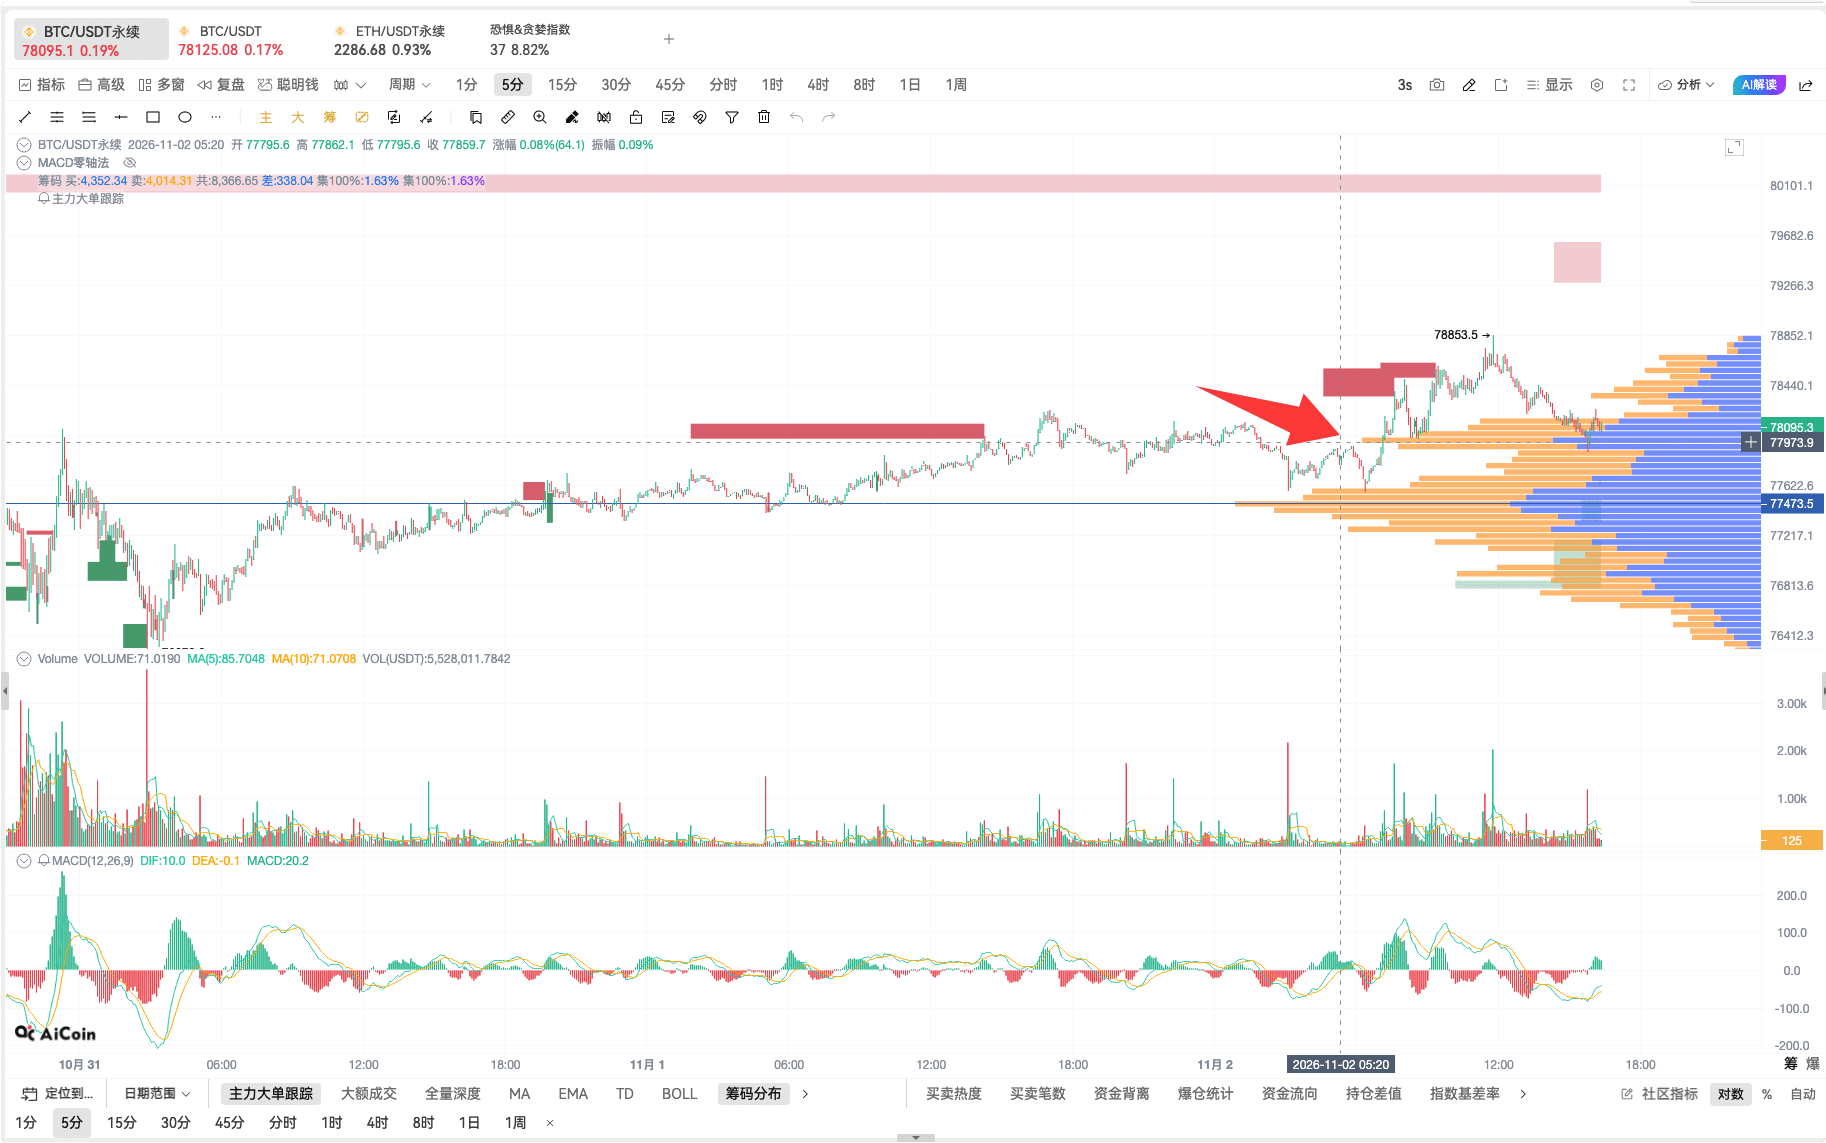
The position where BTC experienced a significant change in volume coincides with the range of the chip peak. The fact that the volume anomaly and chip peak fall within the same range makes me more concerned about the support situation here. However, the chip peak itself cannot prove that the support is necessarily effective; it still depends on whether the price can stabilize.
Below are my main large order parameter settings for your reference.
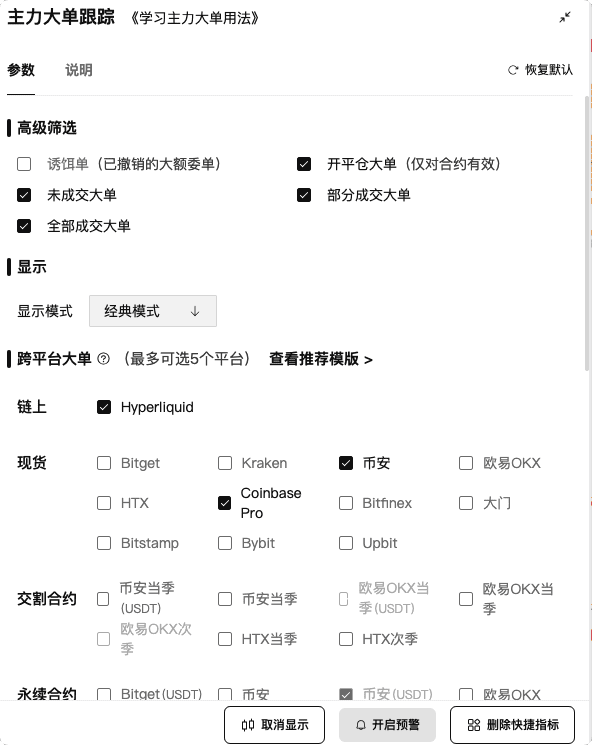
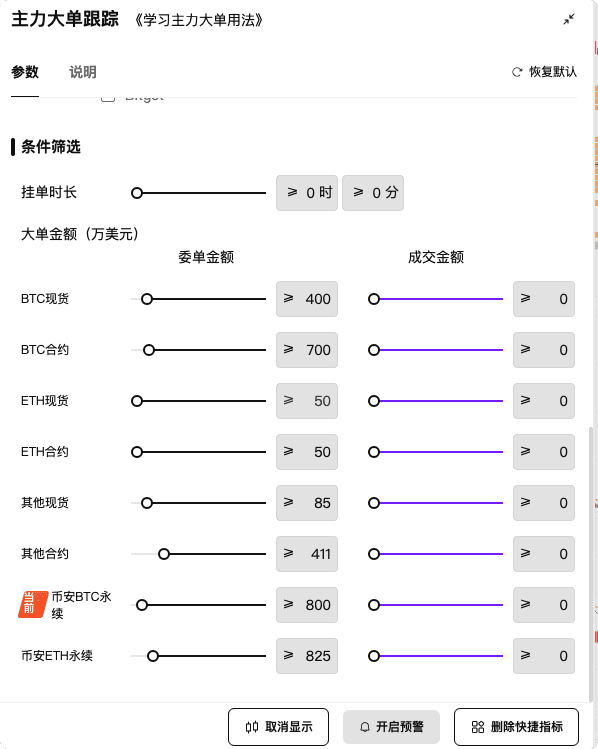
After looking at BTC, let’s apply the same volume-price method to ETH to see if it applies.
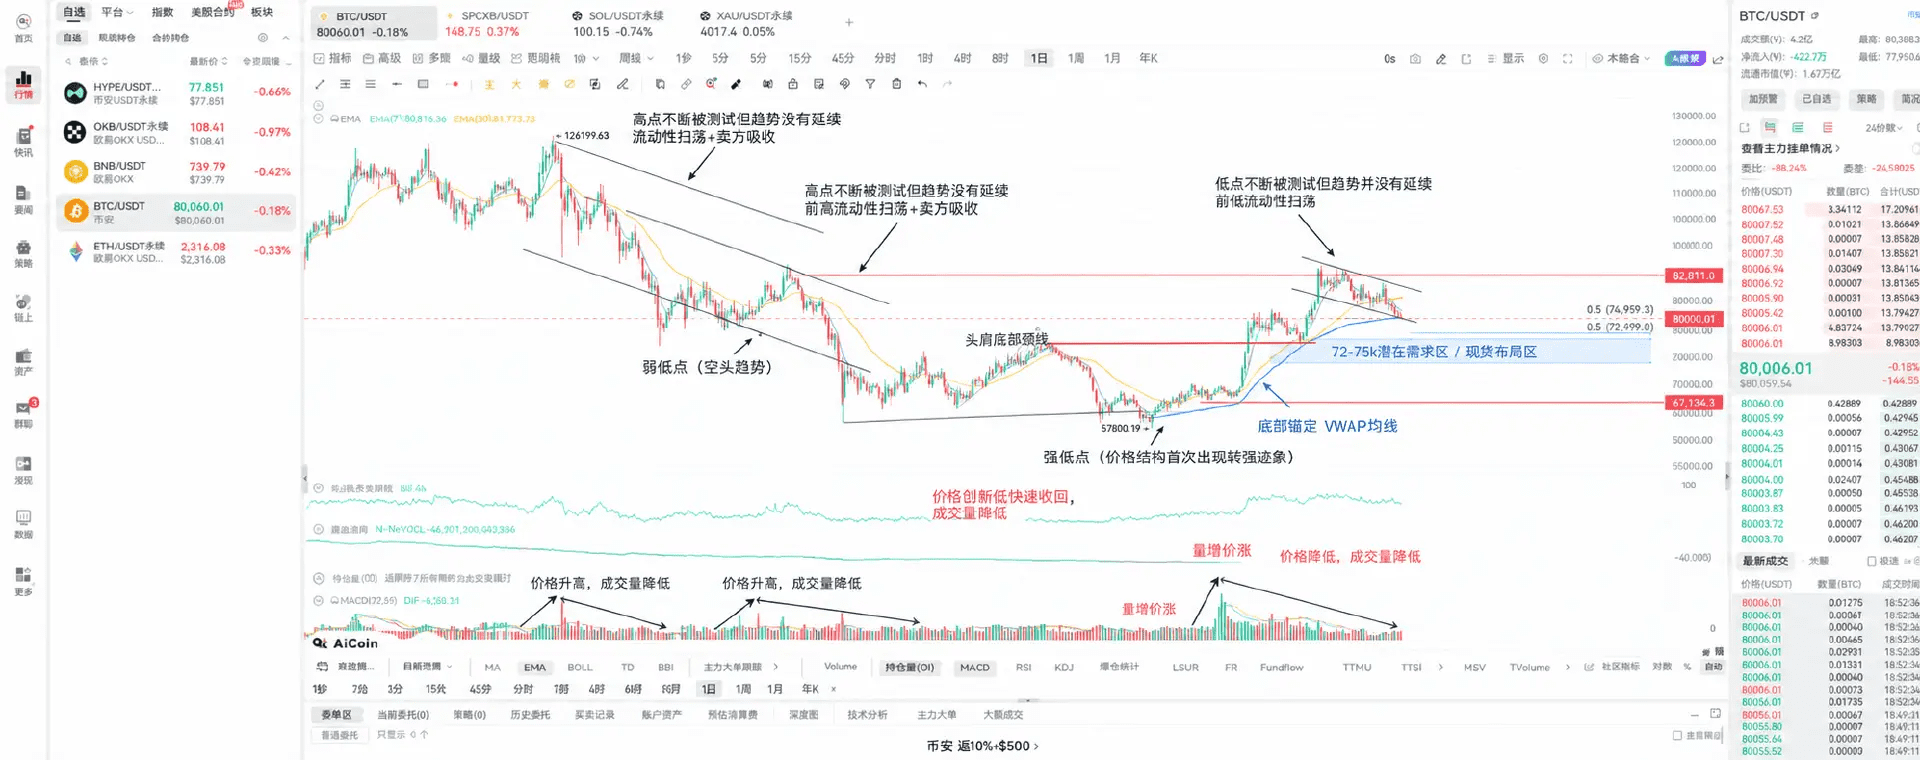
At that time, the market condition of ETH was a moderate increase in volume during a downward trend.
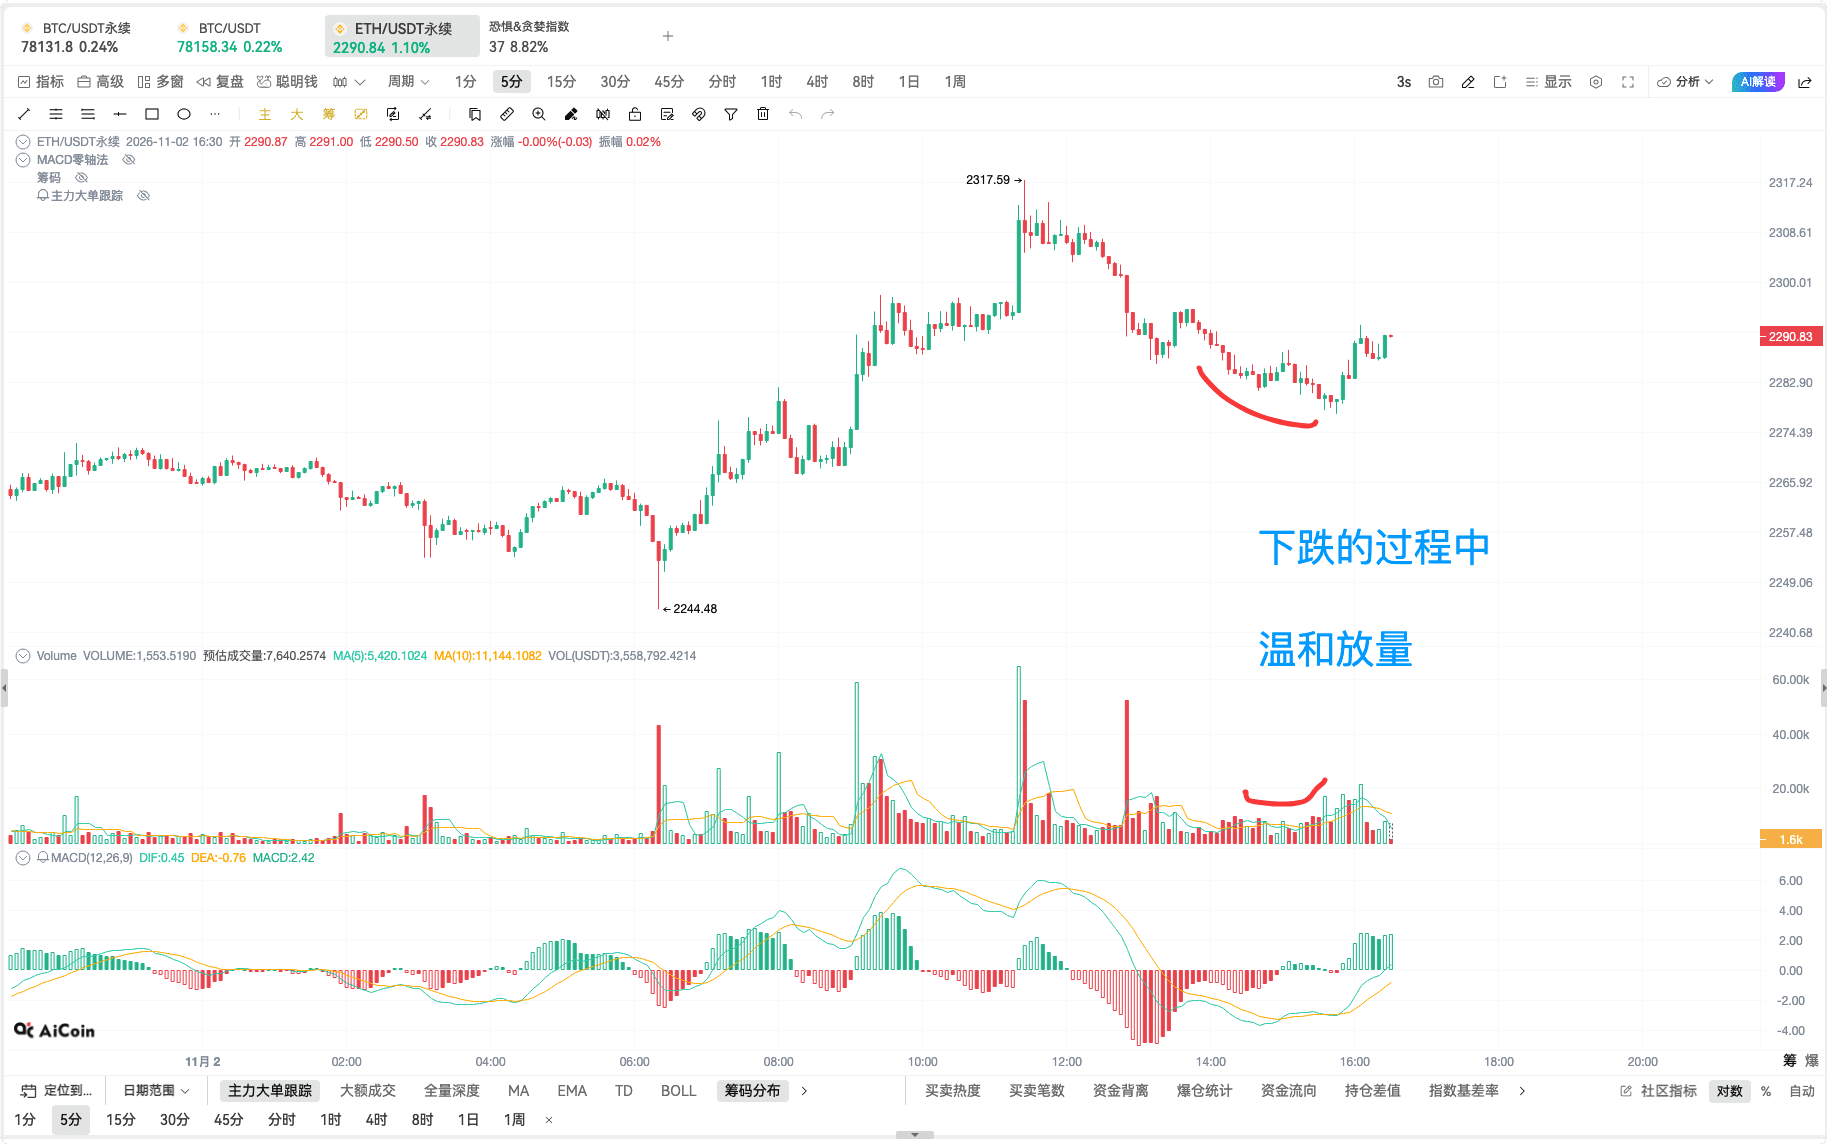
The characteristics of the volume change were not obvious. Such a moderate volume increase usually leads to less intense short-term fluctuations, but it lasts for a longer period. At that time, the market was already in a rebound process.
We also examined the volume-price performance along with the large order data. From the latest main large order data, during the upward rebound, a large short order amounting to tens of millions was just completed.
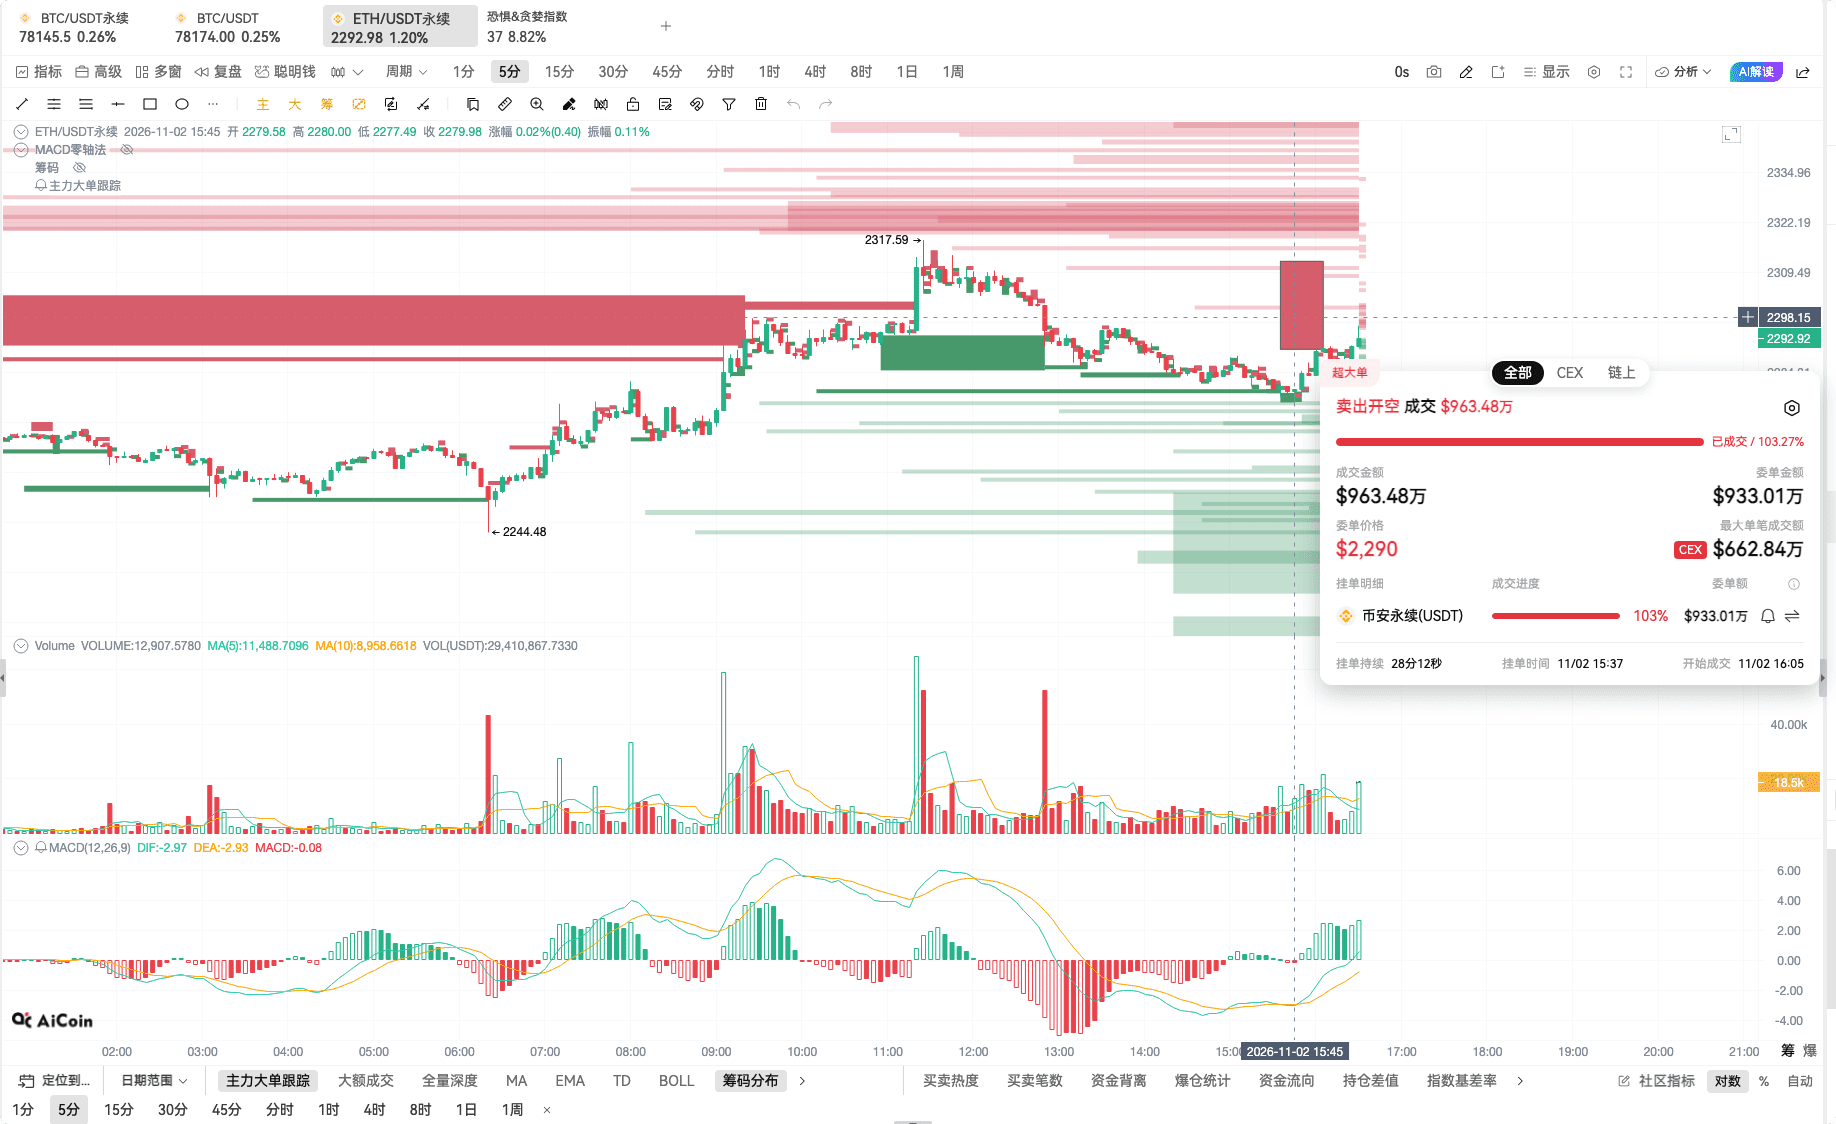
Meanwhile, at lower levels, there was still an unmatched large buy order amounting to tens of millions. Here, it’s worth noting that unmatched orders do not equate to final executions and can only serve as a reference for the willingness to accept at the current level.
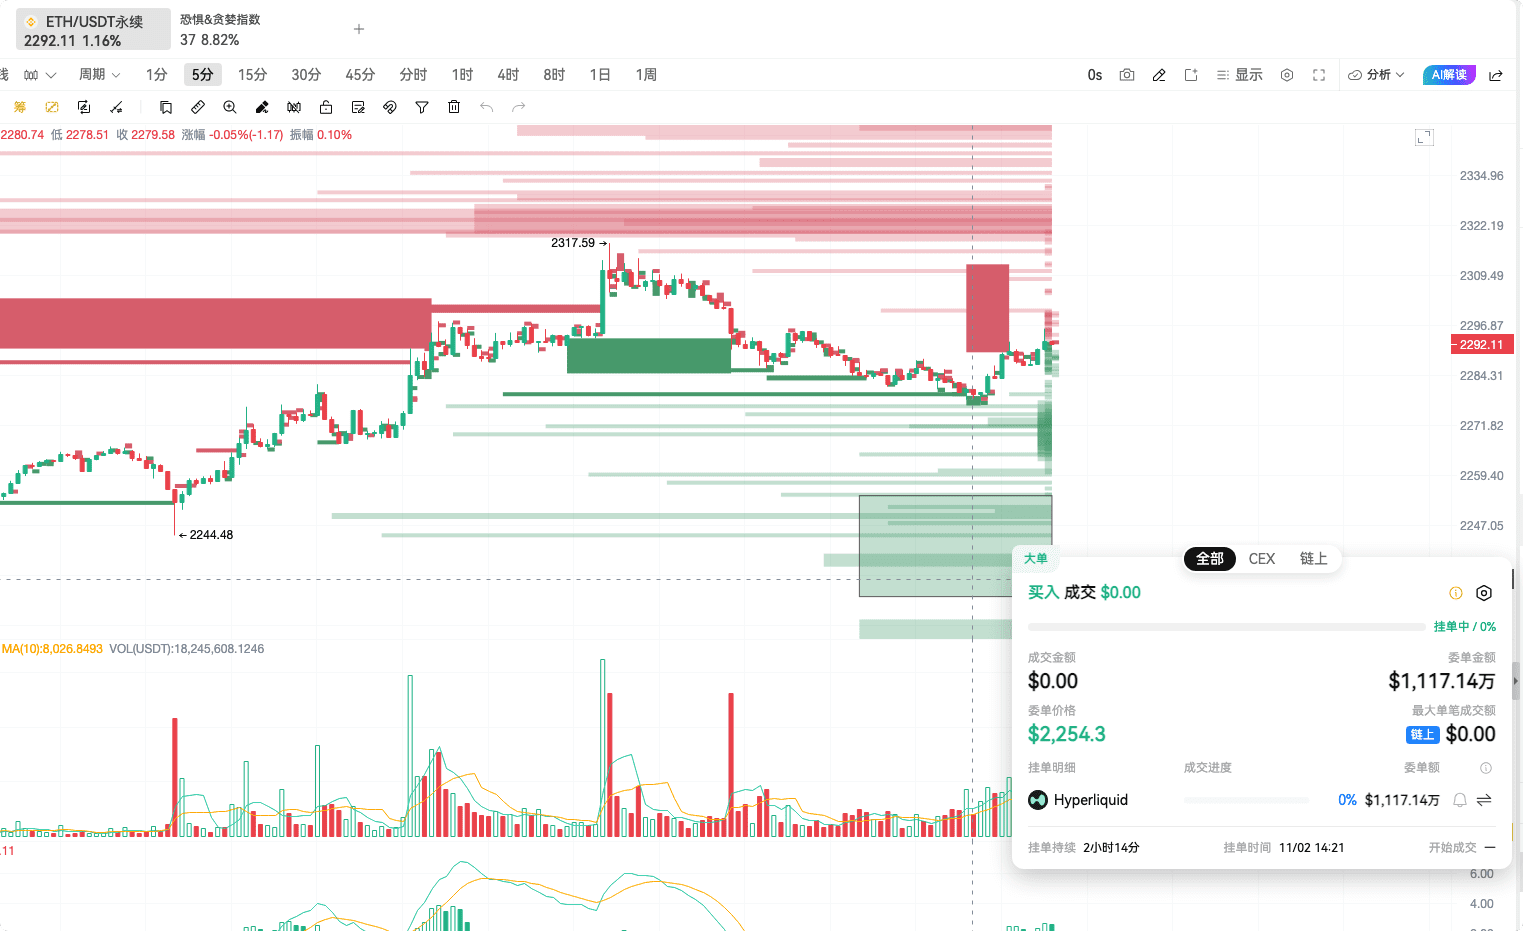
Combining the information of volume-price, large transactions, and pending orders, the upward rebound strength of ETH at that time was unlikely to be very strong, which corresponds to the lack of significant volume changes.
When comparing BTC and ETH side by side, I lean towards this market conjecture: the main force first tested selling pressure on the BTC side, but the buying support below was not weak, so the focus of short selling was shifted to ETH. If negative news surfaces later, ETH’s downward space might be greater. This is based on a few large orders and volume-price performances at that time, and cannot confirm the intentions of all funds. The volume anomaly on the BTC side prompts me to continue observing for any minor rebound opportunities.
There is also a significant sell order position above BTC worth noting, which is marked in the diagram. Pending orders may be withdrawn or changed, and cannot directly equate to established short positions.
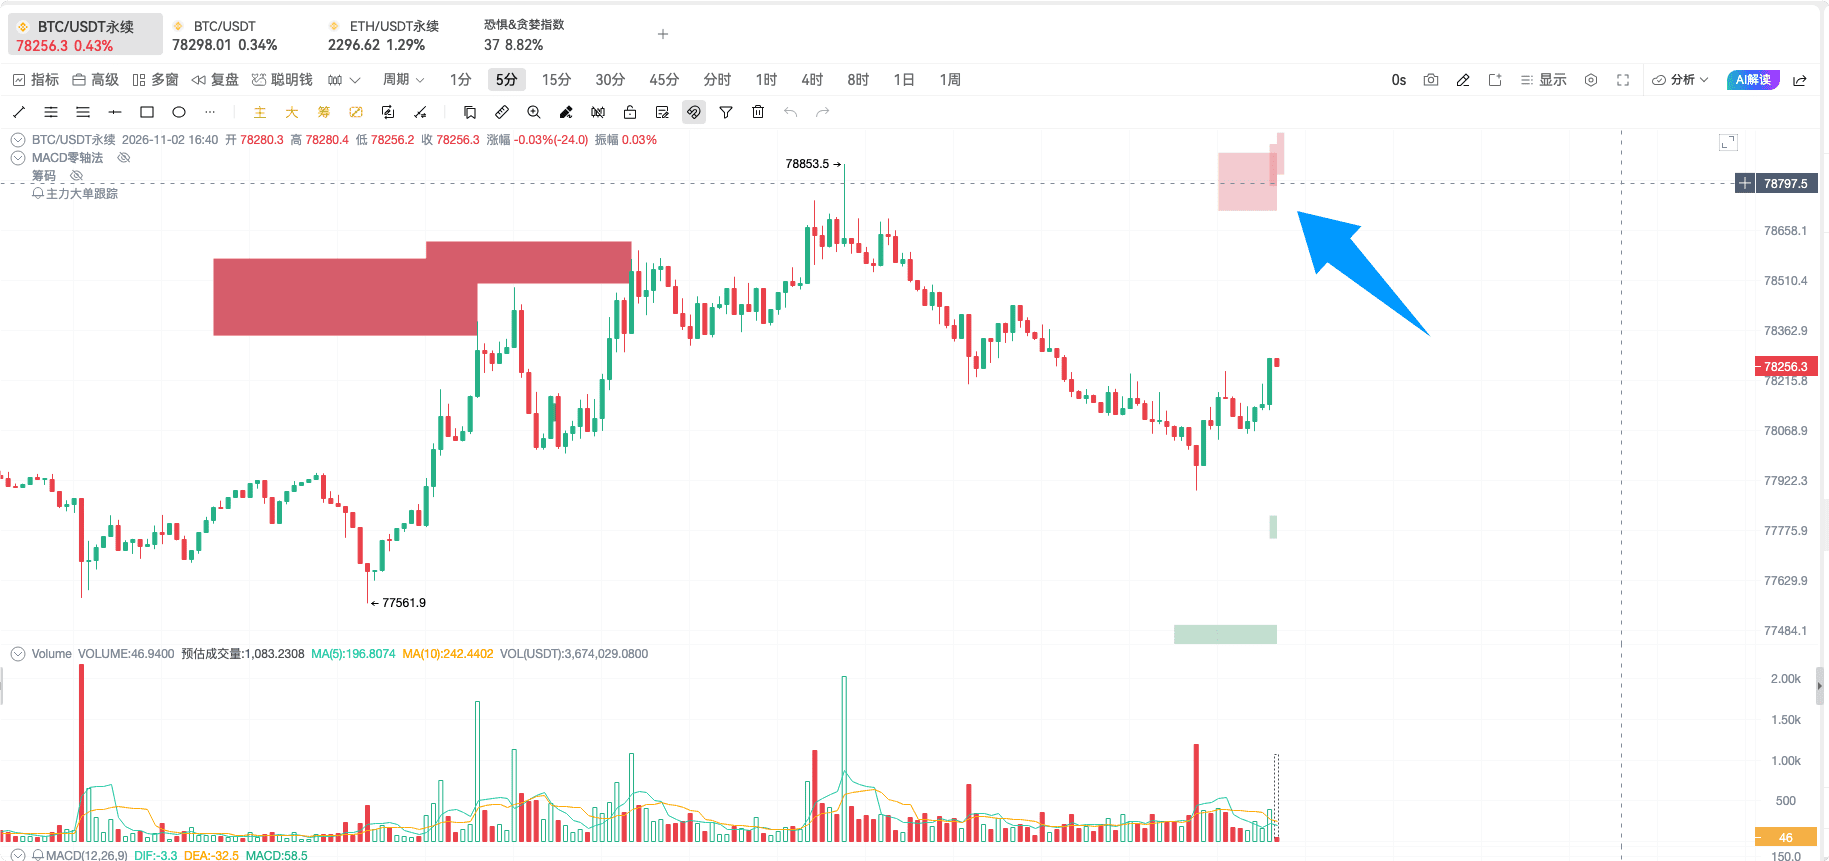
Through multi-dimensional cross-validation, there is a possibility for BTC to trend upwards for a period.
Having discussed the application of this historical market condition, let’s expand on the applicable scenarios of volume-price analysis. Many people ask how to use volume-price analysis in a bull market and how to use it in a bear market. The core is always to follow the changes in divergence, and dividing it into bull and bear market scenarios makes it clearer.
First, let’s discuss the three stages in a bull market.
The first is the bottom formation stage of the bull market. In this stage, most people are still trapped in the panic of the bear market, lacking confidence in the future, yet some funds begin to plan ahead and gradually build positions. The divergence between bears and bulls slowly accumulates here, reflecting in volume-price as typically a volume increase during a sideways trend, or a small increase in volume, with the latter being the most common form.
If the bear market has lasted for a long time, and suddenly there is a volume increase during the sideways period, one must be cautious — this could very likely be one of the signals for a market turning point. The most taboo in trading is to be overly bullish or overly bearish; adjusting judgment according to market signals is the more prudent approach. Here’s an observation conclusion: A volume increase in sideways trade after a prolonged bear market should be regarded with caution regarding the possibility of a bull market starting.
The second is the rising phase of the bull market. This stage is where market divergence is most intense, with some people having made profits or just breaking even, eager to cash out; while others are optimistic about the future and rushing in to take positions. This is expressed in volume-price as a typical volume increase during price rise.
During this stage, following the trend to chase after bullish opportunities or the chance to cash out during corrections is relatively reasonable, but it is not suitable to short against the trend. Shorting opportunities should be considered only at the top area of the bull market. Summarizing in one sentence: During the volume increase phase, it is not advisable to short blindly.
The third is the top phase of the bull market. As it approaches the top, trading volume will remain high, but it becomes difficult for prices to push higher, which is often referred to as volume stagnation. This state indicates continuous selling pressure, but the buying support can no longer absorb so much volume, causing the price to lose upward momentum.
When signs of volume stagnation appear, it is time to start being alert to top risks, and not just focus on chasing higher prices. This phase typically also accompanies a MACD divergence pattern; if these two signals support each other, the reliability increases. Prices showing volume stagnation combined with MACD divergence should raise caution; whether a reversal occurs still depends on subsequent price and volume confirmations.
Now, let’s discuss the volume-price characteristics in bear markets; I won’t elaborate further, just summarize the observation conclusions for you. The essence of trading is the relationship of supply and demand; imbalances in supply and demand lead to divergence, and divergence drives price fluctuations. The importance of volume-price analysis lies in it being the observation tool closest to the essence of the market.
The first phase of the bear market is the top-retracement phase, which is essentially a continuation of the bull market top — too many wanting to sell, and the buying support cannot hold the price, leading the market to begin turning downwards.
The second phase is the volume decline phase. In this phase, the divergence between bulls and bears is also very significant, with bottom-fishing funds and stop-loss chips continuously turning over, leading to very intense fluctuations. This position is not suitable for blindly bottom-fishing.
The third phase is the volume contraction phase. Trading volume continues to shrink, prices are stagnant, and the market’s trading willingness is very low, with neither many willing to buy nor sell. If there is a sudden volume change during this stage, it becomes a window worth considering for entering positions, but one cannot rashly bottom-fish based solely on one volume bar — it still requires cross-confirmation with more signals.
Currently, there are live broadcasts every day, and we welcome you to continue following the AiCoin community! Reserve your spot in advance👇
https://www.aicoin.com/zh-Hans/live/list?tab=upcoming
Join our community, let’s discuss and grow stronger together!
Official Telegram community: https://t.me/aicoin_support
AiCoin Chinese Twitter: https://x.com/AiCoinzh
Hype rebate: https://app.hyperliquid.xyz/join/AICOIN88
Binance rebate: https://jump.do/zh-Hans/xlink-proxy?id=3 Invitation code: aicoin668
Coinbase rebate: https://jump.do/xlink?checkProxy=true&proxyId=25 Invitation code: Y8L23JL
免责声明:本文章仅代表作者个人观点,不代表本平台的立场和观点。本文章仅供信息分享,不构成对任何人的任何投资建议。用户与作者之间的任何争议,与本平台无关。如网页中刊载的文章或图片涉及侵权,请提供相关的权利证明和身份证明发送邮件到support@aicoin.com,本平台相关工作人员将会进行核查。