The most worth-watching trend in US stocks is not necessarily just the gainers list.
The gainers list tells us which assets are performing strongly in the short term, while the market capitalization list reflects the size of companies. In contrast, the trading volume list is closer to a real-time question: what targets are current market funds focusing on?
On November 4, 2026, the 24-hour trading volume list on the OKX wallet's US stock page shows that the top ten include the Nasdaq 100 ETF, S&P 500 ETF, Apple, Nvidia, Micron Technology, Advanced Micro Devices, Warner Bros. Discovery, Oracle, Tesla, and Microsoft.
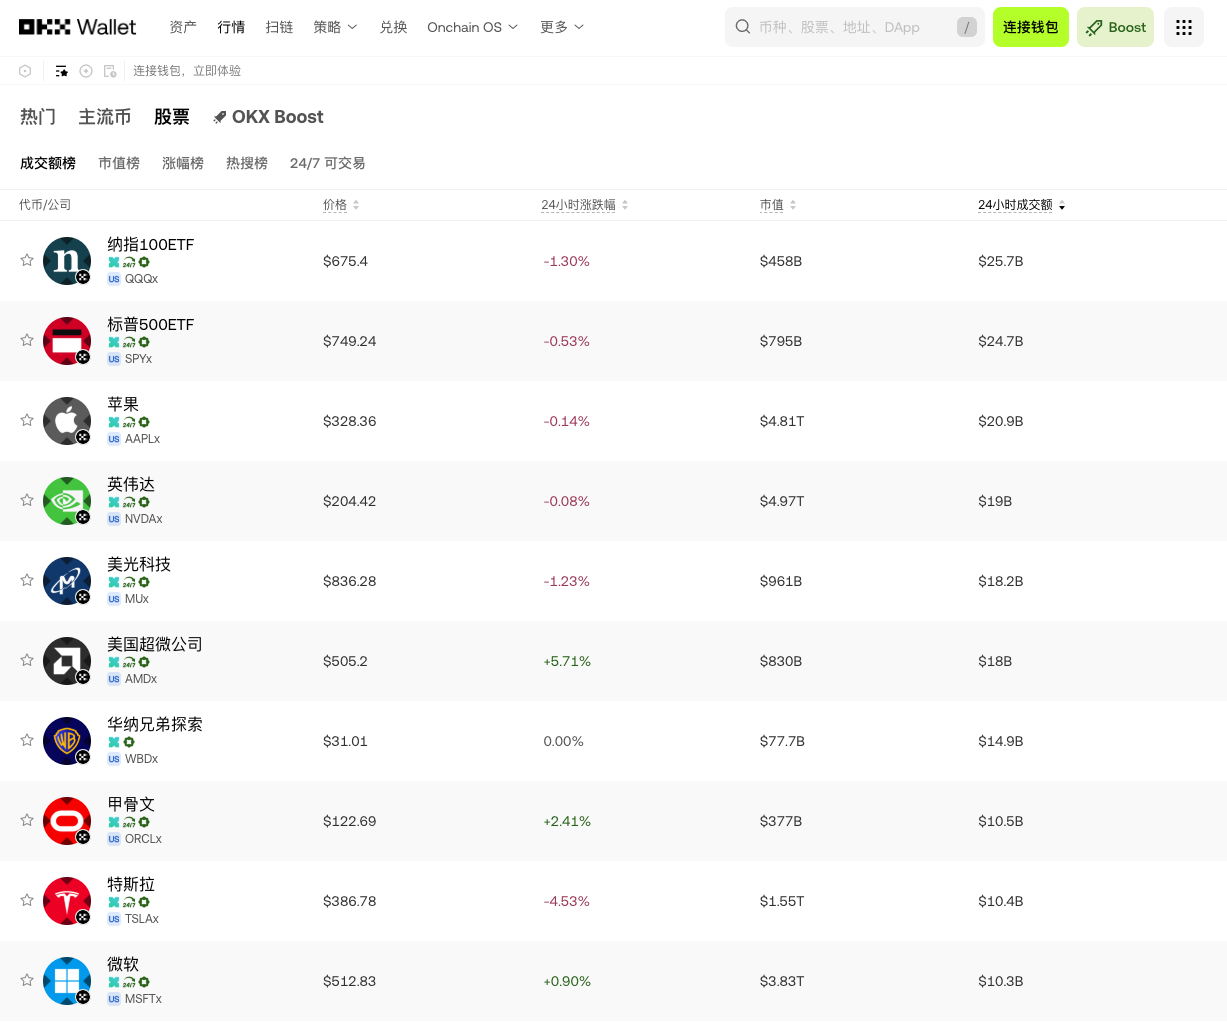
This list has a noticeable feature: funds are not concentrated in a single type of asset, but are distributed across three main directions:
- Index-type assets: QQQx, SPYx;
- AI, semiconductor, and cloud computing mainlines: NVDAX, MUx, AMDx, ORCLx, MSFTx;
- High-profile consumer and high-volatility companies: AAPLx, TSLAx, WBDx.
For ordinary users, the significance of the list is not that "the higher the ranking, the more worthy it is to buy," but that it provides a market attention map: indices represent overall risk preferences, tech giants represent growth expectations, semiconductors represent AI industry chain trading, and unusual movements in individual stocks may come from earnings reports, news, valuation reassessment, or short-term fund rotations.
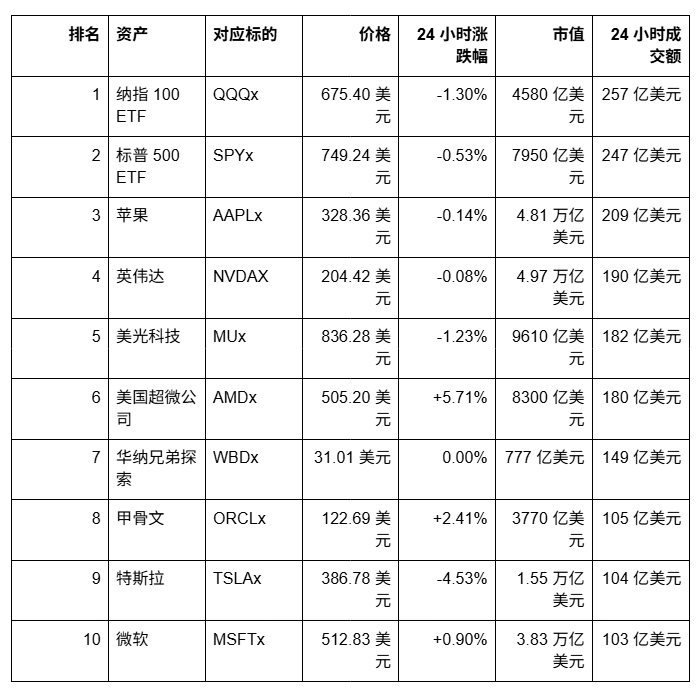
Top Ten Trading Targets
The top ten data shown on the OKX Wallet US page is as follows:
First Layer Signal: QQQx and SPYx Indicate Market’s Broad Direction Focus
The top two on the list are the Nasdaq 100 ETF QQQx and the S&P 500 ETF SPYx, with 24-hour trading volumes of approximately $25.7 billion and $24.7 billion, respectively.
The combined trading volume of both is about $50.4 billion, accounting for more than 30% of the total trading volume of the top ten targets, approximately $149.4 billion. This indicates that current funds are not solely focused on individual stocks, but also reflect a significant portion of trading expressing judgments on large US stocks and the overall market.
QQQx: Focus on Growth Tech Risk Preferences
QQQx represents the Nasdaq 100 ETF. Its constituent stocks focus on large technology, communications, consumables, and growth companies, making it usually sensitive to interest rate expectations, AI capital expenditures, technology enterprise earnings, and market risk preferences.
QQQx is priced at $675.40, with a 24-hour decline of 1.30%.
When QQQx's trading volume ranks first but its price falls, it may reflect two situations:
- Funds are engaging in high-frequency trading and repricing the risks of growth stocks;
- The market is still focused on the tech sector, but short-term profit-taking or risk control is occurring.
Trading volume alone cannot determine subsequent price trends, but the combination of "high trading volume + price decline" is worth observing together with interest rates, earnings reports, valuations, and industry news.
SPYx: Observe a Broader Market Fund
SPYx represents the S&P 500 ETF, covering a wider range of industries than QQQx. SPYx is priced at $749.24, with a 24-hour drop of 0.53%, and a 24-hour trading volume of approximately $24.7 billion.
QQQx and SPYx appearing in the top two positions simultaneously suggests that the market is undergoing a significant reallocation of overall US stock risk. The performance differences between the two can also help users observe whether current funds are leaning more towards growth tech or diversifying into broader industries.
For novices, the advantage of index-type assets lies in their clearer observational logic, as there is no immediate need to judge a specific company's individual business; however, an index does not equate to low risk, as interest rates, macroeconomic changes, and overall valuation fluctuations may still cause significant volatility.
Second Layer Signal: Apple and Nvidia Remain Centers of Fund Attention
AAPLx: Ultra-large Market Cap Asset Still Has Extremely High Trading Heat
Apple ranks third, with an AAPLx price of $328.36, a 24-hour drop of 0.14%, market capitalization of approximately $4.81 trillion, and a 24-hour trading volume of about $20.9 billion.
Apple’s market attention usually revolves around the following major lines:
- iPhone product cycle;
- Growth of service business;
- Gross margin and cash flow;
- AI features and ecosystem integration;
- Demand in China and other major markets;
- Buybacks, dividends, and valuation levels.
Although Apple’s decline for the day is not significant, it remains in the top three in trading volume, indicating that it continues to be an important tool for market funds in configuration, rebalancing, and risk expression.
For investors, the key for giants like Apple is not just "how good the company is," but how much growth expectation is already priced in. High-quality companies can also experience short-term pullbacks due to overly high expectations.
NVDAX: Core Observation Window for the AI Industry Chain
Nvidia ranks fourth, with an NVDAX price of $204.42, a 24-hour drop of 0.08%, with a market cap of approximately $4.97 trillion and a trading volume of about $19 billion.
Nvidia remains an important market proxy for AI computing demand and data center capital expenditures. Market highlights generally include:
- GPU demand and delivery rhythms;
- Data center revenue;
- Whether AI infrastructure investments are sustainable;
- Supply chain and advanced packaging;
- Capital expenditures of major cloud providers;
- New product cycles and competitive landscapes.
A high trading volume for NVDAX but near-flat price changes indicate that funds are continuously exchanging chips in a high liquidity environment, suggesting that the market may be waiting for new performance, guidance, or industry chain signals.
It is important to emphasize that a high trading volume indicates high attention and liquidity, but does not guarantee that prices will rise, nor does it imply that current valuations are risk-free.
Third Layer Signal: MUx, AMDx Expanding AI Trading to the Semiconductor Industry Chain
MUx: Intersection of Storage Cycle and AI Demand
Micron Technology ranks fifth, with an MUx price of $836.28, a 24-hour drop of 1.23%, a market cap of approximately $961 billion, and a trading volume of about $18.2 billion.
Micron's market logic differs from Nvidia's. It is more susceptible to the following factors:
- DRAM and NAND storage prices;
- AI server demand for high-bandwidth memory;
- Data center orders;
- Supply-demand cycles and inventory changes;
- Capital expenditures and capacity management;
- The recovery of consumer electronics.
The growth of AI servers may simultaneously drive demand for GPUs, networking equipment, and high-performance storage. Therefore, the trading heat of MUx can be seen as an observation window for the diffusion of AI capital expenditures into the storage segment.
However, the semiconductor industry has high cyclicality, and while the market trades on growth expectations, it will also anticipate supply increases, price pullbacks, or inventory pressures.
AMDx: Significant Price Increase and Trading Volume on the Same Day
Advanced Micro Devices ranks sixth, with an AMDx price of $505.20, a 24-hour increase of 5.71%, a market cap of approximately $830 billion, and a trading volume of about $18 billion.
https://web3.okx.com/zh-hans/token?ct=46-120
Among the top ten targets, AMDx's price increase is the most prominent. Its simultaneous occurrence with a trading volume of $18 billion makes it one of the strong assets worth observing individually on that day.
This combination of "high trading volume + significant increase" often indicates a strong repricing behavior in the market. Possible driving factors include:
- Changes in product or order expectations;
- Reevaluation of the AI chip competitive landscape;
- Analyst rating or target price adjustments;
- Earnings reports and performance guidance;
- Funds switching from other semiconductor assets.
However, strong price increases also imply short-term volatility and chasing risk. Users should further confirm whether the rise in AMDx is driven by fundamental news, industry fund rotations, or short-term sentiment, rather than concluding solely based on daily increases.
Fourth Layer Signal: WBDx and ORCLx Reflect Different Event-Driven Logic
WBDx: Higher Trading Volume than Microsoft, but Price Temporarily Flat
Warner Bros. Discovery ranks seventh, with a WBDx price of $31.01, with a 24-hour gain/loss of 0.00%, market capitalization of approximately $77.7 billion, and a trading volume of about $14.9 billion.
The characteristic of WBDx is that its market cap is significantly lower than that of the previous tech giants, yet its trading volume is among the top ten. This indicates that the trading volume list is not only for the highest market cap companies, but may also be influenced by event-driven dynamics, company restructuring, asset disposals, merger expectations, media business changes, or market rumors.
“High trading volume + flat price” may mean that both sides are fiercely exchanging hands, or it may indicate that the market is waiting for clear news. For such targets, trading volume should be viewed more as a “signal of attention” rather than a direct bullish signal.
ORCLx: Cloud Computing and AI Infrastructure Narrative
Oracle ranks eighth, with an ORCLx price of $122.69, a 24-hour increase of 2.41%, market capitalization of approximately $377 billion, and a trading volume of about $10.5 billion.
The trading logic for Oracle typically relates to enterprise databases, cloud infrastructure, AI computing demands, and large client contracts. Its increase and high trading volume indicate that the market is still paying attention to the traditional software giant's progress toward cloud computing and AI infrastructure transformation.
ORCLx entering the list alongside MSFTx, NVDAX, and AMDx also indicates that AI trading is not solely centered around GPU manufacturers, but is gradually covering cloud services, enterprise software, data centers, and chip supply chains.
Fifth Layer Signal: TSLAx High Volatility, MSFTx Reflects Stable Attention on Large Technology
TSLAx: Most Significant Drop in the List
Tesla ranks ninth, with a TSLAx price of $386.78, a 24-hour drop of 4.53%, market capitalization of approximately $1.55 trillion, and a trading volume of about $10.4 billion.
TSLAx is one of the assets with the most significant drop in the list. Tesla's price is often influenced by the following factors:
- Delivery volume and car sales;
- Gross margin and pricing strategy;
- Autonomous driving and robotics business;
- Energy storage business;
- Regulatory and policy changes;
- Company management and capital market expectations.
The high trading volume of TSLAx indicates high market participation, but high participation often occurs alongside high volatility. For novices, the critical aspect to avoid is misinterpreting high liquidity as low risk.
MSFTx: Modest Increase, yet Still in the Top Ten Trading Volume
Microsoft ranks tenth, with an MSFTx price of $512.83, a 24-hour increase of 0.90%, market capitalization of approximately $3.83 trillion, and a trading volume of about $10.3 billion.
Microsoft's market attention is primarily focused on Azure, AI product commercialization, enterprise software subscriptions, data center capital expenditures, and Copilot, among others. Although MSFTx’s daily increase is not extreme, it still makes the list with a trading volume exceeding $10 billion, indicating that large tech stocks sustained capital support and trading depth.
Compared to high-volatility assets like AMDx and TSLAx, MSFTx is more suitable for observing how the long-term growth expectations of large tech companies are being repriced by the market.
Three Combinations Worth Watching in the List
Focusing on a single asset can easily lead to being misled by its fluctuations; combining trading volume, fluctuations, and asset types provides richer information.
Combination One: Index ETFs + Large Technology
The simultaneous presence of QQQx, SPYx, AAPLx, NVDAX, and MSFTx in the top ten indicates that market funds remain concentrated in large US stocks and tech assets.
This type of combination can assist users in judging the overall market risk preference but also requires vigilance against overly concentrated valuations in the tech sector.
Combination Two: Core AI Assets + Semiconductor Diffusion
The collective appearance of NVDAX, MUx, AMDx, ORCLx, and MSFTx constructs an observational framework of the AI industry chain from chips, storage to cloud services and enterprise software.
If these assets see simultaneous volume increases, it may reflect the market's continuing attention to AI capital expenditures and computing demand; if trading volume rises but prices diverge, it suggests the market is engaging in internal rotations within the industry chain rather than a simple and comprehensive bullish view.
Combination Three: High Trading Volume + Significant Fluctuations
AMDx increased 5.71%, TSLAx decreased 4.53%, and WBDx remained flat, with all three entering the top ten trading volumes.
This suggests that at the same time, there may be contrasting trading directions in the market: part of the funds chasing strong growth stocks, part of the funds repricing risks within high-volatility assets, and another part waiting for events to unfold.
Can the Trading Volume List Be Used Directly for Stock Selection?
The trading volume list is suitable for "first-level screening," but cannot replace fundamentals, technical aspects, and risk management. Users need to continue checking:
- Is the trading volume sustained, and not an anomalous spike for a single day;
- Is the price increase accompanied by confirmation of the trading volume;
- Has the current valuation already priced in overly high expectations;
- Does the company have any recent earnings reports, guidance, or major news;
- The liquidity and price spread of tokenized assets;
- The actual slippage and on-chain fees during buying or selling;
- The maximum loss range one can bear.
For example, a significant increase in AMDx does not mean that chasing after it is necessarily reasonable; a notable decrease in TSLAx does not indicate that a rebound will immediately happen; and a high trading volume for WBDx but a flat price cannot simply be interpreted as a buy signal.
The correct use of the list is: first discover points of fund interest, then verify driving factors, and finally decide whether to participate.
How to Observe These US Stock Assets with OKX Wallet?
The OKX Wallet US stock page organizes assets according to trading volume lists, market cap lists, gainers lists, hot search lists, and 24/7 tradable dimensions, allowing users to observe the market from various angles.
For those who rely on information and data analysis, this list-style entry has three practical values:
1. Discover Market Hotspots from Trading Volume
First, see where funds are concentrated, and then further research the underlying earnings reports, industry chains, and market expectations.
2. Compare Different Types of Assets
Users can compare index assets like QQQx and SPYx with individual stock assets such as AAPLx, NVDAX, AMDx, and TSLAx simultaneously, observing the differences between overall market and individual stock trends.
3. Directly Enter Trading and Data Observation Processes
Users can view asset prices, fluctuations, market caps, and trading volumes within the wallet and then decide whether to trade based on their research results. For on-chain US stocks and tokenized assets, further examination of specific product descriptions, tradable regions, issuance mechanisms, and liquidity conditions is still necessary.
Conclusion: The Top Ten Lists Are Not Answers, But Entry Points to Market Attention
The November 4, 2026 OKX Wallet trading volume list for US stocks presents a clear market structure:
- QQQx and SPYx represent overall US stock risk preferences;
- AAPLx and NVDAX represent ongoing attention for ultra-large market cap tech assets;
- MUx, AMDx, ORCLx, and MSFTx form an observational framework for AI and semiconductor industry chains;
- WBDx and TSLAx reflect the activity level of event-driven and high-volatility trades.
Among them, AMDx increased 5.71% on that day, TSLAx fell 4.53%, while high trading volume assets like QQQx, SPYx, AAPLx, and NVDAX experienced varying degrees of decline. This indicates that the current market is not a simple overall rise or fall, but rather that funds are rapidly switching between different sectors, risk levels, and narratives.
For novices, the most valuable lesson is not to "buy at the top," but to establish a process for moving from the list to decisions:
Trading volume discovering hotspots → Fluctuations identifying divergence → Fundamentals verifying logic → Technical aspects confirming rhythm → Assessing liquidity and risks before trading.
Open the OKX Wallet US stock page now to check the real-time list data for QQQx, SPYx, AAPLx, NVDAX, MUx, AMDx, WBDx, ORCLx, TSLAx, and MSFTx.
Exclusive Benefits for AiCoin Users
Use OKX Web3 Wallet to "Invest in Assets Worldwide"!
Bind invitation code 【AICOIN88】 to enjoy a 20% reduction in transaction costs (like Gas optimization benefits)!
Download/upgrade OKX Web3 Wallet now and catch the wind:
https://jump.do/xlink?checkProxy=true&proxyId=24
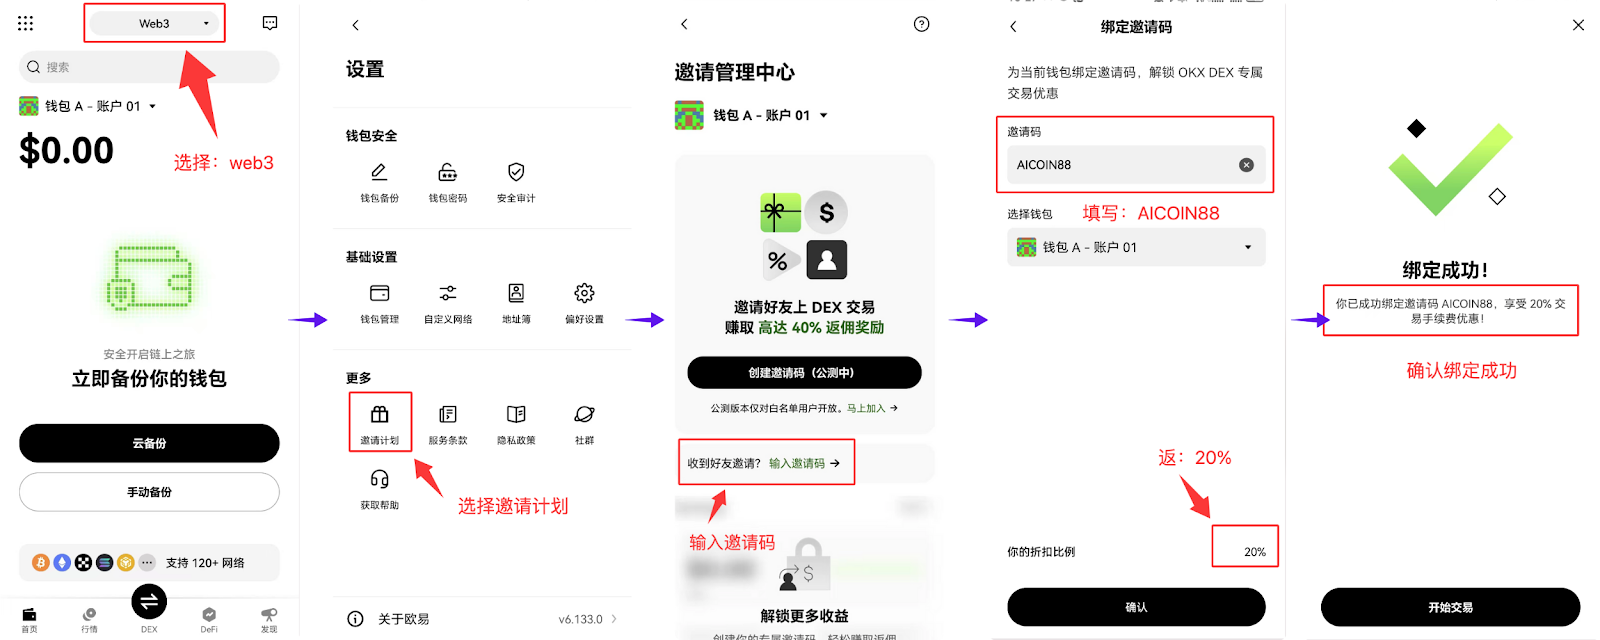
Use the exclusive code 【AICOIN88】 to bind to OKX Wallet, easy operation on the web too!
https://web3.okx.com/ul/joindex?ref=AICOIN88
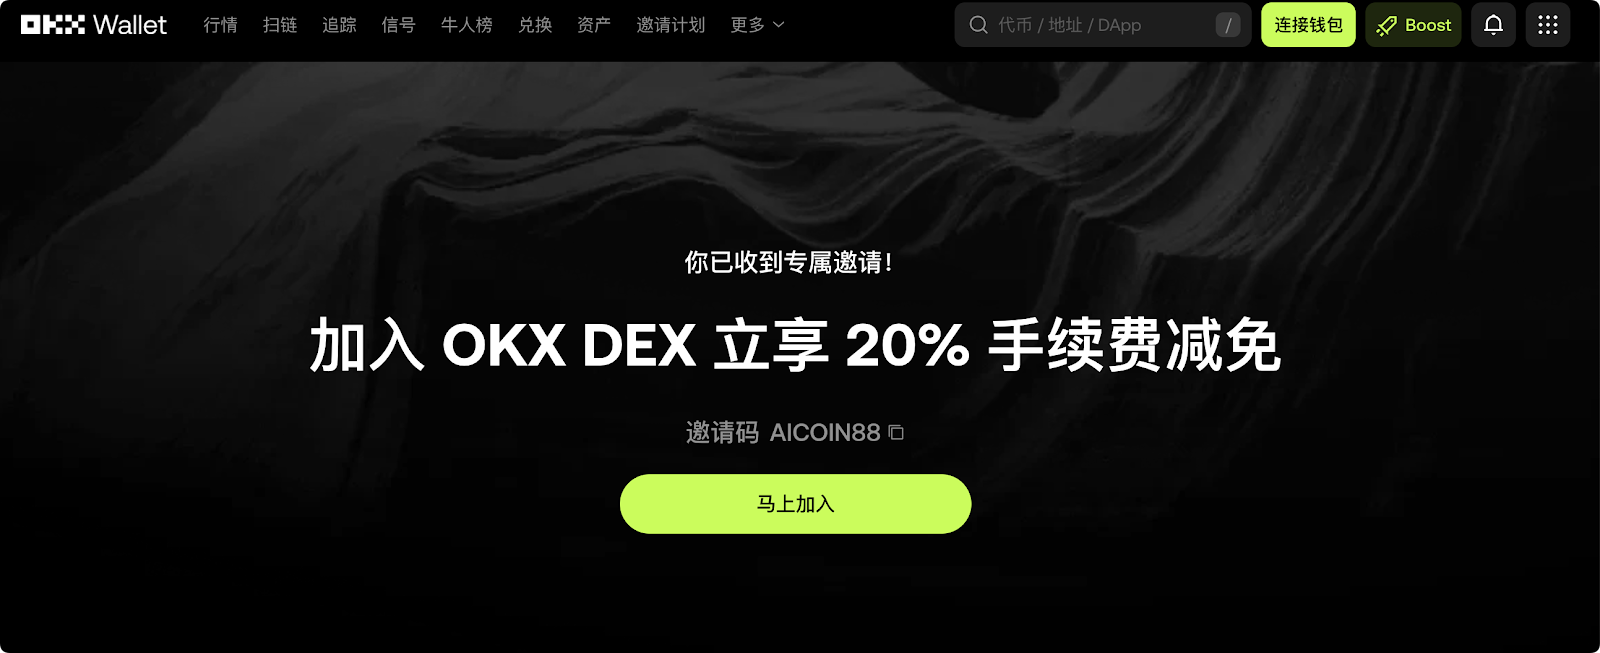
Don't wait, install OKX Wallet, bind the benefits and gain new wealth!
免责声明:本文章仅代表作者个人观点,不代表本平台的立场和观点。本文章仅供信息分享,不构成对任何人的任何投资建议。用户与作者之间的任何争议,与本平台无关。如网页中刊载的文章或图片涉及侵权,请提供相关的权利证明和身份证明发送邮件到support@aicoin.com,本平台相关工作人员将会进行核查。