Author: Glassnode Research Team
Translation: Deep Tide TechFlow
Deep Tide Overview: In the past week, the crypto asset market has endured a double blow: first, Binance disclosed a historical security theft case involving a staggering amount of $6.3 billion, followed by the dust settling on the political landscape after the Democratic Party unexpectedly swept both houses in the 2026 U.S. midterm elections. However, after experiencing a technical correction of about 10% from the September peak, Bitcoin's spot price has shown remarkable resilience in absorbing downward pressure, demonstrating strong buying support in the core support zone of $76,000 to $78,000.
This Glassnode flagship weekly report provides an in-depth data breakdown of the current spot chip distribution and derivatives long and short positions. On-chain data shows that the proportion of unrealized profit chips has rapidly cooled from an extremely greedy 97.5% at the beginning of October to 38%, meaning that a significant amount of short-term speculative profits has been effectively washed out; excessive long leverage in futures contracts has been forcibly cleared, while short positions that are close to the $87,000 level are rapidly accumulating; the options market has shown an asymmetric structure where long-term call options significantly outpace put options after the midterm elections. Although the influx of out-of-market funds through U.S. spot ETFs currently presents a wait-and-see attitude, Bitcoin's daily win rate against the S&P 500 index has returned to the 50% equilibrium line, indicating that the entire crypto market is building the next stage of a power accumulation platform on a more solid risk-return foundation.
Core Summary
The unrealized profit ratio of short-term Bitcoin holders has dramatically dropped from nearly 100% at the beginning of October to about 38% currently. This significant decrease in this key indicator indicates that the current market's valuation extension is far lower than the peak touched in September, resulting in a substantial digestion of overall market bubbles.
Bitcoin's price is currently accurately retouching the key technical points from its breakout in August, where the true market mean of active investors currently stands at $77,700, while the short-term holders' cost basis is around $75,700.
This round of price correction has nearly completely washed out the large amount of high-leverage long positions accumulated since the breakout in August; meanwhile, the open short positions above are expanding against the trend, with the largest short liquidation cluster densely piled near the $87,000 mark.
In the options derivatives market, the position size of call options significantly surpasses that of put options, with the largest individual call option positions expiring at the end of December concentrated in the high strike price range of $80,000 to $120,000.
Spot trading volume remains robustly maintained at about 1.5 times the baseline level before the surge in August, but in the last two statistical weeks, the overall U.S. spot Bitcoin ETF has recorded nearly $1 billion in net fund outflows.
Over the past two months, Bitcoin has shown strong relative resilience against traditional mainstream stock markets, winning half of the trading days in daily battles against the S&P 500 index, a first return to the 50% win rate since March 2025.
In the face of the $6.3 billion theft incident, the largest loss in crypto history, the entire market has only experienced about a 3% minor retreat, demonstrating strong liquidity absorption resilience.
The U.S. midterm elections ultimately concluded with the Democratic Party controlling both houses. Historically, in the three previous midterm election cycles, Bitcoin often experiences a final downward probe after voting concludes before establishing a macro bottom; however, this round of cycle adjustments has largely been absorbed ahead of election day, and since the election day, the price has shown a slight rebound.
In the altcoin market, short-term holders have largely transitioned from profit to loss on most tokens, forming a sharp cleanup from around 80% of tokens being in profit status in late September.
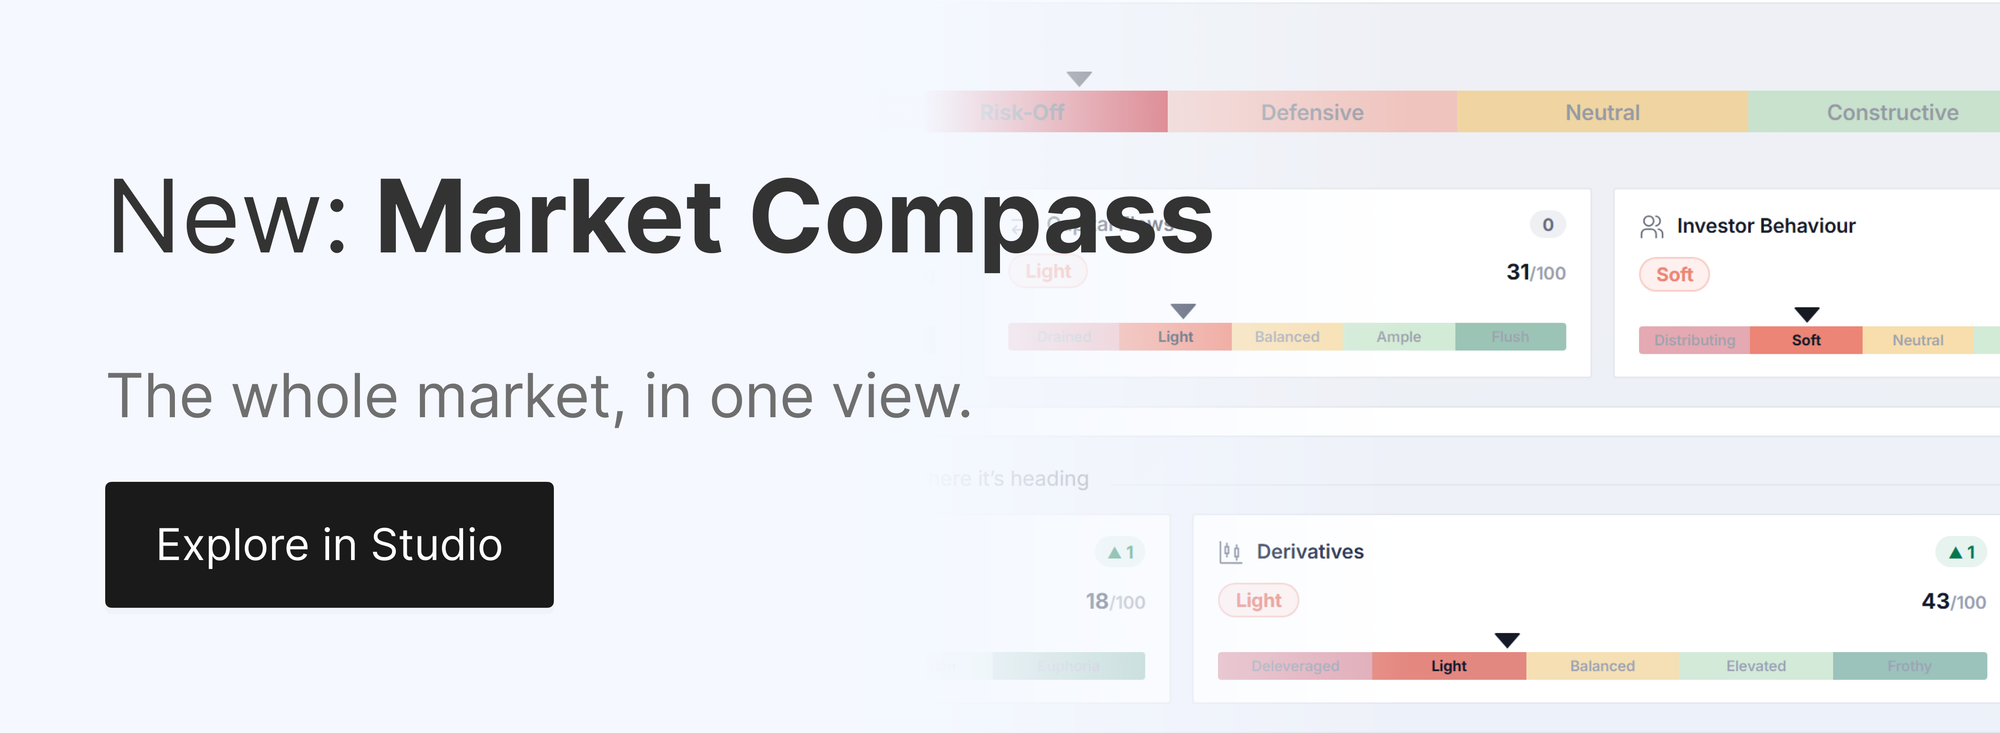
Figure: Overview of key indicators across dimensions of Glassnode's on-chain macro compass
A Healthier Chip Reset
Just recently, at the beginning of October, nearly 100% of the Bitcoin chips held by short-term holders (defined as on-chain addresses purchased in the last 155 days) were in unrealized profit. At that time, the "short-term holder profit supply ratio (STH Supply in Profit)" surged and remained firmly above 97.5%. We have always marked this extreme range in our previous research reports as a highly risky "sell warning line," as it indicates that nearly every recent buyer holds significant floating profits that can be realized at any time.
As prices have embarked on a roughly 10% volatile correction from September highs, this indicator has now sharply fallen to around 38%, meaning that the vast majority of short-term holders' chips are now at a realized loss state. Compared to a month ago’s extreme tightness, the current market’s speculative mood has greatly cooled and reset. If in the future, under the premise that spot prices can remain stable, this indicator can repair back above 50% of the neutral balance line, it will clearly indicate that a new wave of incoming buyers has returned to a profit state and reestablished confidence in future positions.
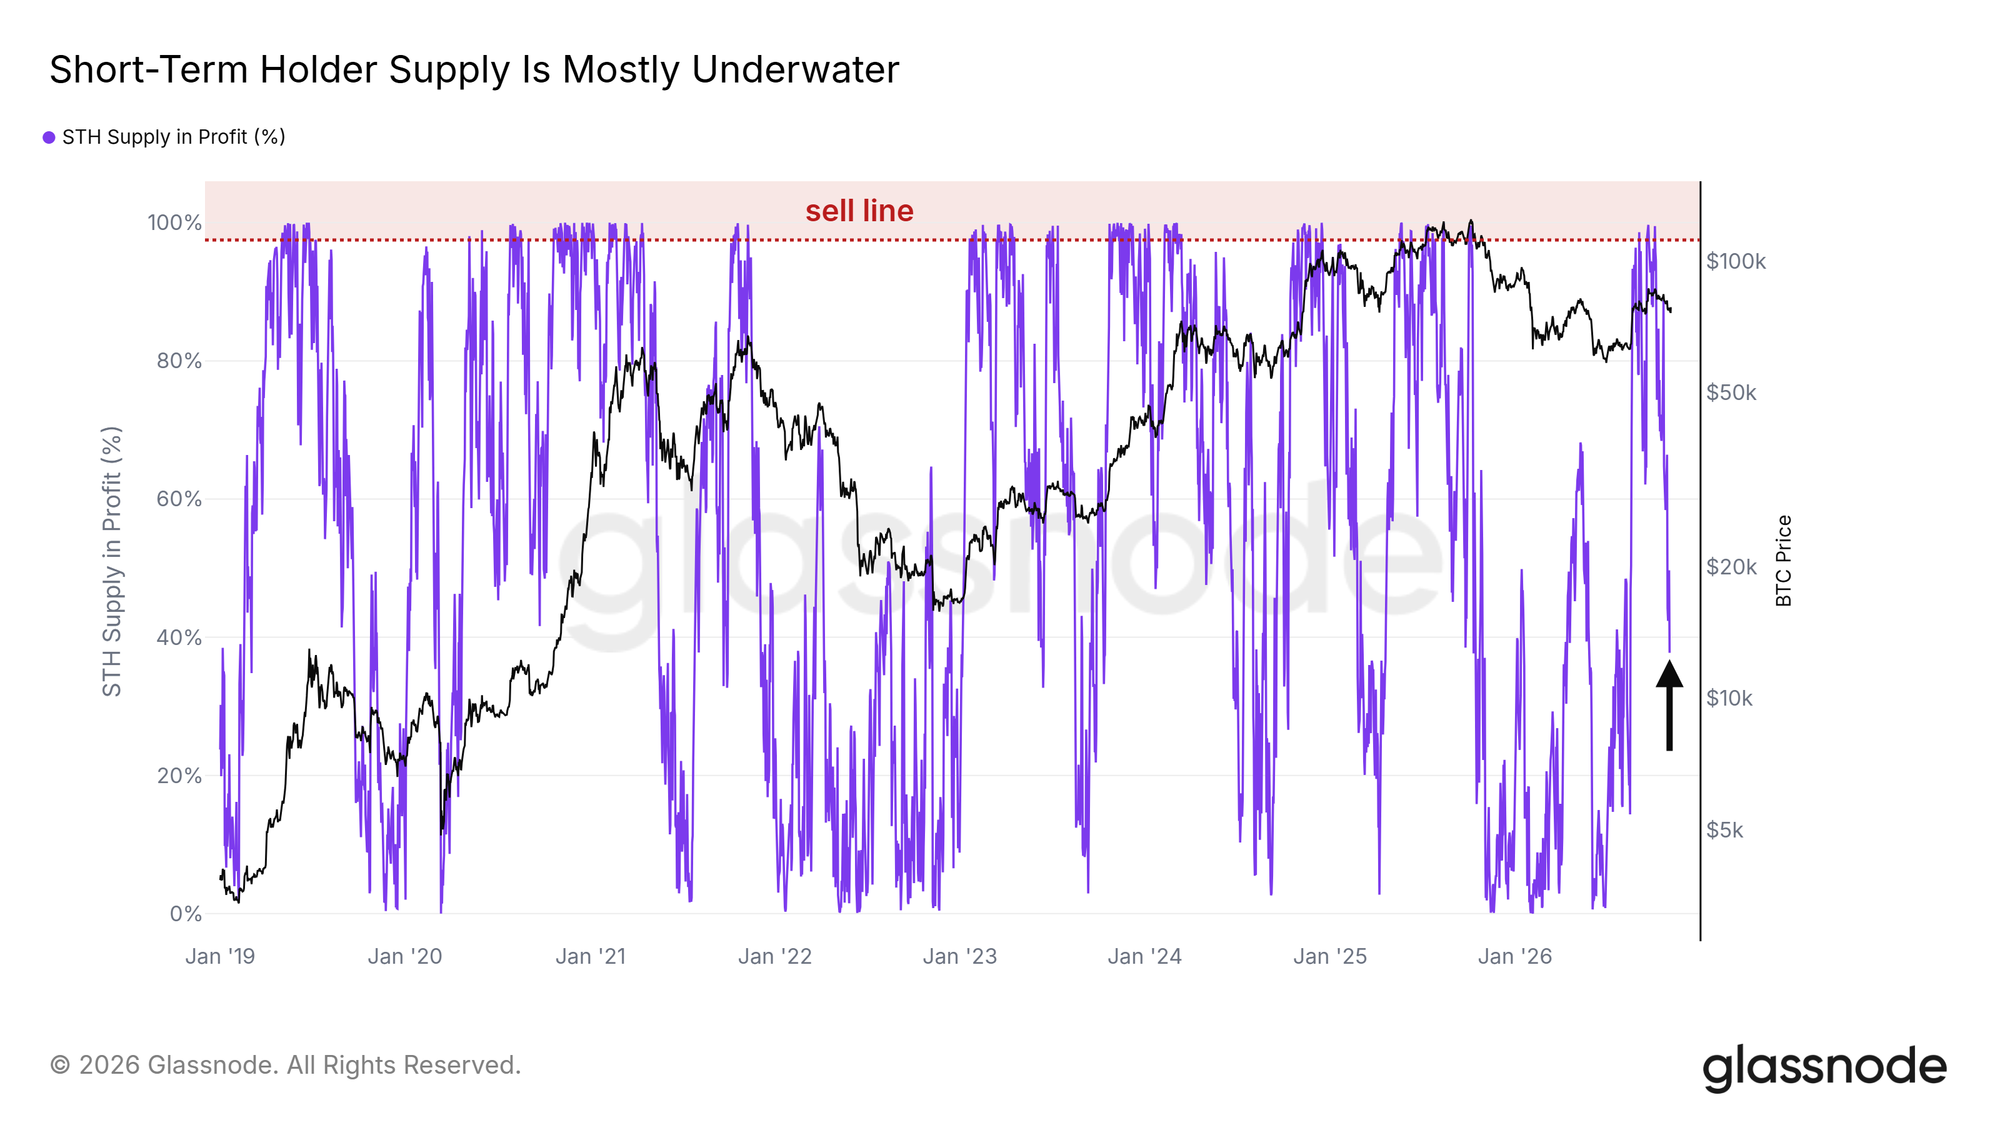
Figure: Short-term holder profit supply ratio falls to 38%, a historical health digestion range
Retouching Breakthrough Key Levels
In the volatile upward trend from August to September, Bitcoin strongly reclaimed a series of key moving averages and cost bases that had been lost after achieving historical peaks in 2025. These key indicators include the 200-day moving average, the short-term holder cost basis (STH Cost Basis) representing the average purchase cost of recent buyers, and the "True Market Mean" reflecting the average holding cost of active investors across the network.
In the last on-chain analysis, we clearly pointed out that during the two deep dips in October, the price received precise support above the true market mean. On November 3, the spot closing price briefly fell below this level (currently the mean stands at $77,700), reaching a low of $76,100 overnight, but then the bulls quickly pushed it back above the mean.
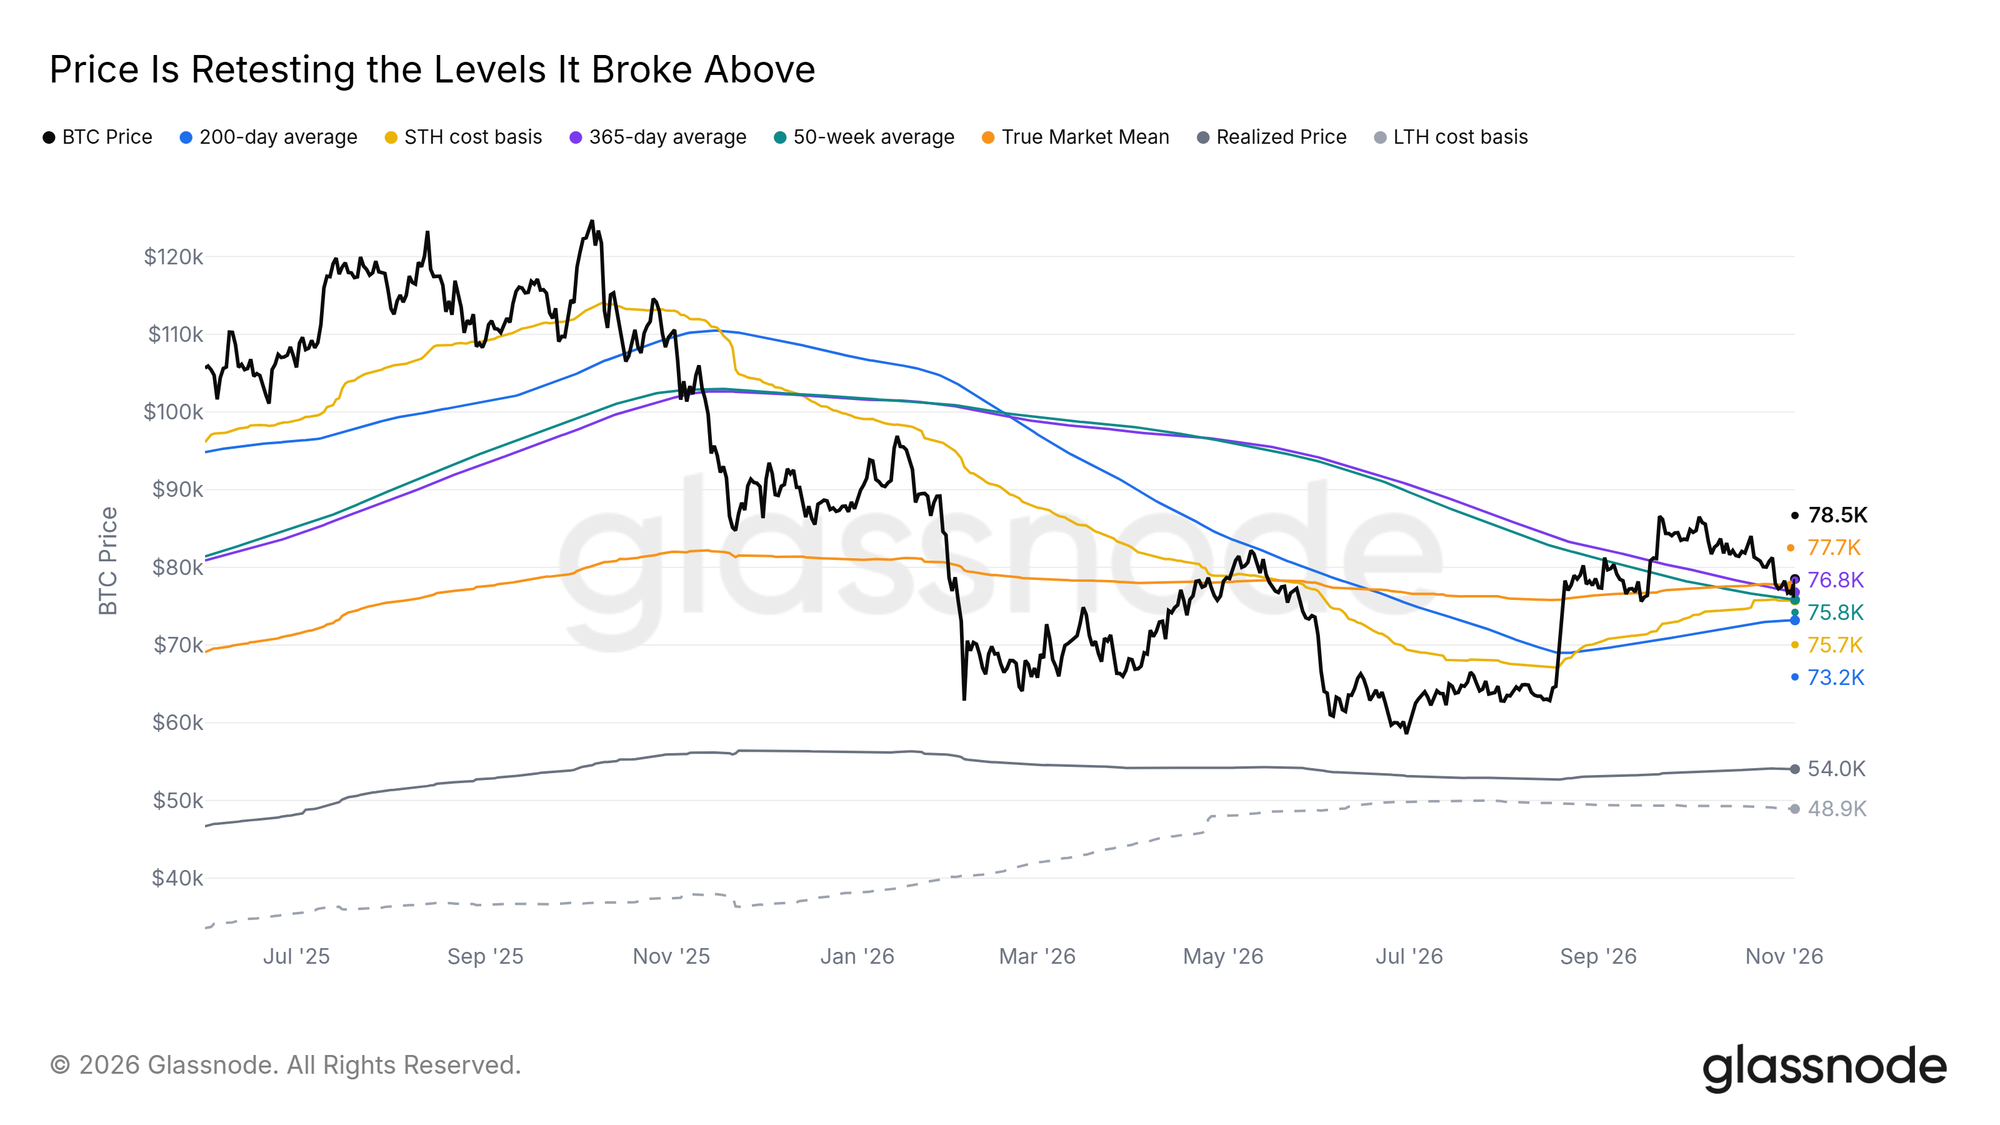
Figure: Bitcoin price retouches the true market mean and 200-day line key support zone
After a successful breakout with high volume, such a deep downward retouch test is a very standard and healthy movement: those critical resistance levels that previously took months to reclaim are now transforming from resistance to a support base below. The short-term holder cost line at $75,700 and the 50-week moving average are currently closely providing multiple technical buffers below the spot price. As long as Bitcoin can securely operate above these core averages, the solid upward structure built since August remains intact.
Intense Accumulation of Short Liquidations Above
The liquidation heatmap can accurately simulate the scale of capital triggered to forcefully clear high-leverage futures contracts at different price levels. The recent wave of downward corrections since the September peak has crushed and swept away a large number of long liquidation positions that had been densely established below since August, fundamentally significantly reducing the systemic risk of cascading waterfall sell-offs triggered by consecutive long liquidations.
The remaining effective liquidation range below the spot price is concentrated primarily between $73,000 to $76,000, an area that resonates strongly with the short-term holder cost baseline and the 200-day moving average; while at lower depths, only a significant liquidation gap remains from the unilateral breakout in August in the $60,000 to $63,000 range.
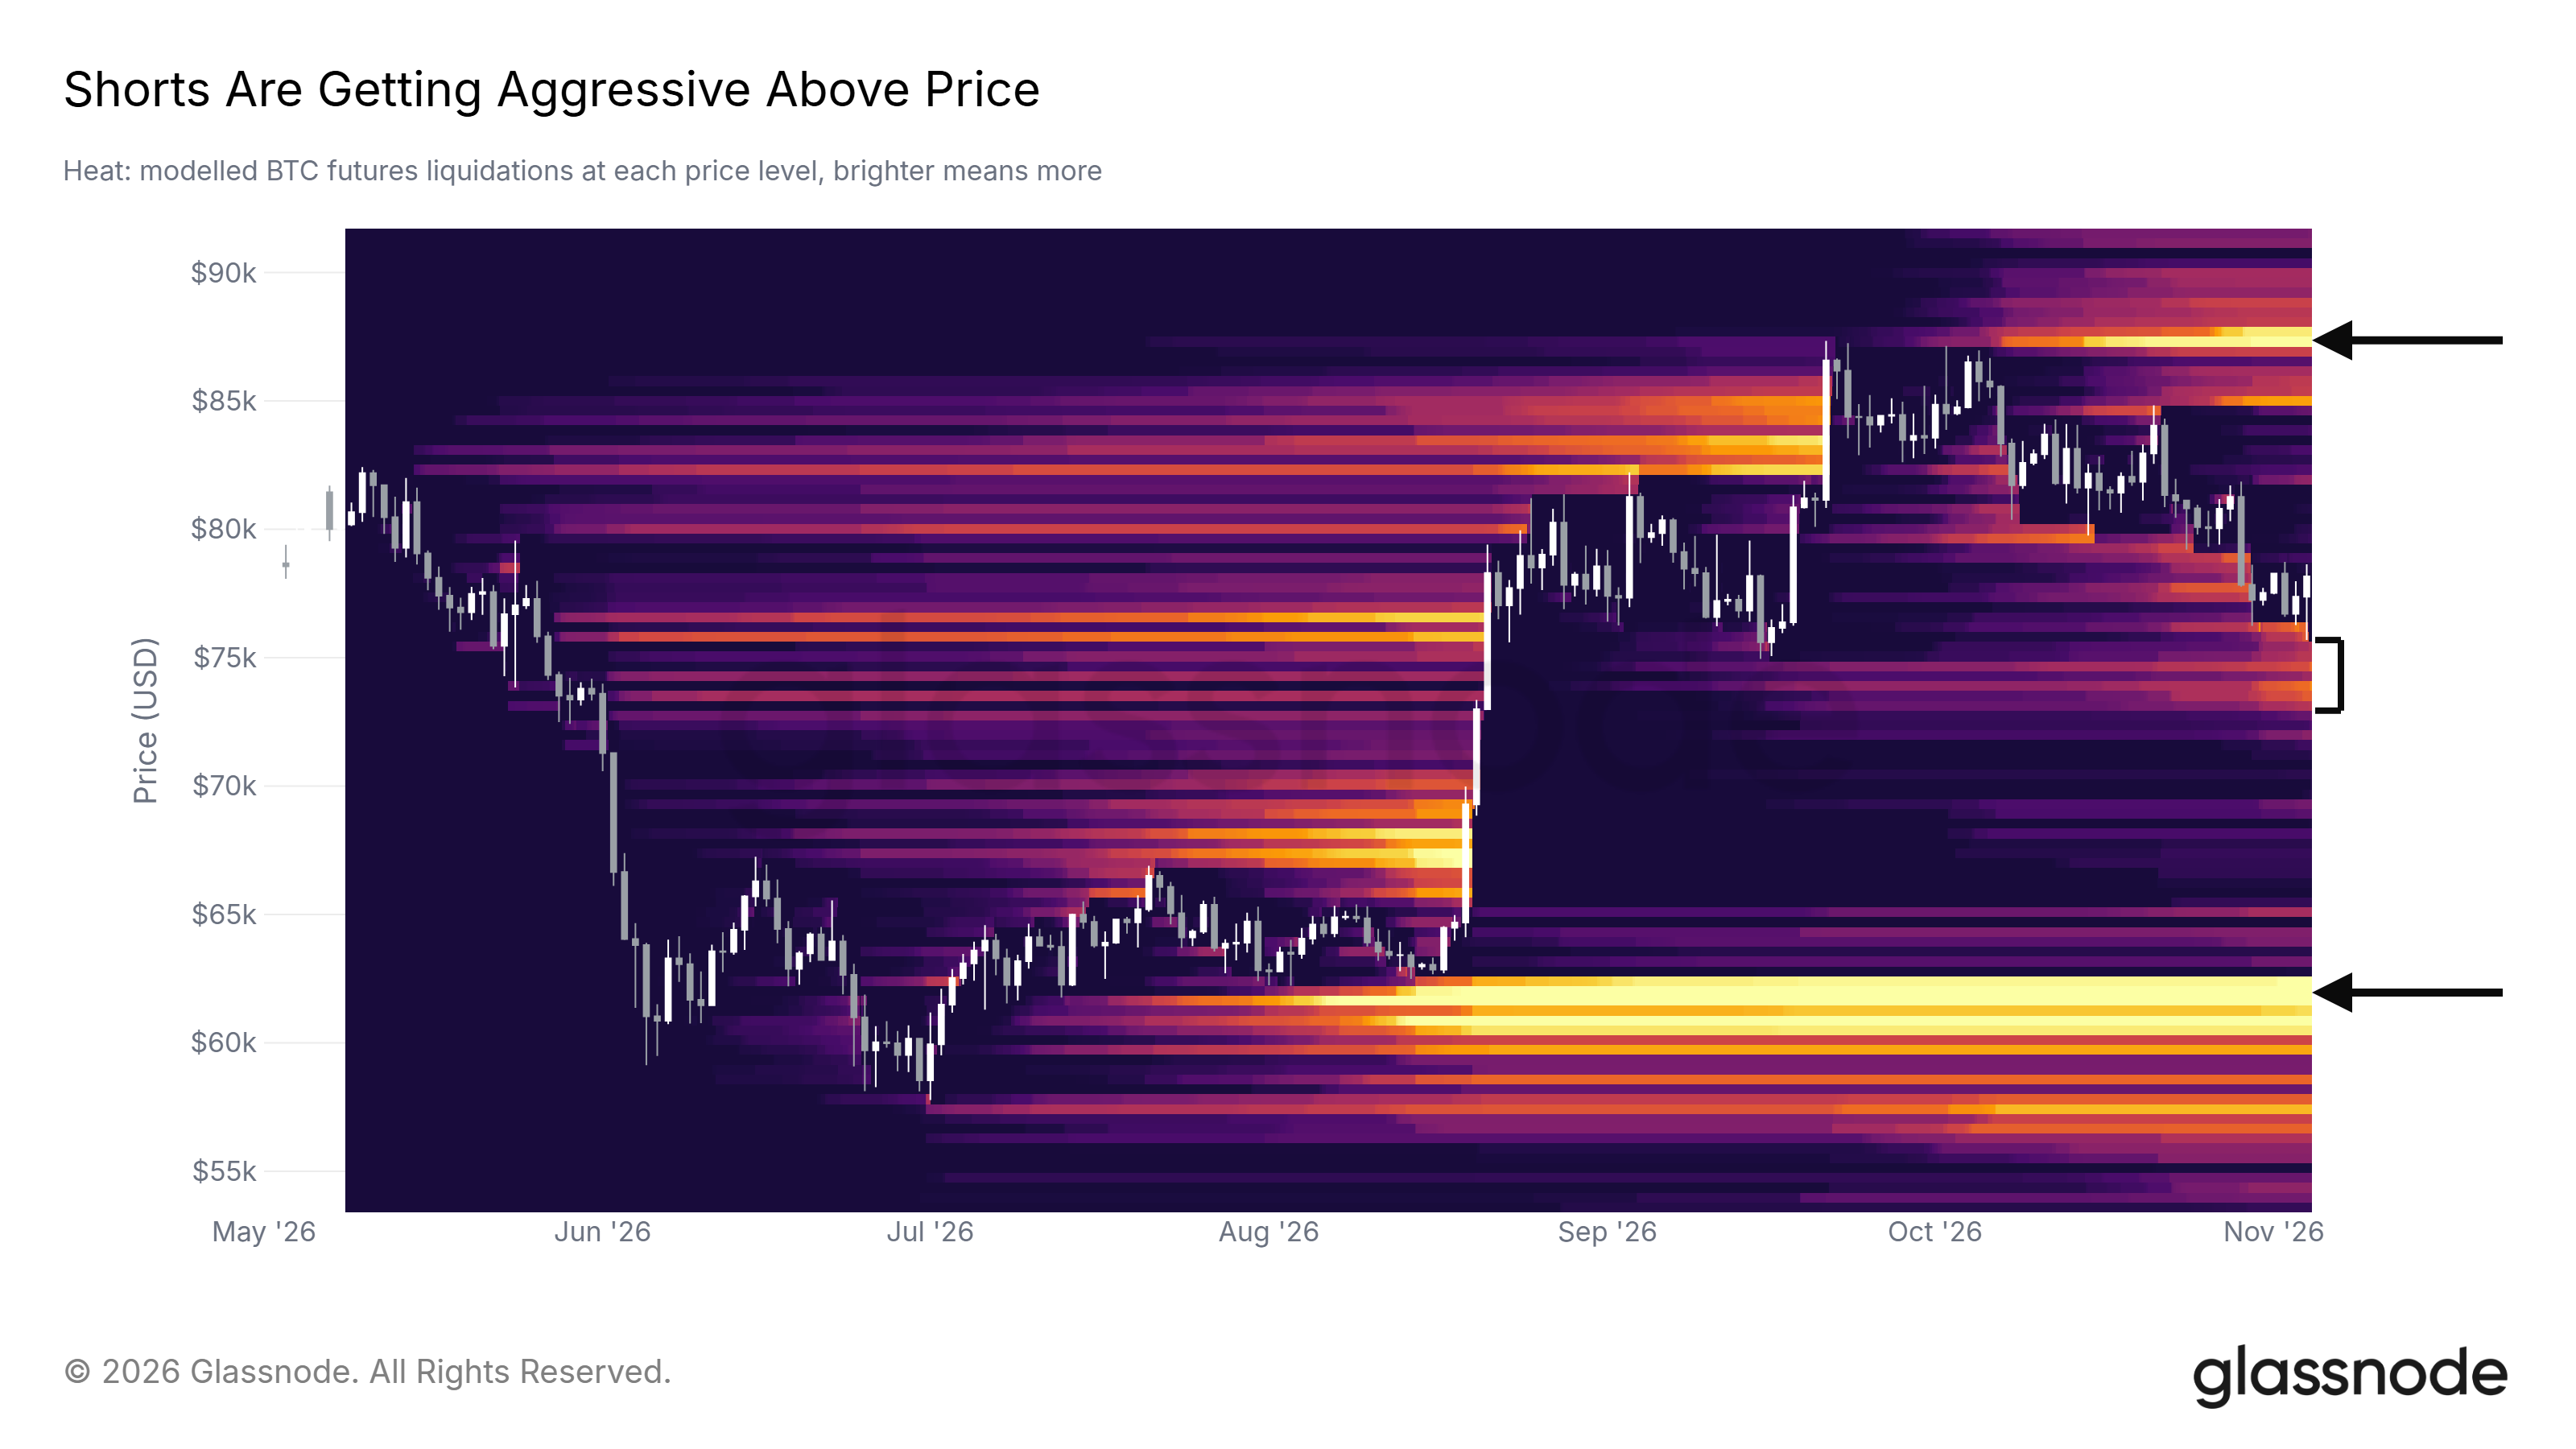
Figure: Total Bitcoin perpetual contract liquidation heatmap, long and short position distribution
In stark contrast to the significant reduction of long leverage, short liquidation positions above have sharply expanded in the past week, even though during this period Bitcoin's spot price has only declined by about 3.5%. This significant data divergence indicates that a large number of derivatives traders continue to aggressively short as prices persistently probe lower. The largest cluster of short liquidations currently towers around $87,000, coinciding closely with the phase high set in September. Once spot buying pushes prices into a rebound, these accumulated short positions will have to be forced to cover their losses, potentially providing ample short-squeeze fuel to push against that resistance level.
Options Market Bias Towards Bullish
Regarding the options market, the two largest pending contracts set to expire are on November 27 and December 25, carrying total value of pending contracts up to $5.7 billion and $12.5 billion, respectively. The maximum point price for these key deadlines (the strike price causing the largest proportion of options to expire worthless) is set at $80,000 and $76,000, aligned on either side of the current spot price, indicating that from the perspective of the options pain point mechanism, there is no absolute unidirectional magnetic attraction effect currently applying pressure in a single direction.
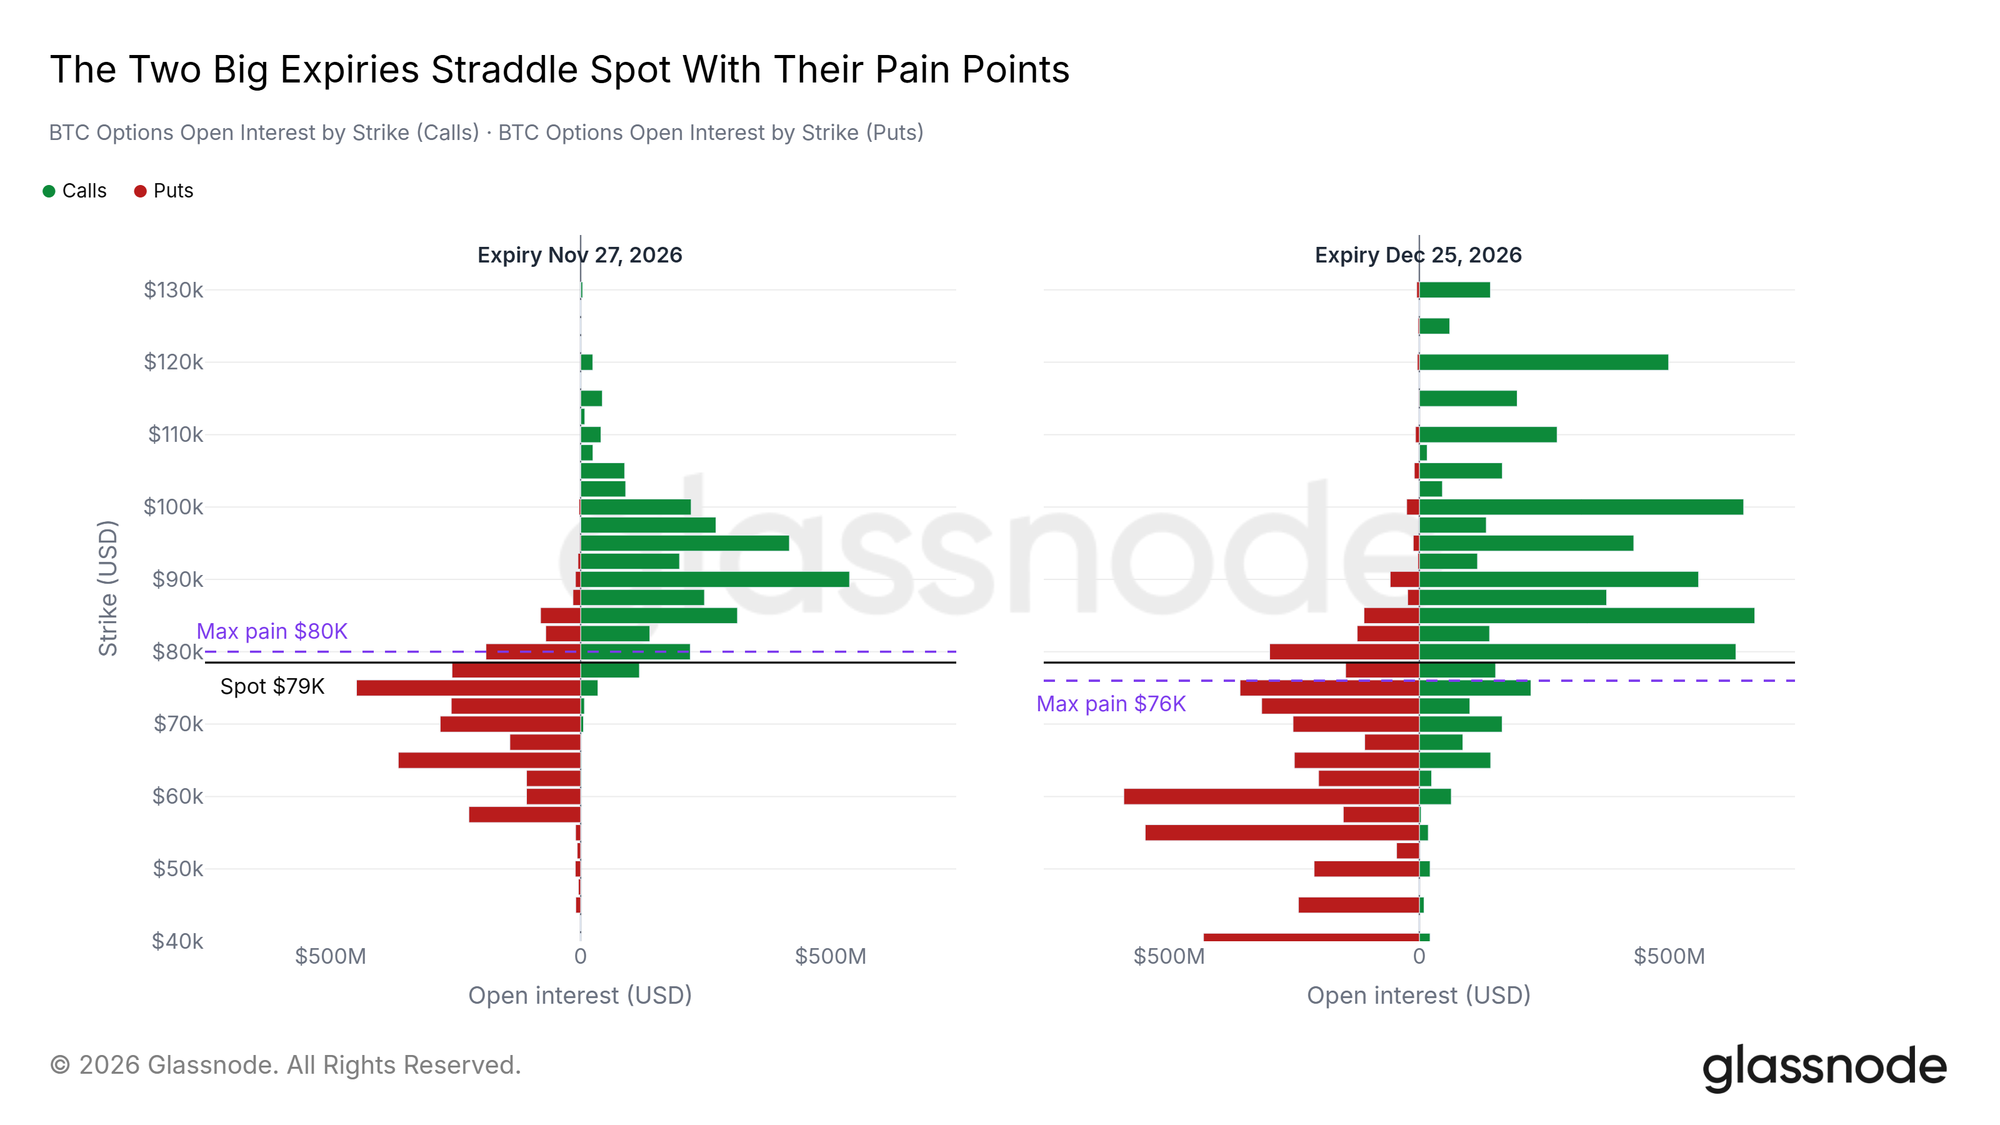
Figure: Distribution matrix of major options strike prices and open contracts before year-end
Across all option expirations, the total size of call options held by traders currently stands at about $18 billion, significantly surpassing the approximately $13 billion of put options. In the most critical contracts expiring at the end of December, the largest call options are clustered around the exceptional strike prices of $80,000, $90,000, $100,000, and $120,000; whereas the protective put options are mostly settled at $60,000 and below, primarily serving as tools to hedge against extreme tail risks. This asymmetrical distribution of chips clearly indicates institutional traders' strategic layout reflecting bullish structural expectations before year-end.
Trading Volume Remains Steady
Spot trading and ETF turnover volume surged during the technical breakthrough in August, maintaining relatively robust activity throughout September and October. In the past two weeks, the daily average spot trading volume across the network has stabilized at around $24 billion, which is about 50% higher than before the breakout in early August.
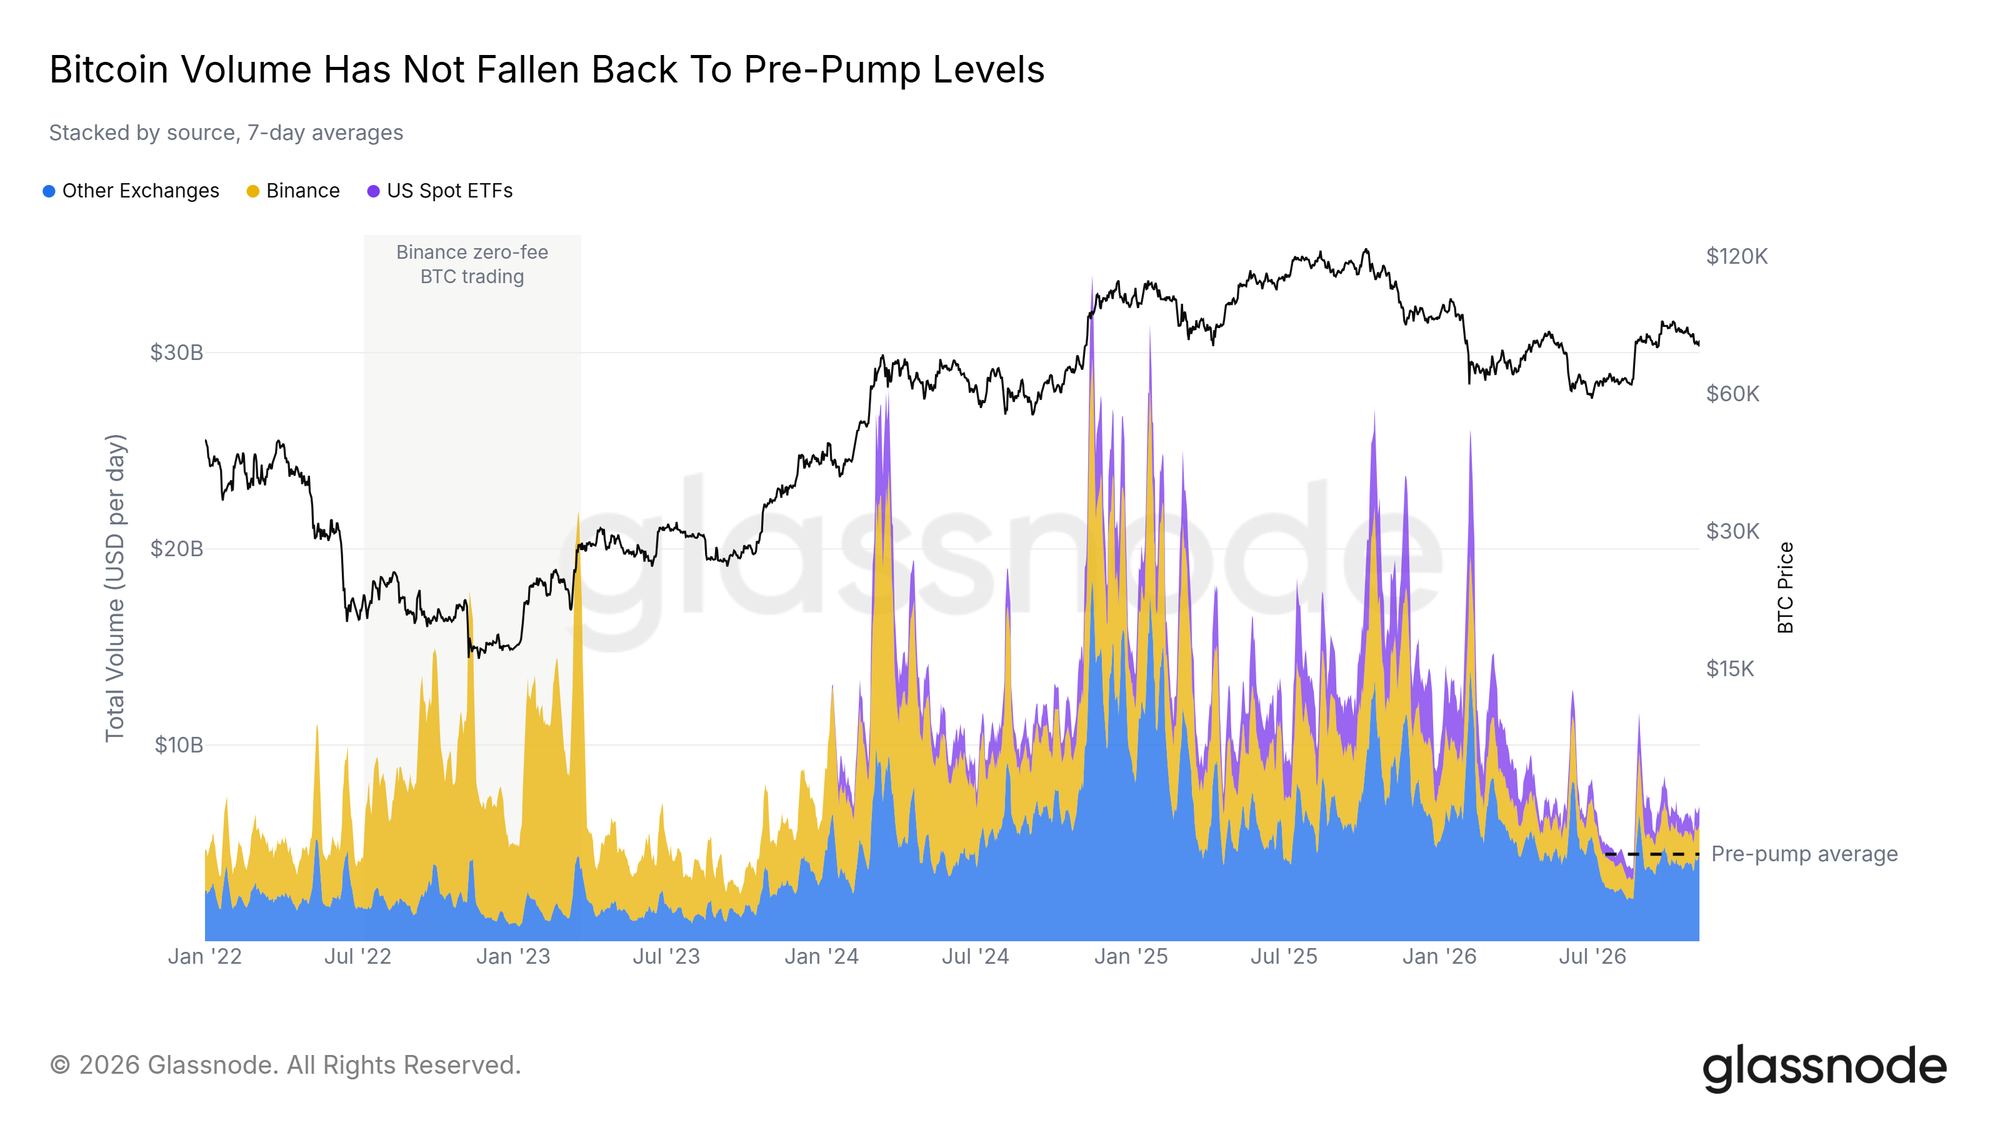
Figure: Daily average Bitcoin spot trading volume and ETF turnover trends
Indeed, when gauged against the enthusiastic frenzy during the initial approval of Bitcoin spot ETFs earlier this year, the current overall trading volume is still at a relatively mild central range. Nonetheless, the daily average trading volume, after undergoing a substantial correction, can still maintain at 1.5 times the pre-breakout level, indicating that the trading depth in the entire spot market remains solid and is not in a state of liquidity vacuum with no market absorption.
Spot ETF Funds Exhibit Caution
However, it is worth noting that the high spot trading volume currently sustained has an extremely limited contribution from the U.S. spot Bitcoin ETF channel. In the past two statistical weeks, the U.S. spot ETF has recorded nearly $1 billion in net fund outflow, with an average daily net outflow of approximately $115 million. Since mid-September, when prices regained the $85,000 level, the net inflow momentum from the ETF channel has visibly weakened and stagnated.
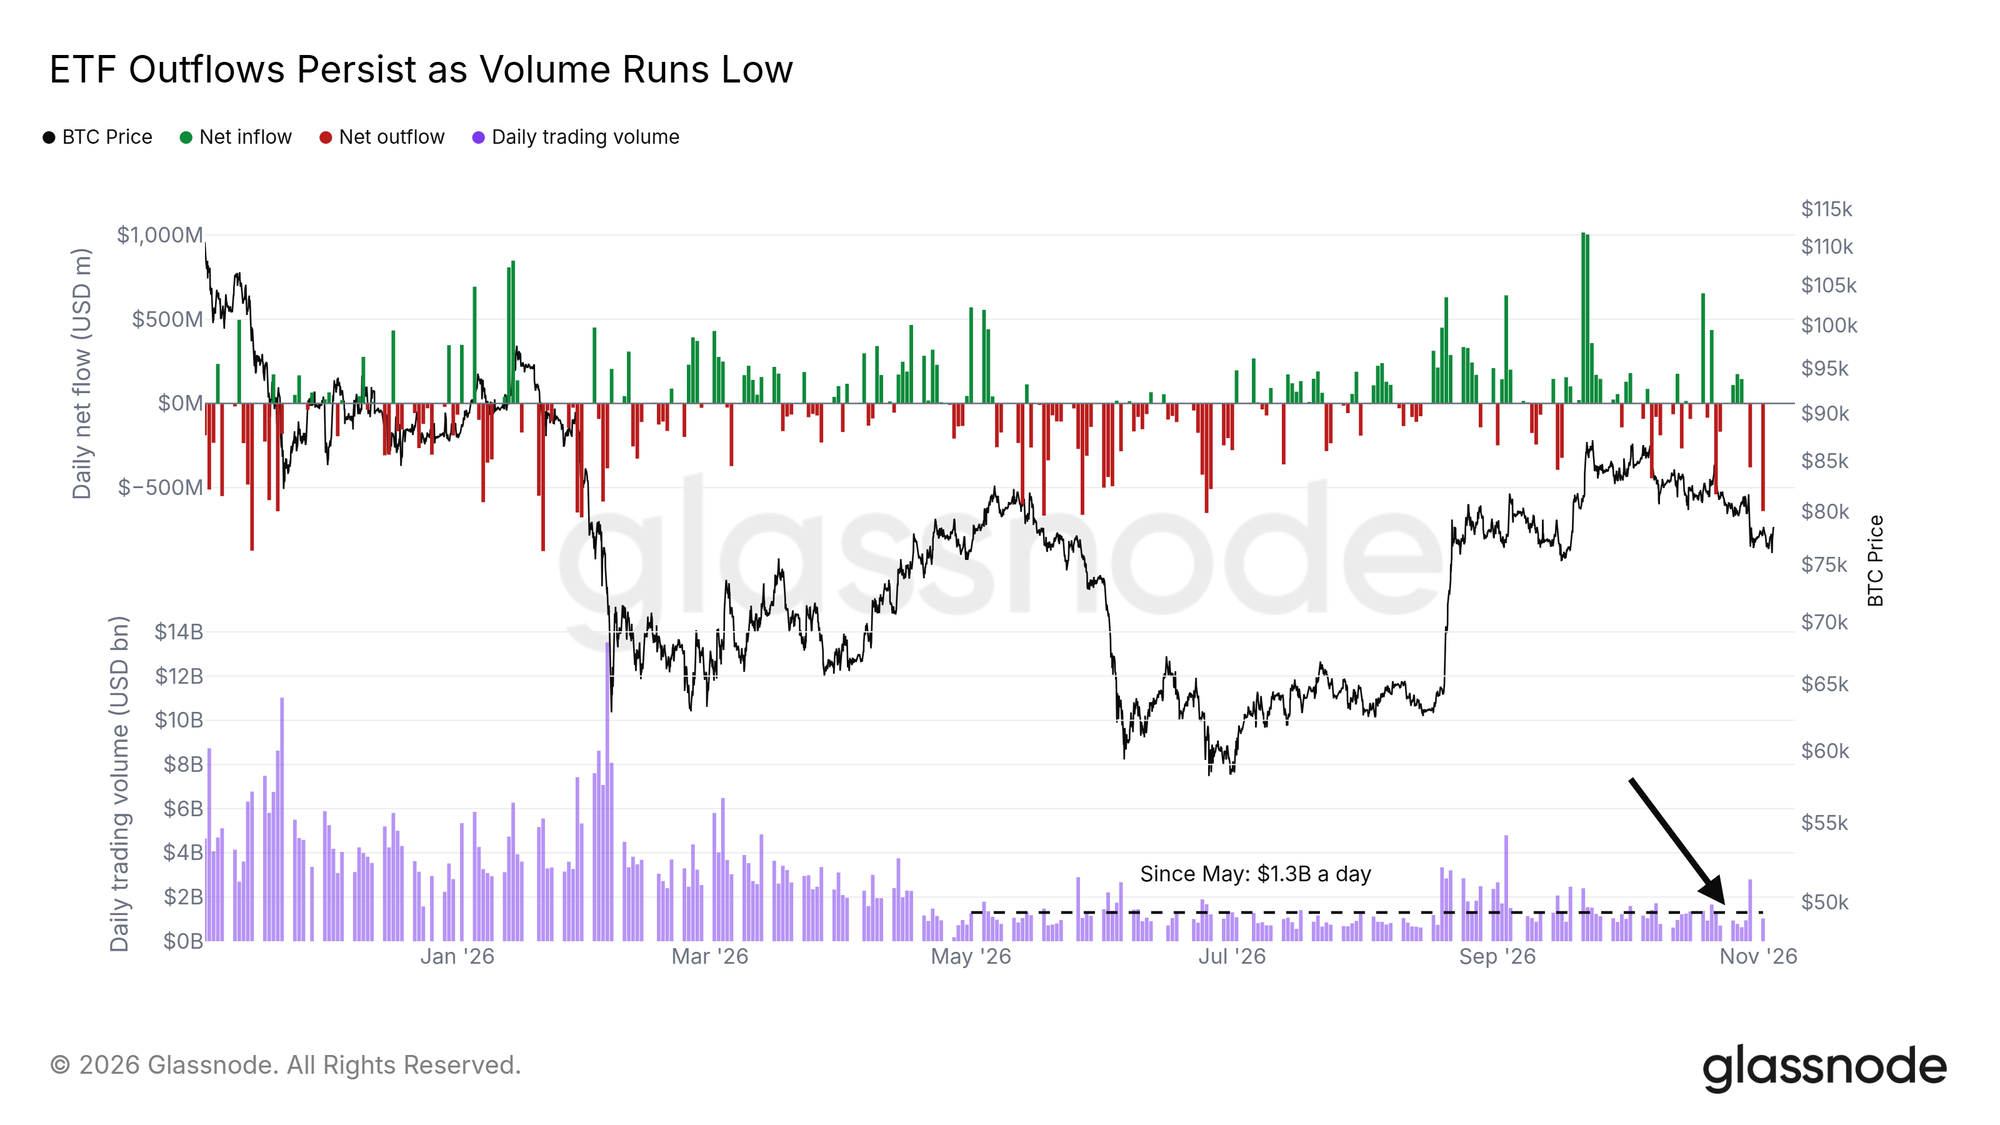
Figure: Recent sustained net outflow trends from the U.S. spot Bitcoin ETF
Our qualitative assessment of this phenomenon is as follows: the current market's absorption and trading turnover are primarily driven by existing funds within the crypto industry, more so involving structural reallocation and hedging of existing capital across different assets or derivatives accounts, while new incremental funds from traditional external institutions outside the crypto native space remain patiently on the sidelines due to uncertainties such as macro politics and elections.
Outperforming U.S. Stocks Benchmark
If we extend our focus to the macro asset performance over the past two months, Bitcoin has cumulatively dropped about 2%. This retracement magnitude is roughly in line with the S&P 500 index's less than 1% decline over the same period, but significantly outperforms major European indices like the Euro Stoxx, and considerably outruns the approximately 9% plunge in spot gold during the same timeframe. Although Bitcoin significantly led traditional indices at the beginning of October and subsequently retraced all excess gains during the correction, it did not lag behind the broader macro risk asset market rhythm throughout the entire pullback process.
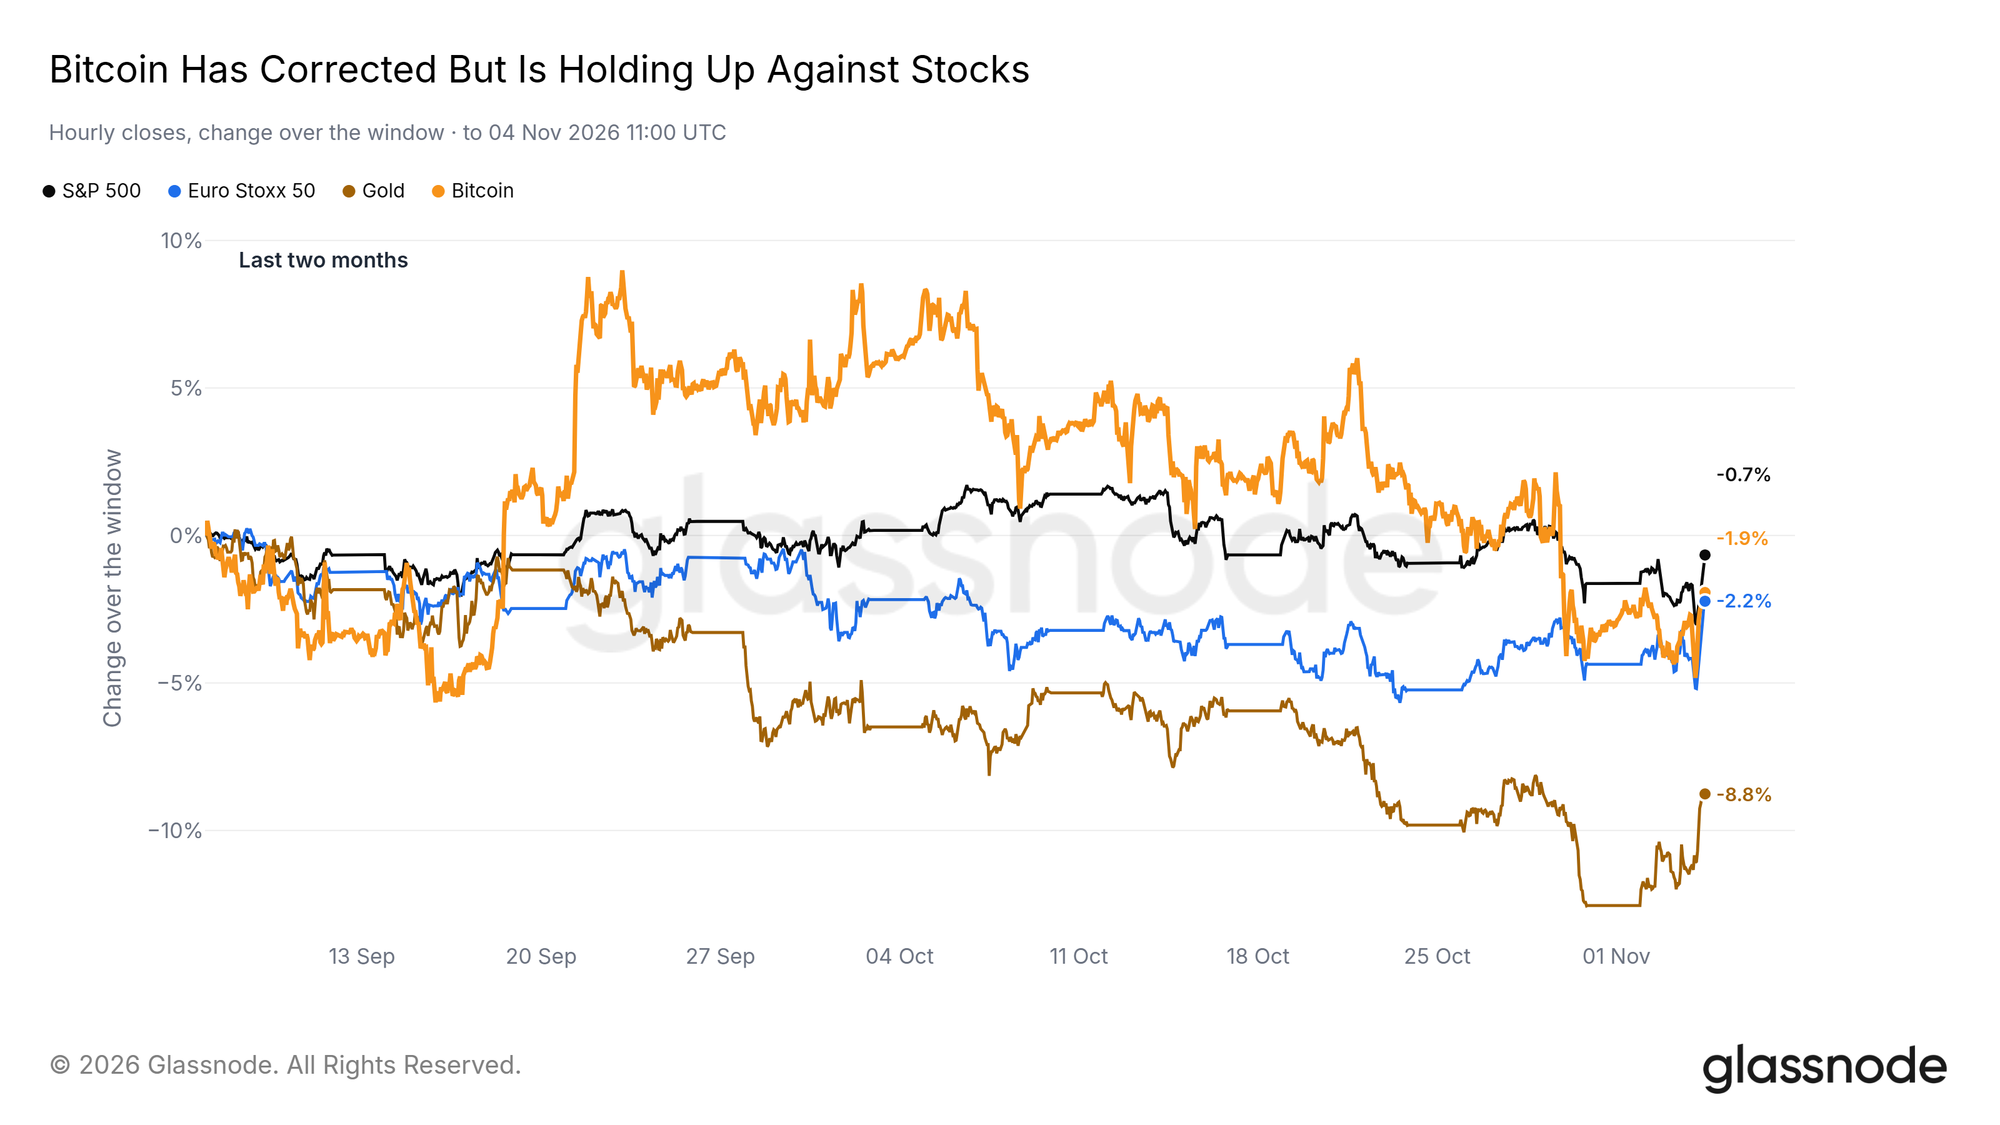
Figure: Comparative performance of Bitcoin against the S&P 500, gold, and other mainstream global assets
Returning to Balance with the S&P 500 Index
Within the statistical cycle of the past 90 trading days, Bitcoin has outperformed the S&P 500 index in exactly half of the trading days, displaying a slight lead in average daily performance as well. This signifies that Bitcoin's daily win rate against traditional U.S. equities has finally returned above the 50% watershed for the first time since March 2025.
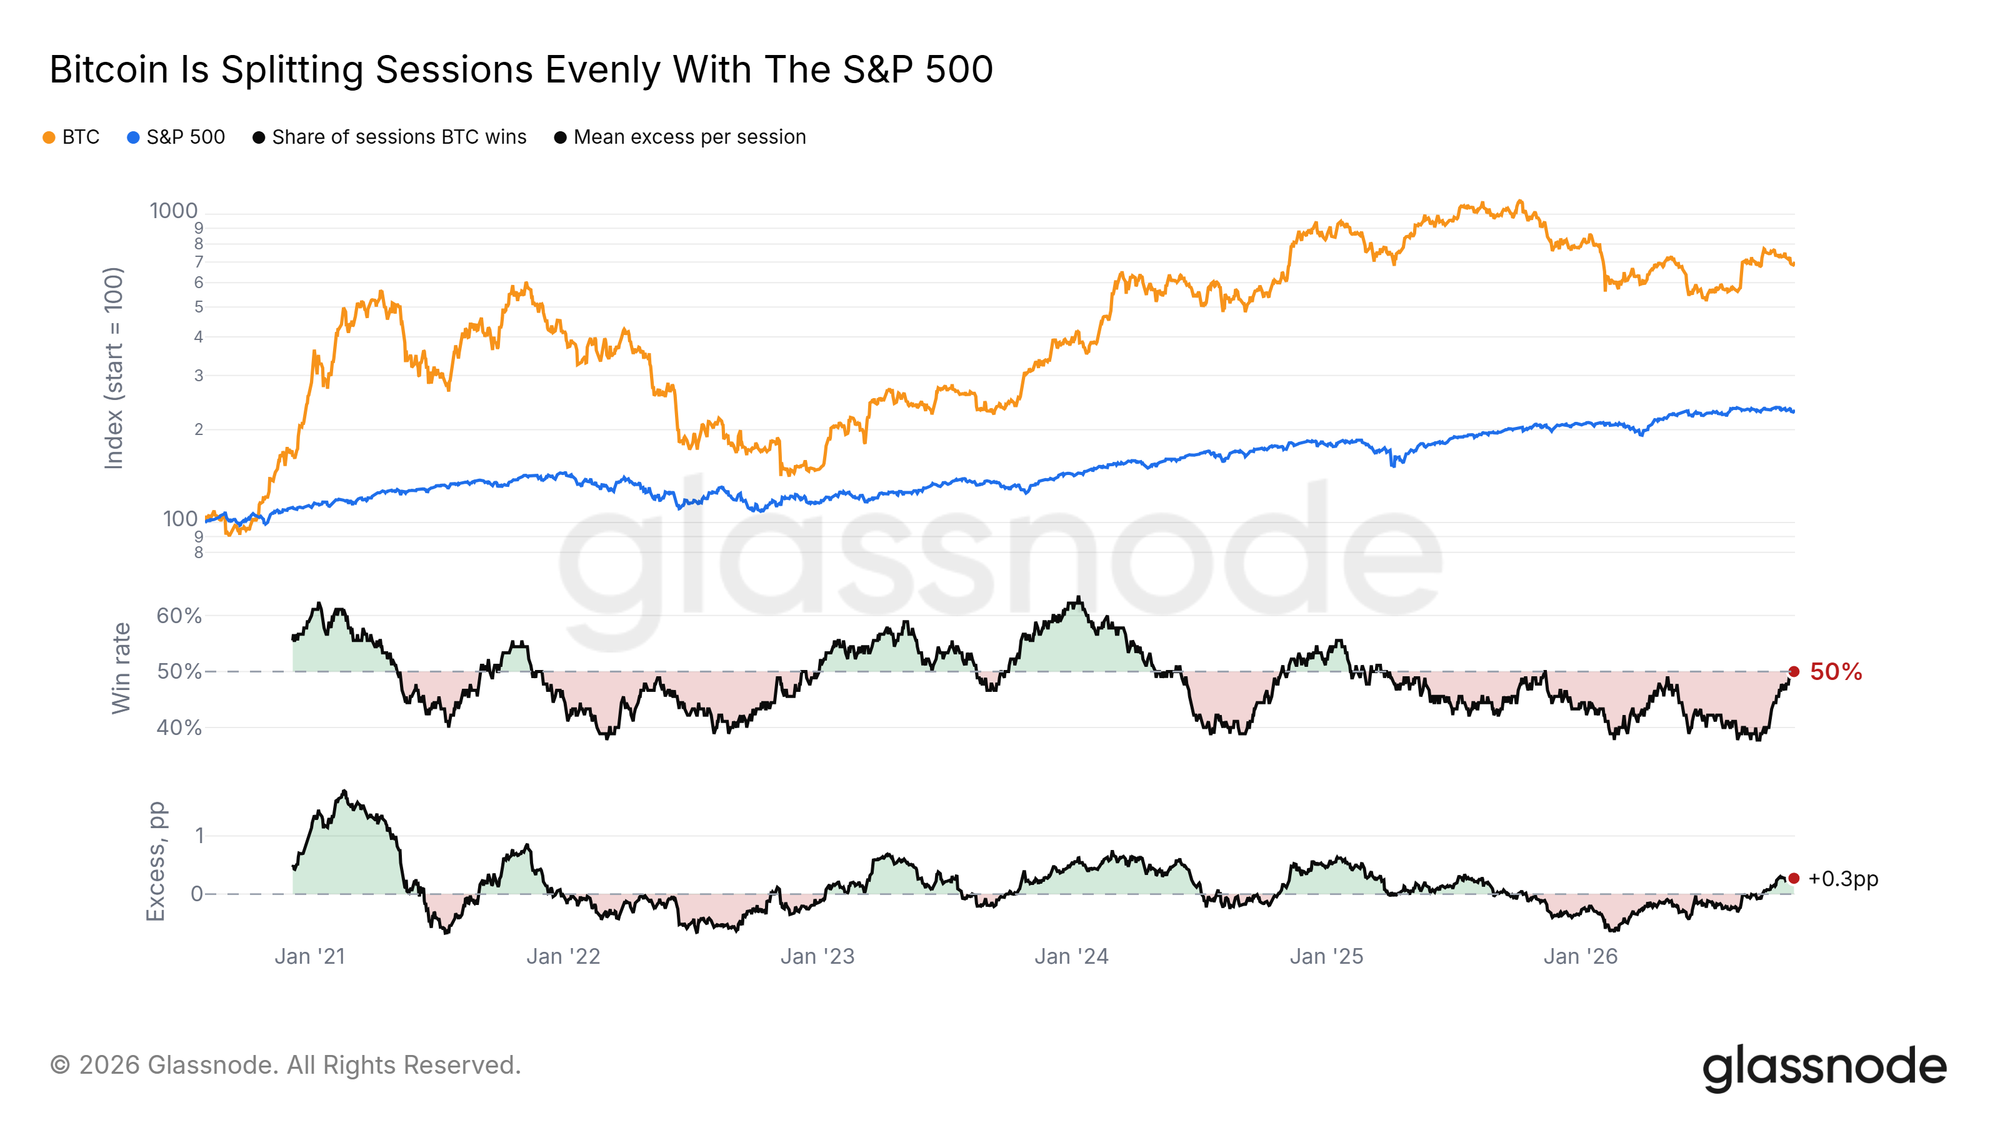
Figure: Rolling 90-day trading win rate trend of Bitcoin against the S&P 500 index
The return of the daily win rate to a balanced fifty-fifty distribution formally declares the conclusion of a long-lasting passive phase where Bitcoin continuously underperformed compared to the U.S. stock market for over a year. If this win rate indicator can effectively break through 50% and maintain an upward trajectory over the long term, it will serve as a key precursor for Bitcoin to re-establish its leading status in the macro capital pricing system over traditional stock asset cycles.
Digesting the Impact of Binance’s Historical Theft
On October 29, the world’s largest exchange, Binance, officially reported a significant security incident with its hot wallet, revealing that the amount involved was approximately $6.3 billion according to the platform’s own disclosure. This incident undeniably marks the largest single hacker theft in the history of the crypto industry, surpassing the total amount of losses from the nine largest security incidents previously recorded in the industry.
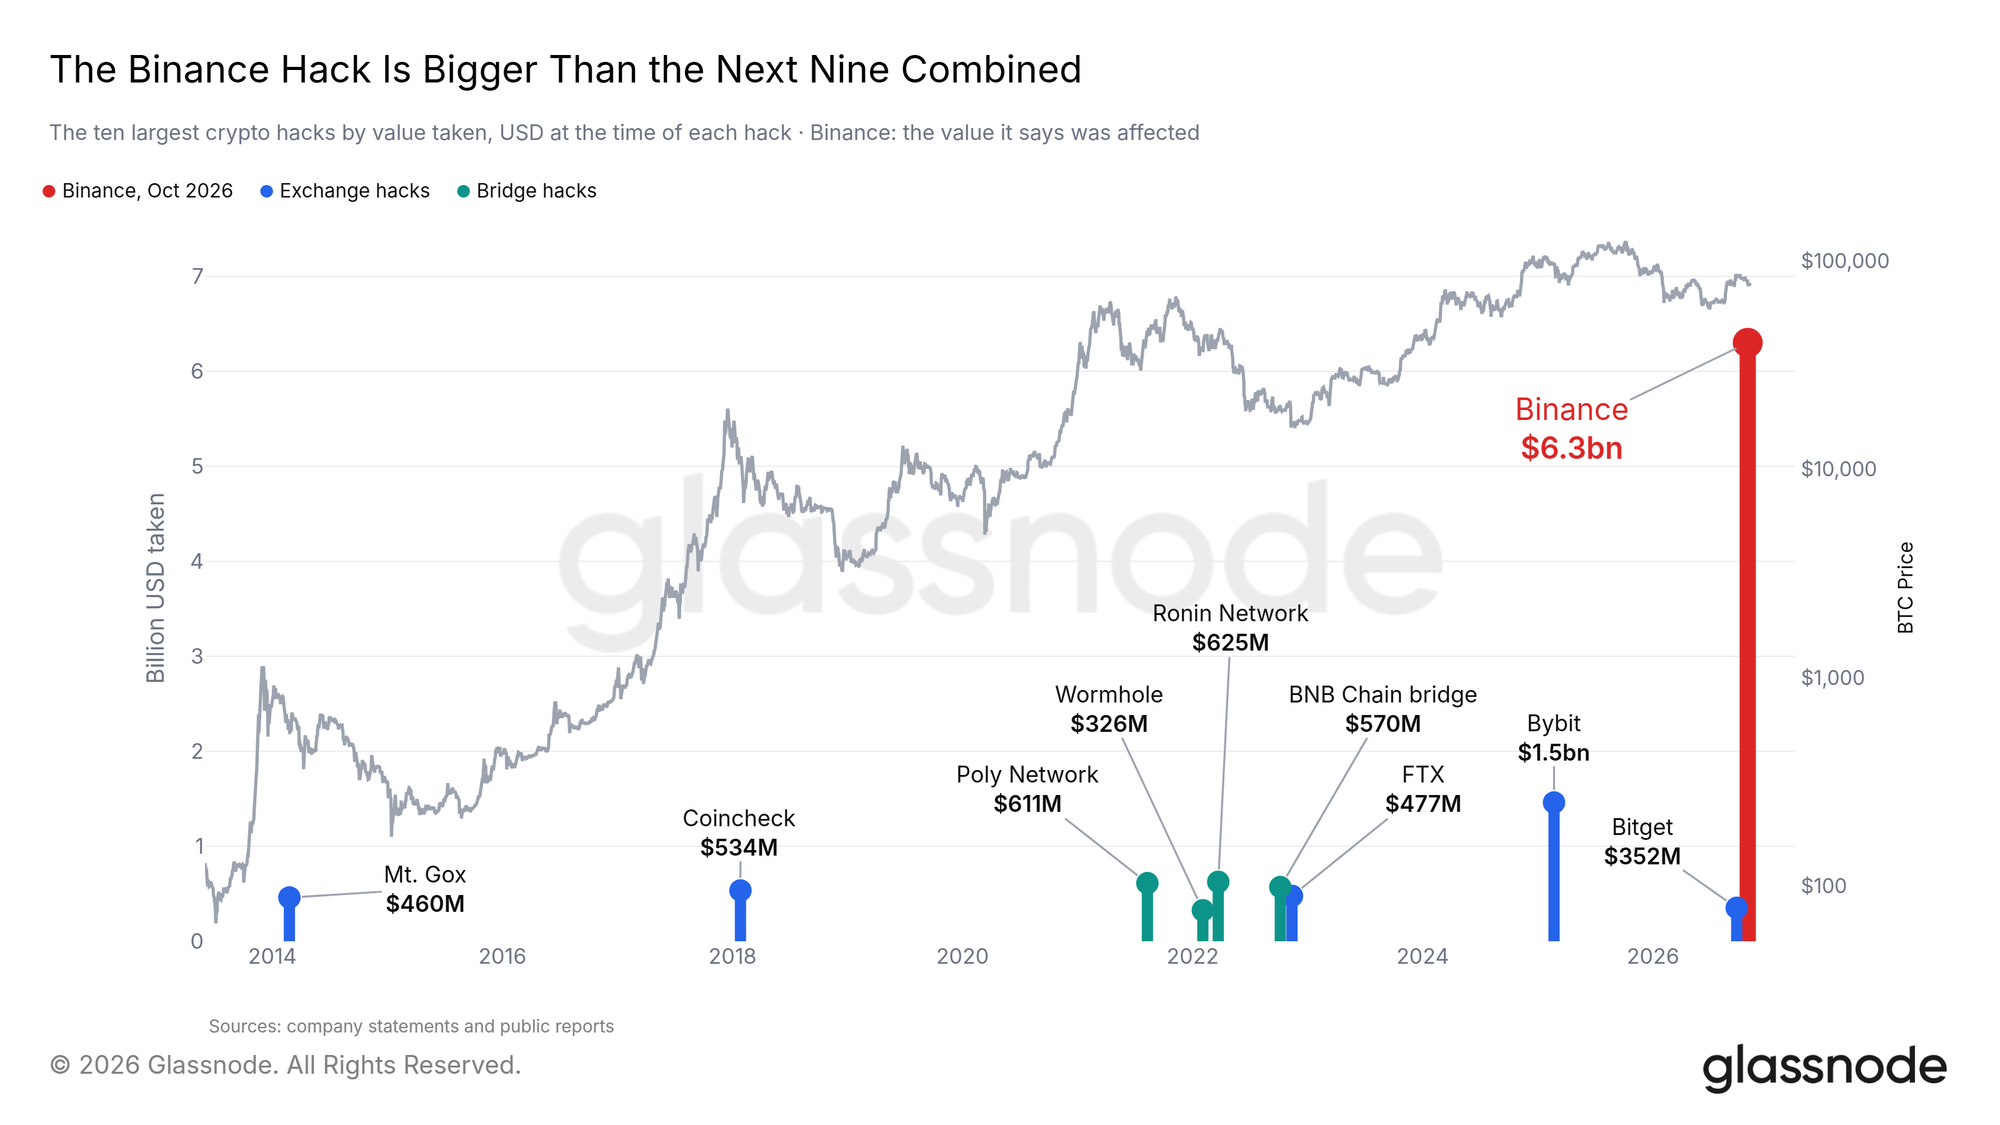
Figure: Recap of Bitcoin spot price trends before and after Binance's historical hacking incident
However, contrary to the expectations of the vast majority of market participants, within a few days after the incident broke, the Bitcoin spot price only experienced about a 3% brief dip, and quickly rebounded back to near the point before the abnormal capital outflow occurred. In the face of such a significant extreme bearish shock, the market's response has been notably restrained and calm, which fundamentally serves as strong evidence of the market’s deep liquidity absorption capacity and inherent resilience. As long as new external funds are injected in the future, a trading base that has fully digested and withstood such a colossal black swan event will possess immense upward rebound potential.
After the Midterm Elections' Fallout
In the U.S. midterm elections held on November 3, the Democratic Party delivered an unexpectedly strong performance, taking control of both the House and Senate. Reflecting on the historical three midterm election cycles, Bitcoin usually undergoes a final wave of deep declines ranging from 15% to 50% within two to ten weeks after election day concludes before establishing a macro bottom for its four-year cycles.
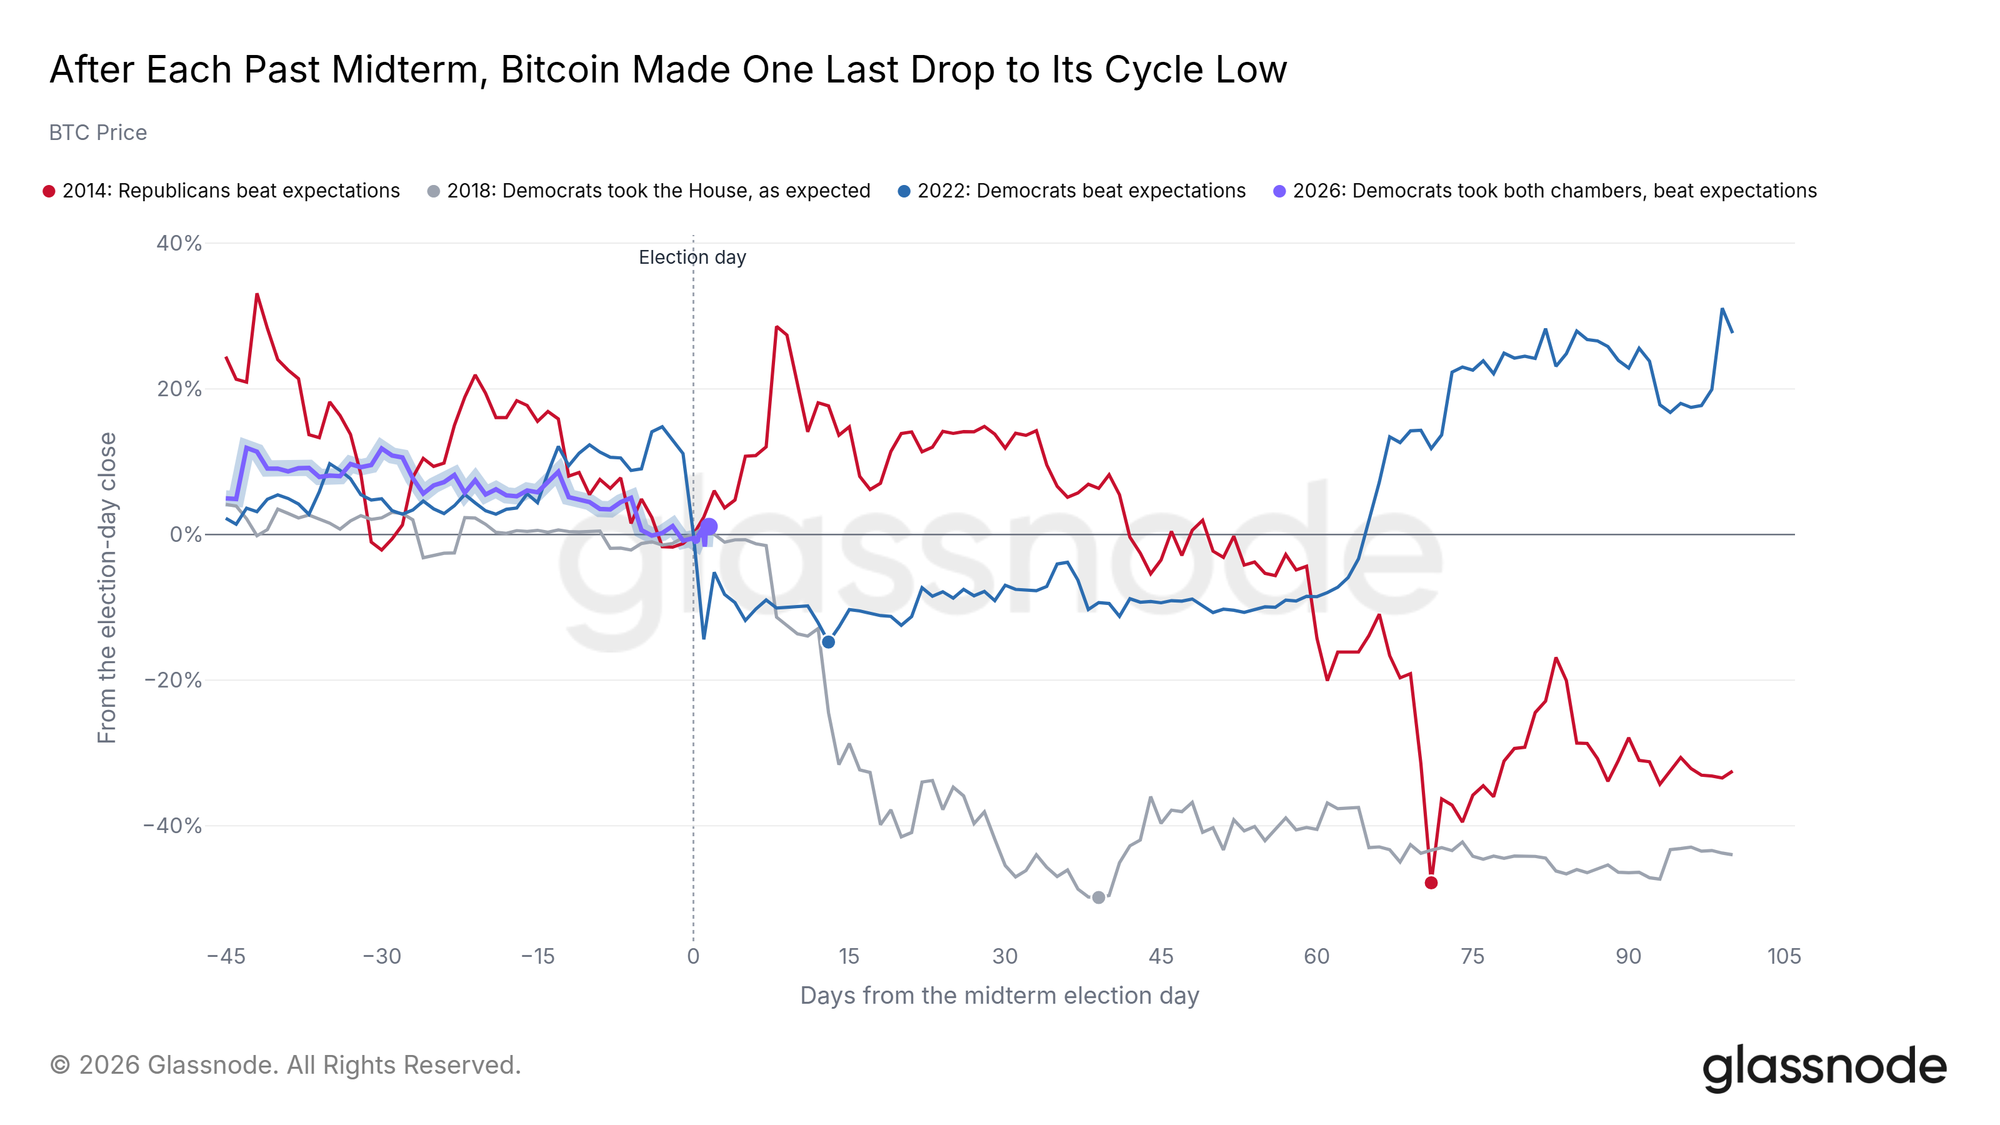
Figure: Comparison of Bitcoin price cycle retracement paths before and after historical U.S. midterm elections
However, in stark contrast to historical scripts, this cycle's adjustment has largely been fully priced and released by the market ahead of election day: from the September highs to election day, Bitcoin had already retraced about 11%, and after the election results were finalized, the price slightly rebounded by about 1.5%. Looking long-term, the entire industry does indeed need to gradually adapt to a new Congress fully dominated by the Democratic Party; but it is worth highlighting that Bitcoin today, in terms of its integration depth with the traditional Wall Street financial system, is far from comparable to the past, where major traditional banks, multi-billion dollar asset management institutions, and the deep entry of spot ETFs have rendered the risks of party rotation from Washington no longer as disruptive as a few years ago.
Altcoin Cleanup and Surrender
In contrast to Bitcoin's gentle resilience, the technical correction in the altcoin market has been significantly more severe. The short-term holder realized profit ratio (STH-SOPR) measures precisely whether short-term traders are selling tokens at a profit (indicator above 1) or selling at a loss (indicator below 1). In the soaring market at the end of September, nearly 80% of the tokens among the over 300 mainstream altcoins we continuously track had their short-term holders celebrating profit-taking.
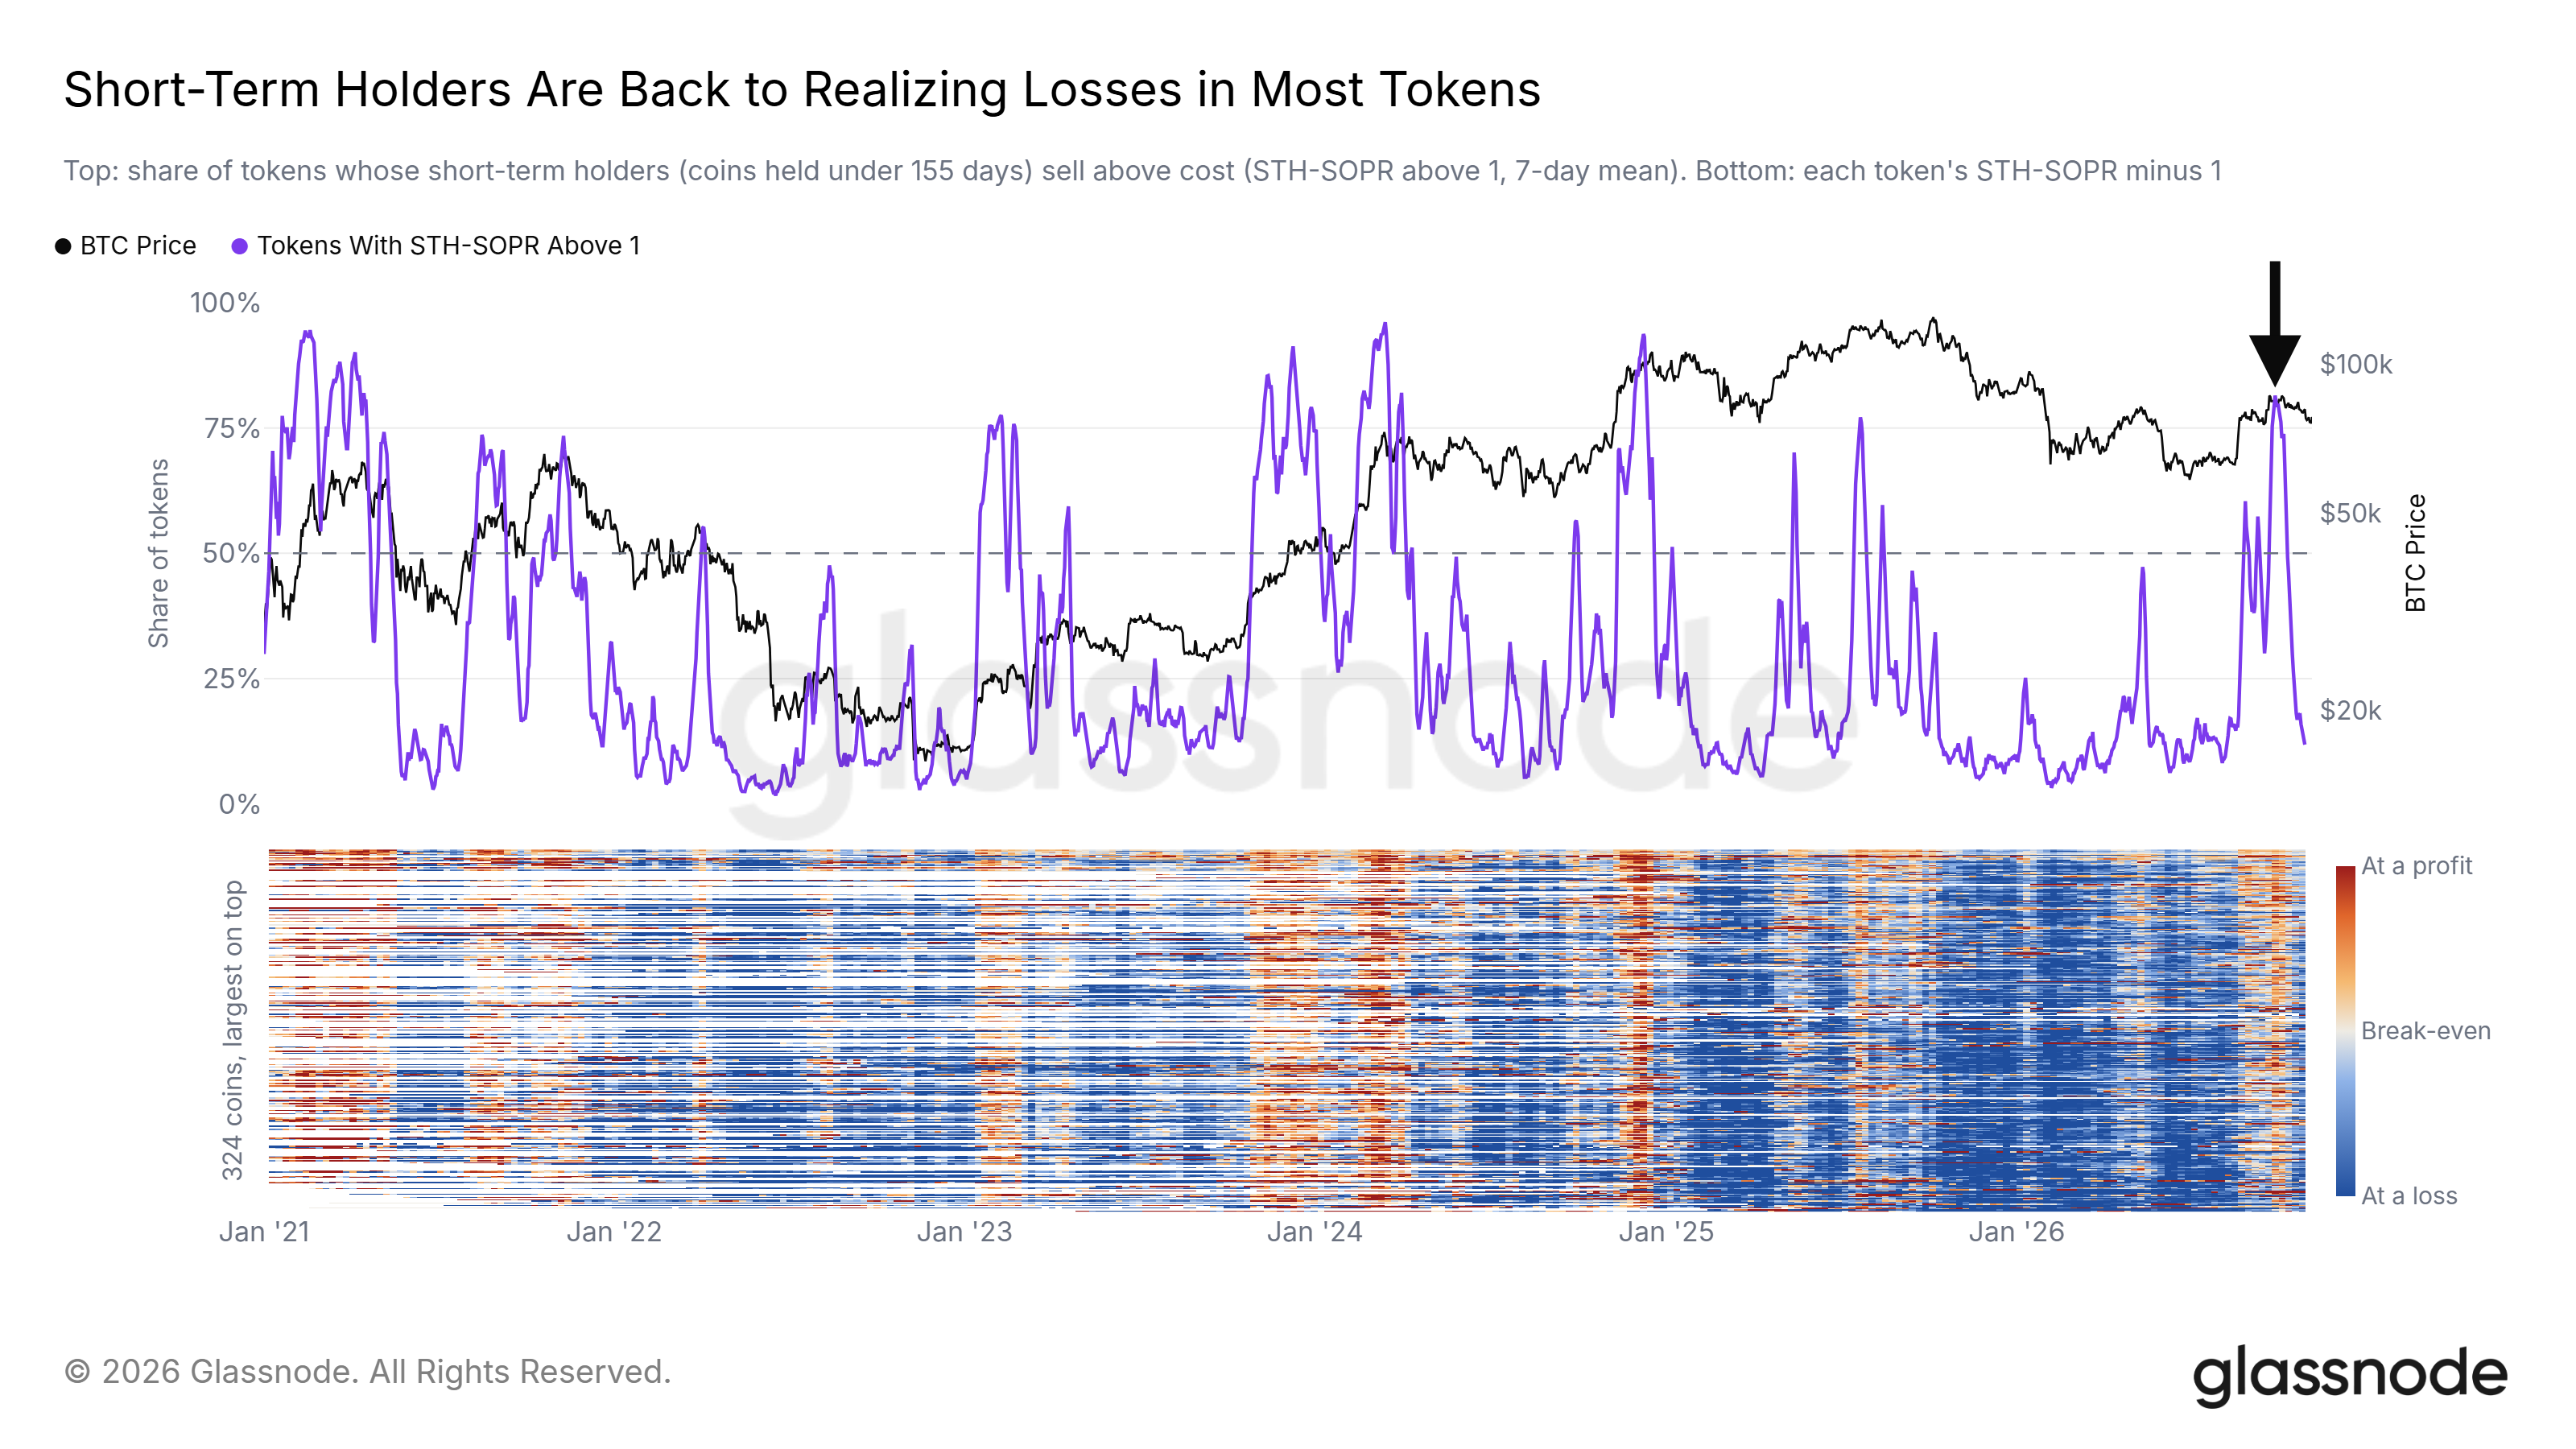
Figure: The short-term holder realized profit ratio for the tracked 300+ altcoins plummets sharply
By the end of October, this floating profit ratio had plummeted to only about 12%, with the vast majority of altcoin short-term holders now passively selling at a small loss. The previous strong profit positions have completely transformed into today’s panic selling. As long as Bitcoin can continue to hold its key moving averages, an altcoin market that has completely cleared out the recent overly speculative profit positions will be in a much healthier bottom position than the extremely crowded and overheated speculation feast at the end of September.
Conclusion
In summary, Bitcoin has essentially fully digested and cleared out the excessive speculative bubble accumulated in September: the short-term holder chips have shifted from nearly widespread floating profits back to a significant unrealized loss, the altcoin speculative positions have undergone deep cleaning, and the spot price is retouching and confirming the technical validity of the breakthrough made in August in an extremely standard manner. The overall spot trading volume remains robust, and even faced with the black swan impact of a historical exchange theft, it has not breached the defense line, with the only missing piece being that traditional new funds from outside the crypto space have not yet fully returned.
Compared to the fragility and volatility seen at the peak in September, the current market structure undoubtedly offers a more healthy and balanced risk-return intervention window. The most crucial monitoring defense line for future movements is located in the composite dense range of $73,000 to $76,000, reinforced by the short-term holder cost baseline, the critical 200-day moving average, and a large number of contract liquidation bases. As long as this defense line is not effectively breached, the current retouch can still be qualitatively defined as an extremely healthy chip turnover and technical reset within the upward trend established since August; only a successful breach of $73,000 would indicate that the market needs to enter a more long-term box oscillation consolidation.
免责声明:本文章仅代表作者个人观点,不代表本平台的立场和观点。本文章仅供信息分享,不构成对任何人的任何投资建议。用户与作者之间的任何争议,与本平台无关。如网页中刊载的文章或图片涉及侵权,请提供相关的权利证明和身份证明发送邮件到support@aicoin.com,本平台相关工作人员将会进行核查。


