ETH/USDT perpetual latest report is approximately 2,426.23 USD, with an increase of about 5.37%. The four-hour chart shows a significant rebound candlestick: opening around 2,243.41 USD, reaching a high of about 2,434 USD, a low of about 2,216.94 USD, and then closing near 2,426.23 USD. Meanwhile, the MACD histogram has turned clearly positive, and the short-term moving averages have begun to converge upwards.
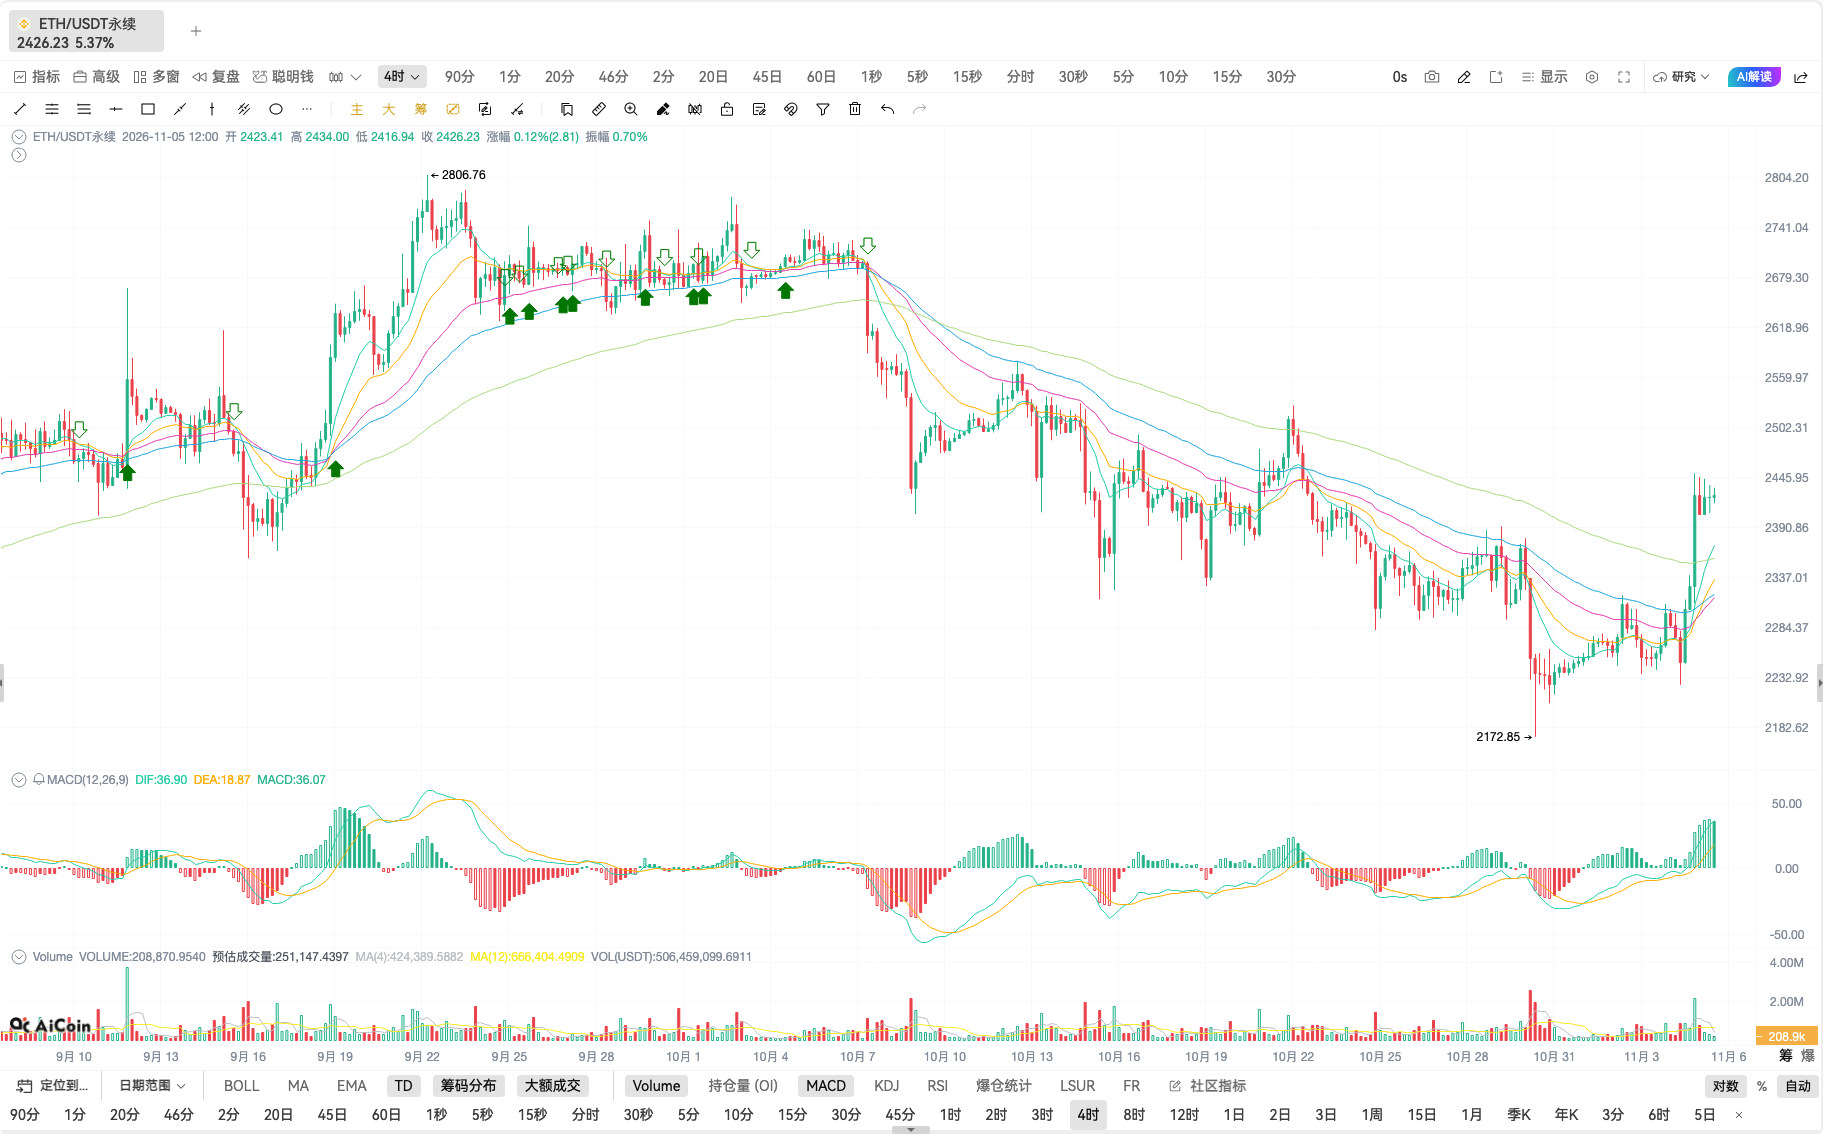
These changes indeed make the "bullish counterattack" a scenario worth discussing. However, the resonance of bullish signals does not mean that the trend has already reversed. Because the same chart also shows that ETH has continuously pulled back from about 2,806.76 USD, reaching a low of about 2,172.85 USD. A strong rebound may be the starting point of a new round of upward movement, or it may just be a corrective bounce in a downward trend. The key to distinguishing between the two is whether the rebound can change the price structure, not just whether the increase is noticeable enough.
First Layer Signal: Price Strongly Rebounds, Increased Short-Term Buying Initiative
The current four-hour candlestick started at about 2,243 USD, dipped to about 2,217 USD during the session, then strongly surged to near 2,434 USD, and recently returned to 2,426 USD. The price action reflected by the body and upper shadow indicates that selling pressure at lower levels was quickly absorbed, and buyers significantly enhanced their initiative during this period. Compared to a small rebound that barely closed positively, this kind of large recovery of lost ground is more worthy of attention.
However, a single large bullish candlestick can only prove that buying strength is stronger in this period, not alone prove that buyers have taken control of the subsequent trend. Next, we need to observe whether the price can hold around the breakout starting point during any pullback and whether it continues to form higher lows afterward. If the price quickly falls back into the body of the large bullish candlestick or even returns below 2,300 USD, the validity of the short-term breakout will be discounted.
Second Layer Signal: Moving Averages Start to Repair, But “Bullish Arrangement” Still Needs Confirmation
In the candlestick chart, the price has quickly pulled back above multiple short-term moving averages, and several moving averages have begun to converge with signs of turning upwards. This is an early signal of trend repair: the price is no longer continuously suppressed by short-term moving averages, and the cost area for short-term traders is beginning to improve. If the subsequent short-term moving averages continue to cross above the longer-term moving averages, and the overall moving averages turn from downward pressure to upward divergence, it will be closer to what is commonly referred to as a bullish arrangement or moving average resonance.
Third Layer Signal: MACD Momentum Turns Positive, Need to See if It Can Continue
The MACD values in the candlestick chart are approximately DIF 36.90, DEA 18.87, histogram 36.07, with the histogram clearly turning positive and expanding. This corroborates the significant price rebound, indicating that the recent upward momentum has strengthened, which is important technical evidence for this round of rebound.
However, MACD is a momentum indicator calculated from historical prices; a strong candlestick will quickly push the histogram higher; if the price then oscillates sideways or pulls back, the histogram may also quickly contract. To determine whether the momentum constitutes sustained resonance, we need to observe whether DIF and DEA continue to trend upwards and whether the histogram continues sequentially, rather than concluding based on a single positive bar.
Key Contradiction: Short-Term Strengthening, but Four-Hour Big Structure is Still Repairing
From the perspective of the candlestick chart range, ETH formed a stage high near 2,806.76 USD, followed by a clear downturn, with a stage low around 2,172.85 USD. Although the latest price has rapidly rebounded, it is still within the prior falling structure. In trend analysis, a large rebound does not automatically mean the downtrend has ended; more importantly, whether the price can break through the previous rebound high and hold when retesting.
On the short term, we can first observe whether the recent high near 2,434 USD can be effectively broken through and stabilized, and then pay attention to the trading area near 2,500—2,560 USD, where there have been previous trades and fluctuations. If ETH can gradually recover these positions and form higher lows during pullbacks, the argument for bullish resonance will be more complete. Conversely, if it is blocked near 2,434 USD, subsequently retracting and falling below the recent repair area around 2,300 USD, the situation will look more like a rebound after a decline, rather than a confirmed trend reversal.
The trading volume has increased significantly during the rapid rise, providing support for participation in this round of rebound. However, the increased volume in a single period may also include short covering, short-term chasing, or position adjustments, which is insufficient to confirm new trend-buying alone. It is necessary to combine whether the subsequent rise still has volume support and whether selling pressure weakens during pullbacks to make a judgment.
“Bullish Resonance” Requires Price, Moving Averages, and Momentum to Form an Evidence Chain
The current latest assessment is: price has strongly rebounded, short-term moving averages have begun to repair, and MACD momentum has turned positive, with the three showing preliminary consistency in the short-term direction. This is the embryonic form of potential bullish resonance.
To upgrade the "embryonic form" to "the counterattack gets confirmed," at least a few follow-up validations need to be seen: first, ETH needs to break through and stabilize around the recent high near 2,434 USD; second, short-term moving averages must continue upwards and gradually form a bullish arrangement; third, MACD momentum should not rapidly diminish; fourth, during pullbacks, it should not fall below recently formed key lows. If only the indicators move upwards but the price fails to break the resistance, the so-called resonance remains at the technical indicator level.
Multi-Account Ordering: Execute Verified Strategies More Disciplined
Market analysis answers "whether the signals are sufficient and which conditions have not been met"; multi-account ordering resolves "how to execute multiple accounts more efficiently when traders already have a clear plan." If multiple accounts undertake the same strategy but with different planned order sizes, switching accounts one by one and repeatedly entering quantities is both time-consuming and prone to account or quantity errors.

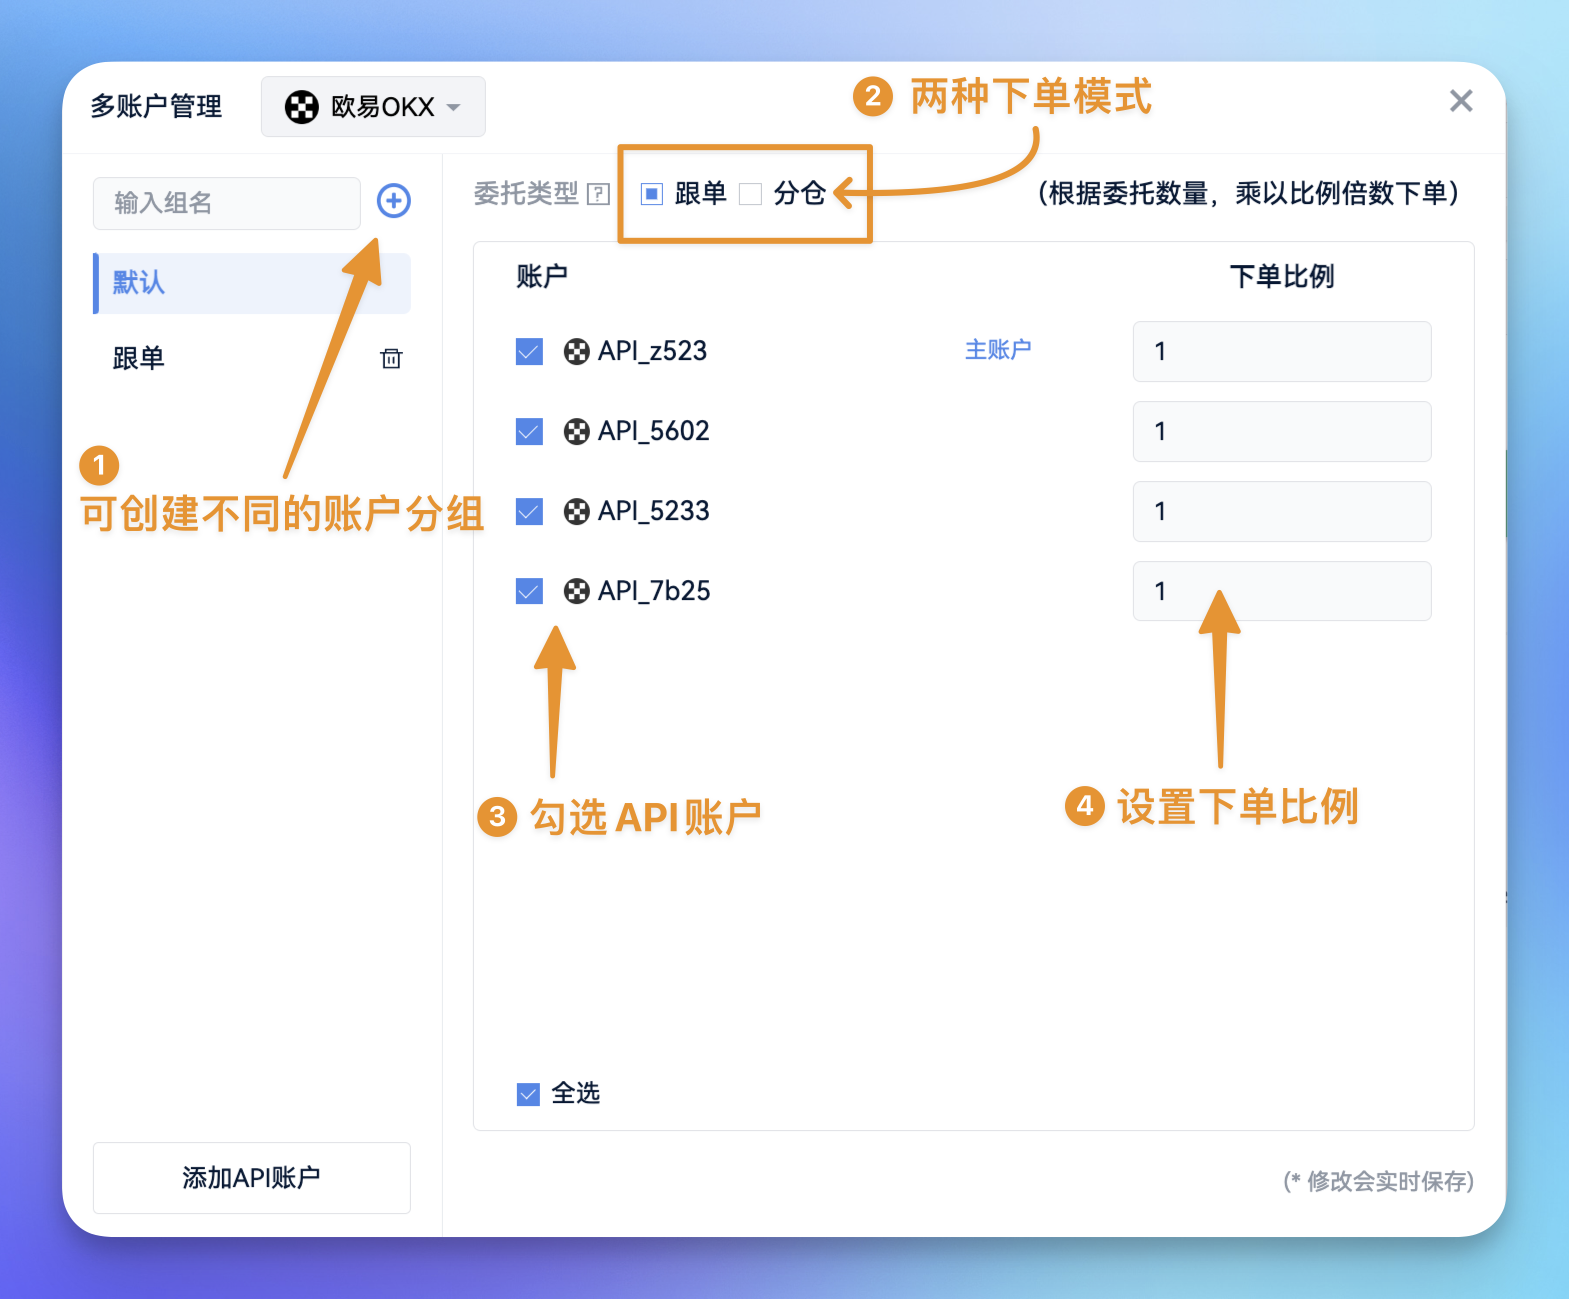
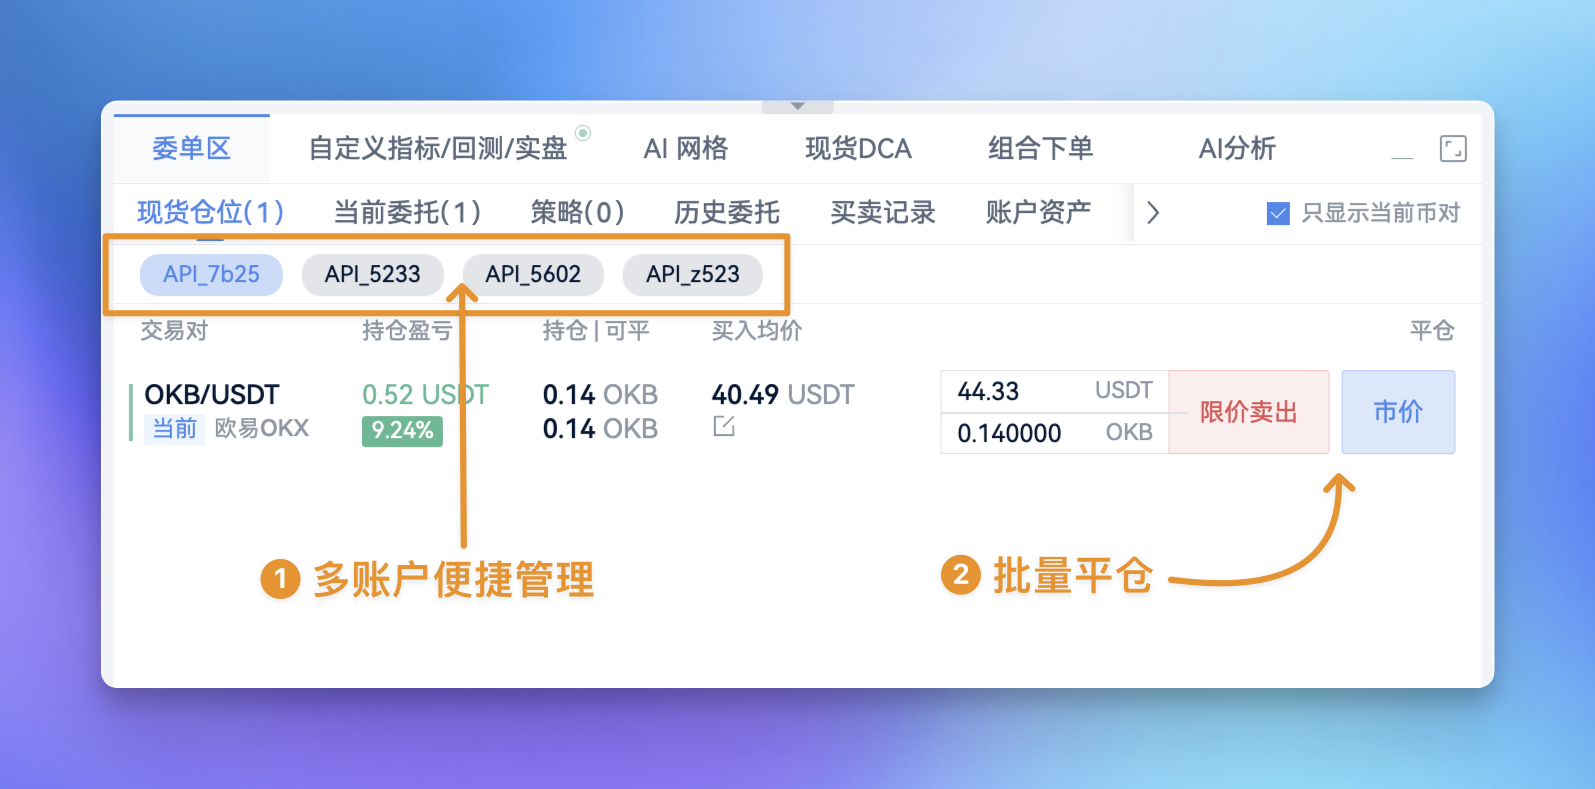
AiCoin's multi-account ordering allows users to select multiple API accounts within a single ordering process and organize orders according to pre-set account ratios. Its advantage lies in centralized management, reducing repetitive switching and input, and helping multiple accounts to collaborate under the same plan.
The follow-through mode is suitable for initially setting a basic order quantity, and then having other accounts follow according to their respective ratios or multiples. If different accounts need to implement the same strategy but have different planned sizes, proportion ratios can be set in advance to reduce the need for recalculation account by account.
The allocation mode is suitable for first determining the total delegated amount across multiple accounts and then allocating according to predefined proportions. It is applicable in scenarios where traders prefer to control the overall amount before planning each account's share. In short, the follow-through focuses on how accounts follow input quantities; allocation emphasizes how the total amount is split.
Operational Steps: First Set the Plan, Then Choose Account and Mode
1. On the AiCoin ordering panel, enable "multi-account ordering."
2. Check the API accounts involved in this plan and verify the exchange, account identity, and authorization status.
3. Choose the follow-through or allocation mode according to the strategy and set the ratios or multiples for each account; the balances, existing positions, and risk limits of different accounts need to be verified separately.
4. Confirm the ETH/USDT trading pair, direction, order type, and delegated quantity. Only execute synchronous orders when one’s own strategy conditions are met; do not take a strong bullish candlestick or a single indicator as an automatic signal.
5. After submission, check the order status, filled quantities, and position changes for each account. If necessary, adjust orders, cancel orders, or manage positions based on actual transactions.
If the trader's strategy is to participate in batches and different accounts follow the same set of conditions proportionally, the follow-through mode can be used; if the total delegated amount across multiple accounts has been determined, the allocation mode can be used. The multi-account tool enhances operational efficiency and execution consistency but does not determine whether ETH has reversed nor eliminate the possibility of multi-account simultaneous directional risk.
Conclusion: Counterattack Signal Appears, Confirmation Signal is Still on the Way
The current rapid rise in ETH's price, the recovery of short-term moving averages, and the positive shift in MACD do constitute a set of short-term bullish clues worth noting. However, from the larger structure of having retreated all the way from the stage high of about 2,806 USD to a low of about 2,172.85 USD, a trend reversal still requires the price to break through the previous high and confirm through pullbacks.
If ETH can break through the recent high near 2,434 USD and continue to recover the previous trading area around 2,500—2,560 USD, while the moving averages and MACD simultaneously maintain improvements, the logic of the counterattack will be more solid; if the breakout fails and falls back below the repair area, caution is needed that this is just a sharp bounce in a downtrend.
For multi-account traders, first verify the strategy with price structure, and then use AiCoin's multi-account ordering to execute based on follow-through or allocation plans, is a way to connect market analysis with tool usage. Market signals propose hypotheses, subsequent prices verify them, and tools clarify execution.
AiCoin exclusive "Multi-Account Ordering" super tool
One-click synchronization for multiple accounts to place orders, achieving multi-operation in seconds with AiCoin; it also supports placing orders across multiple accounts:
https://www.aicoin.com/zh-Hans/tg/multi-account

免责声明:本文章仅代表作者个人观点,不代表本平台的立场和观点。本文章仅供信息分享,不构成对任何人的任何投资建议。用户与作者之间的任何争议,与本平台无关。如网页中刊载的文章或图片涉及侵权,请提供相关的权利证明和身份证明发送邮件到support@aicoin.com,本平台相关工作人员将会进行核查。