Crypto Circle Academician: The needle that pierced through all bullish beliefs at 11.6 Ethereum (ETH) in the early morning, will either skyrocket or drop another 200 dollars.
Ethereum plummeted from 2420 to 2235 in one go, closing at 2263, down 6.6%. I received dozens of messages in the backend; some asked whether to cut losses, some asked if it was possible to buy the dip, and others said they had lost their year-end bonus again. After such a sharp decline, two operations are the most taboo: one is to impulsively buy the dip with all funds, and the other is to be scared and cut losses at the lowest point. What I can do is to present the charts daily, write the numbers clearly, and the rest is up to you. Write down in advance where I will buy if it drops, where I will short if it bounces, and where I will run if I’m wrong.
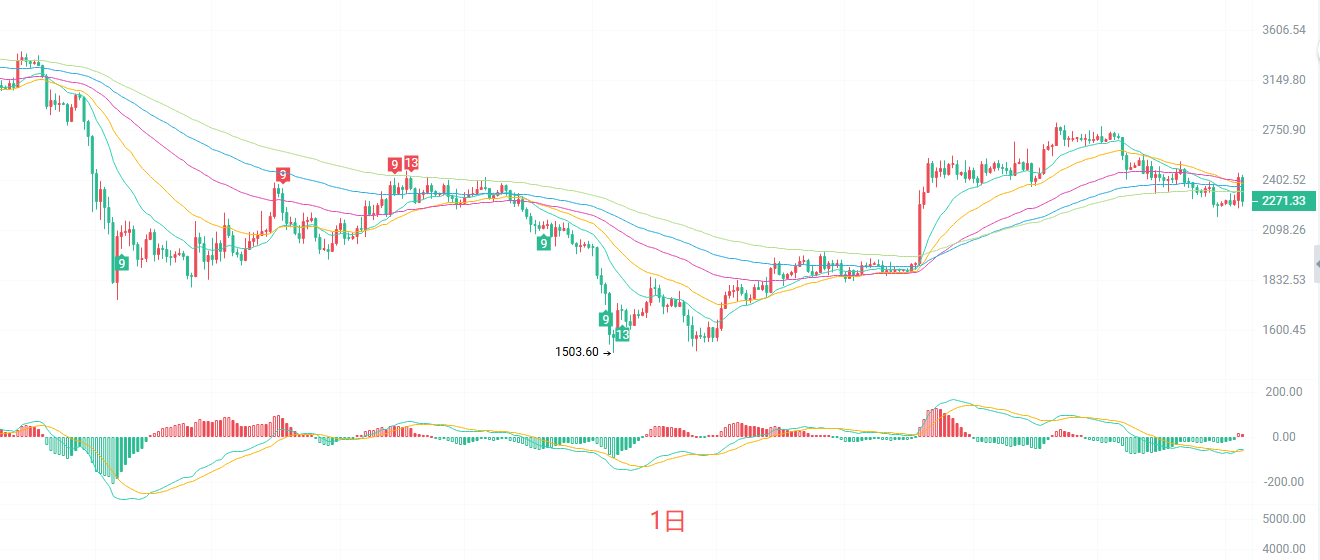
The daily K-line directly broke through the previous few days’ sideways range of 2350-2400, representing a typical breakdown. In the moving average system, the current price of 2263 has broken through the EMA15, 30, 60, and 90, with only the EMA120 at 2329 still close above, indicating that the short-term trend at the daily level has weakened. The price has slid from the upper middle track to the middle-lower track, with the bandwidth starting to widen. The MACD is showing a weak golden cross below zero, but this is a repair that occurred due to the fall, not a signal for a rising start. The TD structure has just shown 1, and the downtrend hasn’t stopped yet.
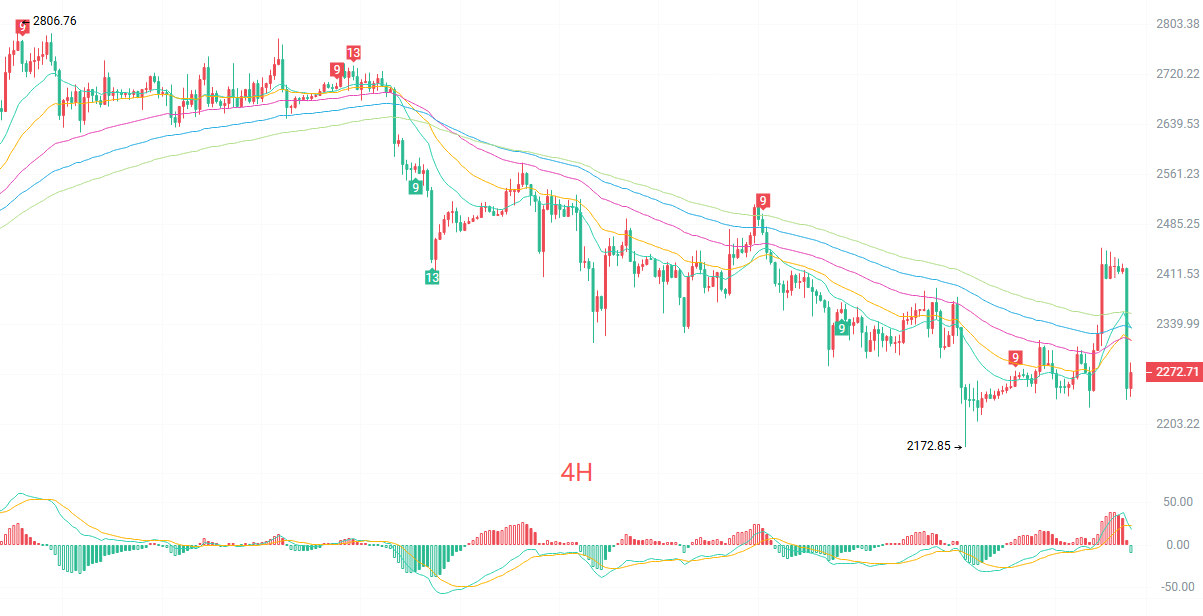
The current four-hour K-line closed at 2263, representing a weak rebound after a big fall. The problem is that the rebound strength is very weak: the upper EMA15 at 2333, EMA30 at 2317, EMA60 at 2317, EMA90 at 2335, and EMA120 at 2355, with five moving averages densely stacked between 2317 and 2355 forming a wall, and the current price is still 50 to 90 dollars away from this wall. The middle track of the Bollinger Bands at 2316 is right on top of the group of moving averages, with the lower track at 2175. The DIF of MACD has crossed below the DEA, indicating that the rebound could end at any time. The TD count is at 2, still counting down in the short term. In simple terms: it’s just a breath after an oversold condition, not a reversal.
Short-term reference:
Going north, there is resistance at 2220 to 2190, stop loss at 30 points, goal at 2300 to 2350.
Going south, stagnation at 2320 to 2350, stop loss at 30 points, goal at 2270 to 2230.
Specific operations are based on real-time market data. For more details, you can consult me. The publication of this article has delays, and it is advisable to use it for reference only, at your own risk.
Warm reminder: The above content is updated simultaneously by the Crypto Circle Academician on major trading platforms like Binance, OKEx, Huobi, etc. For more content, you can add me as a friend in Binance OKEx and join my fan group.
免责声明:本文章仅代表作者个人观点,不代表本平台的立场和观点。本文章仅供信息分享,不构成对任何人的任何投资建议。用户与作者之间的任何争议,与本平台无关。如网页中刊载的文章或图片涉及侵权,请提供相关的权利证明和身份证明发送邮件到support@aicoin.com,本平台相关工作人员将会进行核查。