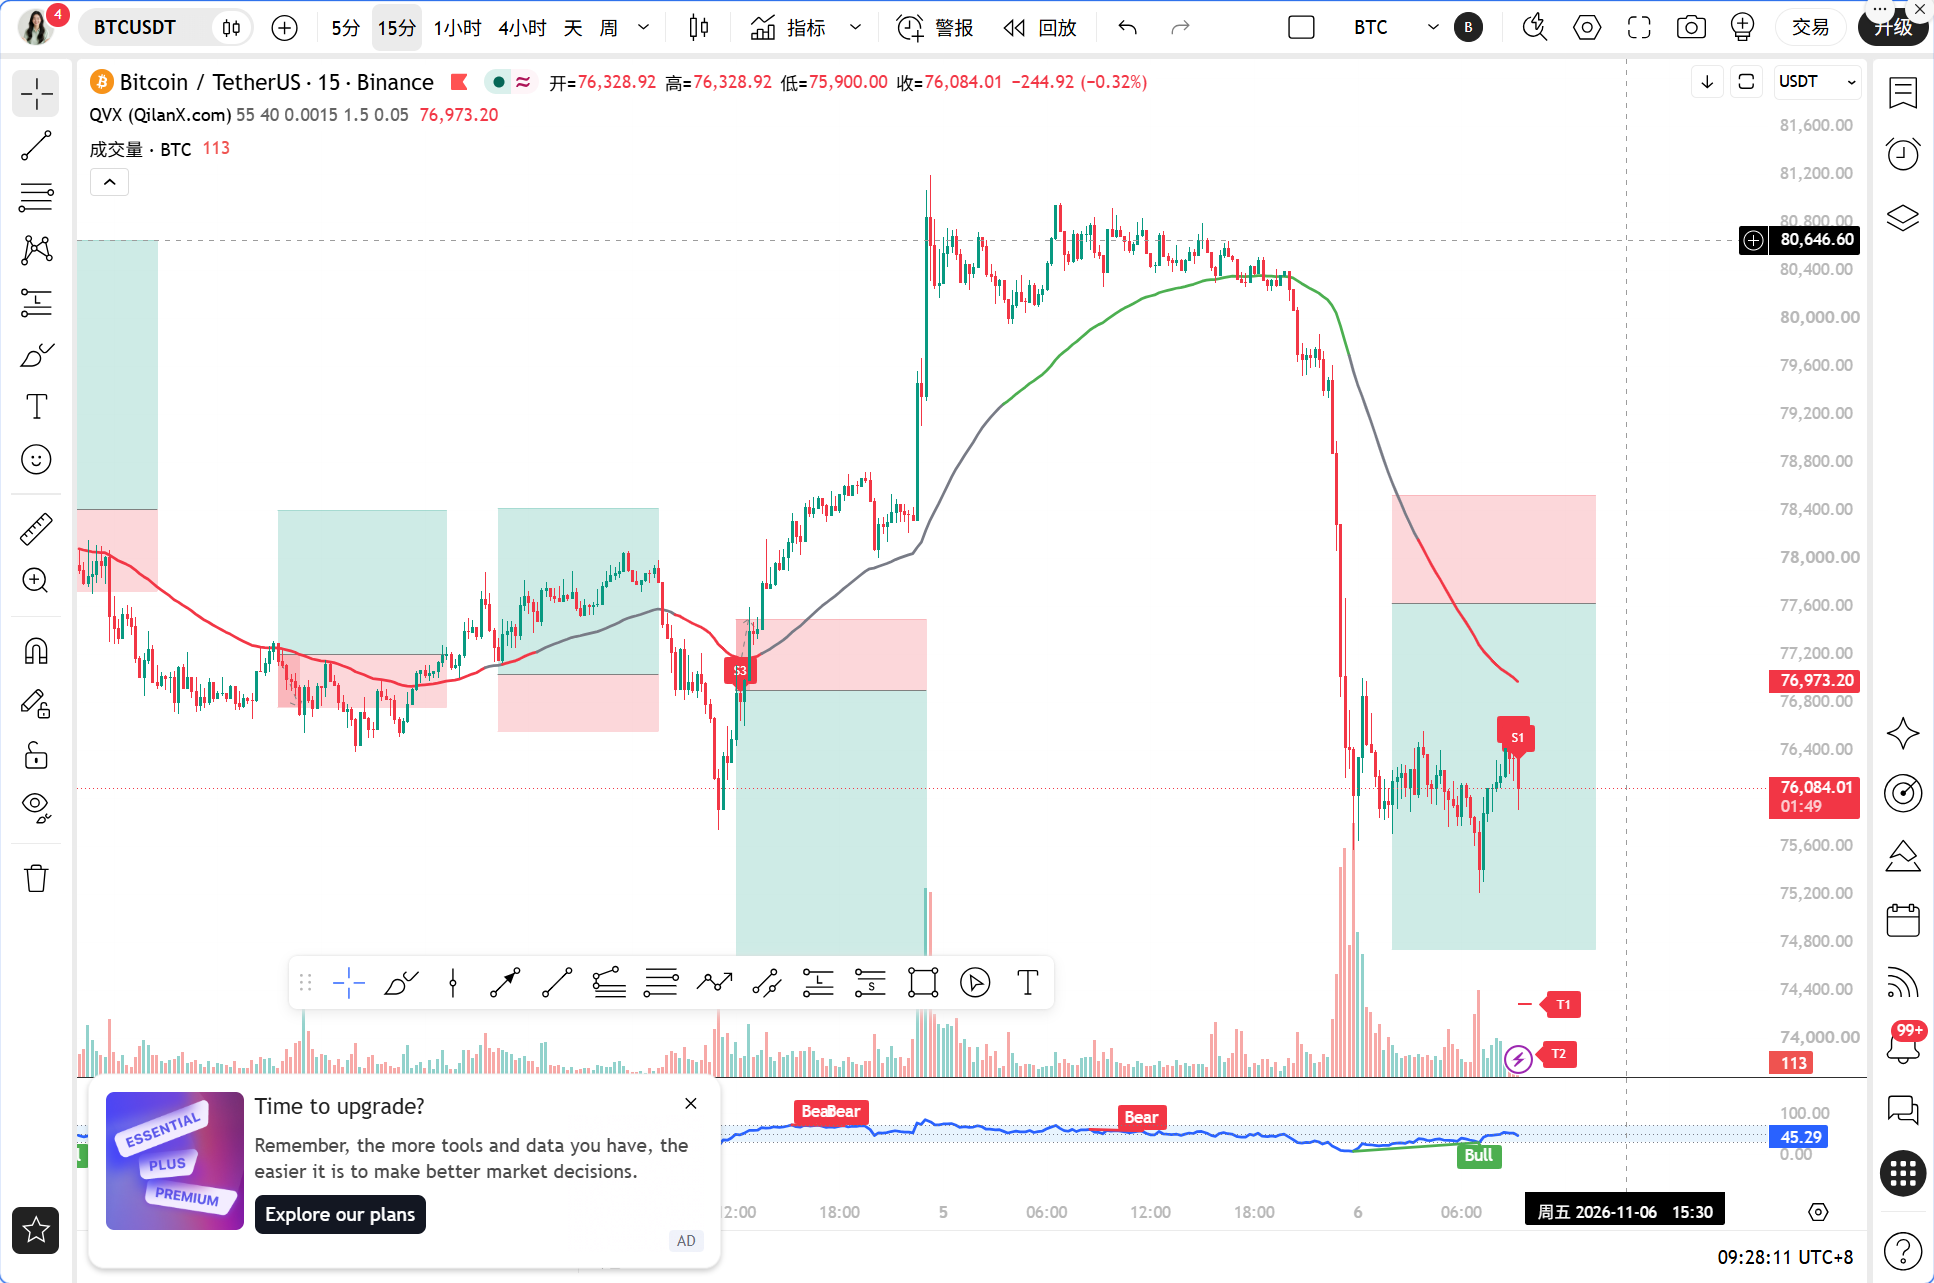
The overnight market taught everyone a lesson. The direct triggers for the cryptocurrency market's massive volatility are twofold: first, the epic sell-off in the U.S. stock market, with the Nasdaq experiencing its largest single-day decline since 2020, driven by fears of AI regulation and the double impact of leveraged sell-offs; second, the shelving of the CLARITY Act has increased regulatory uncertainty. The combination of these two events led to a decline in risk assets, with BTC dropping 5.6% in 24 hours and ETH falling 7.69%. More brutally, in the leverage sector, liquidations across the network exceeded 1 billion USD, with long positions losing as much as 810 million, and the chain reaction of deleveraging pressure is still being released. At the same time, Brazil's Mercado Bitcoin was hacked for 48.6 million USD, Chainalysis suffered a hacker attack causing several exchanges to suspend withdrawals, and the Federal Reserve and OCC conducted an emergency assessment of the 6.34 billion USD attack on Binance. Frequent security incidents have further weakened market confidence. This is not a single negative factor but a simultaneous tightening of policies, macro conditions, leverage, and security across four lines. Sister Qinglan reminds everyone that in such an environment, any bottom-fishing actions must first pass through the system and then observe the position.
Current price and time
The current time is November 06, 09:29, and the BTC price is 76028 USDT. The 24-hour drop is 5.6%, the Fear and Greed Index is 28, indicating a state of fear. The market share is 59.24%, and there is no significant flow of funds into altcoins, indicating that this is a market-wide risk aversion, not a rotation among sectors.
Multi-cycle status overview
Daily level: MA5=77377.98, MA10=77953.01, MA30=80620.64, the price of 76028 has broken below all three moving averages, forming a preliminary bearish arrangement. MACD DIF=-1381.92, DEA=-1074.66, histogram=-307.26, DIF is below the zero axis and lower than DEA, indicating the bearish momentum is still expanding. Daily RSI=34.72, close to oversold but not yet in the extreme zone below 30, indicating there is still room for decline; overall, the daily chart shows a clear bearish structure.
4-hour level: MA5=76980.81, MA10=78660.40, MA30=77983.84, the price is also below the three moving averages, with MA5 crossing below MA10 and MA30. MACD DIF=-278.90, DEA=54.10, histogram=-333.00, DIF has fallen below the zero axis, and the histogram is deeply negative, suggesting strong bearish momentum on the 4-hour chart. RSI=42.81, in a neutral but weak area with no signs of being oversold, meaning there is still no build-up of rebound momentum at this level.
1-hour level: MA5=76004.43, MA10=76105.64, MA30=78739.01, the price of 76028 is slightly above MA5 but far below MA30. MACD DIF=-981.20, DEA=-807.66, histogram=-173.54, still negative but needs to observe whether the histogram begins to shorten. RSI=19.45, already deeply oversold, this is the only clear rebound clue currently. EMA55=78107.55, the price still has 2.66% of space from this line.
15-minute level: MA5=76257.93, MA10=76088.31, MA30=76091.57, the price is below MA5 but close to MA10 and MA30, and the short-term moving averages are beginning to entangle. MACD DIF=-118.92, DEA=-218.83, histogram=99.90, the histogram has turned positive, while DIF is below the zero axis but approaching DEA, indicating a bottom divergence-style momentum recovery in 15 minutes. RSI=53.66, returning to a neutral area, short-term signs of stabilization are appearing.
TPV signal verification
First, let’s look at trend positioning. The current price is 76028, and the 1-hour EMA55=78107.55, clearly placing the price below EMA55, belonging to a bearish trend zone. In the past 8 1-hour candlesticks, the closing price above EMA55 has occurred 0/8 times, with no crossovers, and the absolute amplitude between the price and EMA55 is 2.66%, far exceeding the 0.3% volatility threshold. The TPV system determines: currently not meeting the conditions for volatility, in a one-sided bearish trend. This is very critical, meaning the system does not allow for proactive buying, only waiting for short conditions or trend reversals.
Checking the shorting conditions one by one. First, the price is under pressure below the 1-hour EMA55 and two consecutive 1-hour candlesticks have closed below EMA55, this condition is fully met. The 0/8 closing ratio is the hardest evidence. Second, the pressure and resistance pattern, the MA30=78739.01 at the 1-hour level constitutes distant resistance, while EMA55=78107.55 constitutes near resistance; the price has not produced valid head-and-shoulders or long upper shadows in the process of retreating from high levels, as it is currently a continuation of decline rather than a resistance meeting rebound. This condition is partially met. Third, weakness in rebounds, the MACD histogram=-173.54 is still negative, but requires observation if there is a shortening trend in two consecutive cycles; the RSI=19.45 has shown signs of low recovery but is not yet evident, and no bullish engulfing pattern has appeared; this condition has not yet fully been met. Overall, the directional conditions for shorting are established, but the entry trigger conditions still need to wait for confirmation signals of resistance met in rebounds, as the risk of chasing shorts lies in the technical pullback after deep oversold RSI.
Checking the long conditions one by one. First, the price needs to stabilize above the 1-hour EMA55 with two consecutive closing prices above 78107.55; currently, at 76028, it is 2079 USDT, about 2.66% away from this line, clearly not satisfied. Second, the support stabilization pattern, the current price near 76000, with 75000 marked as a dense area for long positions on the liquidation map, but no long lower shadows, bottom patterns, or confirmation signals for volume stagnation have yet appeared. Third, depleting downward momentum, the MACD histogram at the 1-hour level is still -173.54 with no signs of shortening in two consecutive cycles; though RSI is deeply oversold at 19.45, it has yet to form an upward rebound signal from below 30, nor has a bullish engulfing pattern been observed. The conclusion is clear: the TPV system currently does not provide a buy signal, any bottom-fishing would be against the system operations.
On-chain / Funding
Fear and Greed Index is 28, within the fear zone; historically at this level, there is often one final drop, emotional bottom does not equal price bottom. 1 billion USD in liquidations in 24 hours, with long positions at 810 million, indicates that leveraged longs have been massively washed out, and short-term selling pressure has been released, but the aftermath of chain deleveraging remains. The liquidation map shows that shorts above 80,000 have a liquidation intensity of 1.45 billion, while falling below 75,000 indicates a long liquidation intensity of 550 million, meaning a breakout above 80,000 will trigger a short squeeze, whereas dropping below 75,000 will spark a new round of long liquidations; both directions have liquidity amplifiers. Trump Media-related wallets transferred 4259 BTC to Crypto.com, worth 329 million USD; this large transfer into exchanges needs continuous tracking, as any subsequent selling could increase downward pressure. The market share of 59.24% indicates funds are contracting towards BTC as a safe haven, but BTC itself is also declining, which is a typical cash-is-king phase.
Key attack and defense levels
The first pressure level above is 78107.55, namely the 1-hour EMA55, which serves as the demarcation line for the TPV system between bulls and bears; if the price cannot stay above it, the bearish trend is not considered over. The second pressure level above is 78739.01, namely the 1-hour MA30, which forms a pressure zone with EMA55. The first support level below is 75000, the lower edge of the dense area for long positions marked on the liquidation map; dropping below it will trigger liquidation of 550 million long positions. The second support level below is in the range of 74000 to 74500, which is the dense zone of previous daily lows. 80,000 is the key level where the short liquidation intensity is 1.45 billion; a significant breakout here may drive a rapid surge, but until EMA55 is climbed above, such a surge can only be defined as a rebound, not a reversal.
Trading thoughts
Direction: bearish trend, primarily short with secondary rebounds, do not go long. The TPV system clearly states that the price is below the 1-hour EMA55 with a 0/8 closing ratio, indicating a one-sided bearish layout; going long against this trend is a disciplinary error.
Entry conditions: do not chase short positions. Wait for the price to rebound to the range of 77500 to 78100, which is close to the 1-hour EMA55 but cannot stabilize; look for a long upper shadow, head-and-shoulders, or bearish engulfing pattern on the 1-hour level, along with a MACD histogram that shortens for two consecutive cycles, and the RSI should show a low recovery before turning down again; entry for shorting can only occur when these three resonate. If the price directly breaks below 75000 with volume, one can wait for a pullback to 75000 to enter with a light position, but the size should be halved.
Stop-loss: set the stop-loss for shorts above 78500, which is above the pressure zone of the 1-hour EMA55 and MA30, allowing sufficient space for false breakouts, with a stop-loss range of about 400 to 500 USDT.
Target levels: the first target is 75000, the second target is in the range of 74000 to 74500. If it breaks below 75000 with volume, one can hold until near 74000 for phased profit-taking. The profit-loss ratio, calculated with an entry at 77500, stop-loss at 78500, and first target at 75000, is about 2.5 to 1, which meets system requirements.
Risk warning: the combination of deeply oversold RSI and the 1.45 billion short liquidation intensity above 80,000 means any unexpected positive news or short covering could trigger a strong pullback; strictly observe stop-loss rules and do not hold positions.
Follow Qinglan's cryptocurrency classroom to seize more trading opportunities! Welcome to visit the official website www.qinglan.org
📊 Qinglan TPV trading strategy backtesting reference
🕒 Last backtesting time 11-06 07:00:02
Total analysis: 4916 Backtests: 4907 Accuracy: 76.3% (3742/4907)
免责声明:本文章仅代表作者个人观点,不代表本平台的立场和观点。本文章仅供信息分享,不构成对任何人的任何投资建议。用户与作者之间的任何争议,与本平台无关。如网页中刊载的文章或图片涉及侵权,请提供相关的权利证明和身份证明发送邮件到support@aicoin.com,本平台相关工作人员将会进行核查。