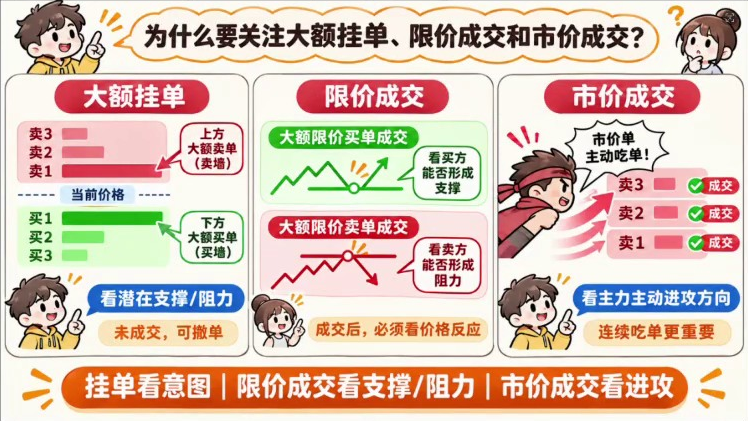
When a large sell order appears on the order book, I usually wait a bit longer. It might get eaten away little by little by the buy orders, or it might suddenly be withdrawn when the price gets close. What I am more concerned about is where the price will go after the transaction. Today, I will take a look at a few historical market conditions and analyze this matter.
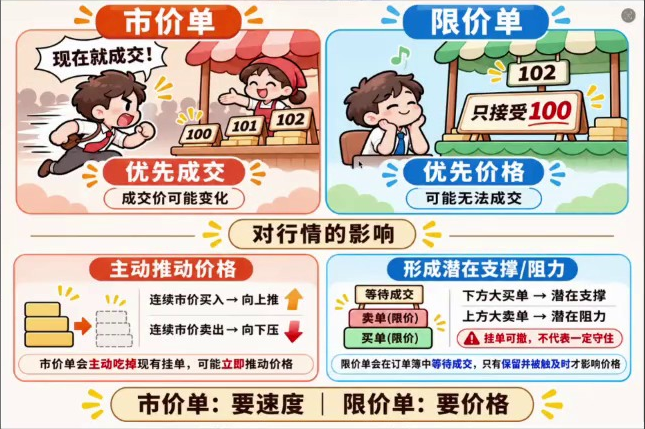
Market orders actively consume the quotes on the opposite side. When the order book is shallow, a large order can sweep through several levels, and the actual execution price is likely to be worse than expected, sometimes leaving a long wick on the chart. Limit orders can establish the price beforehand. For example, if the price is around 0.32, and I only want to buy at 0.28, I place the order at 0.28 and wait. Whether it gets executed still depends on the market situation and queue status. Sell orders above act as potential resistance, while buy orders below act as potential support.
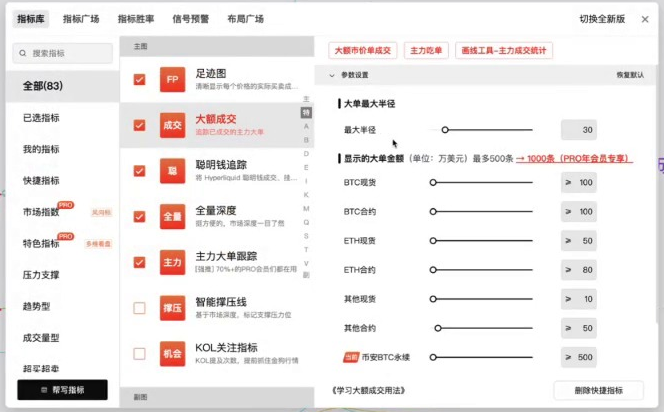
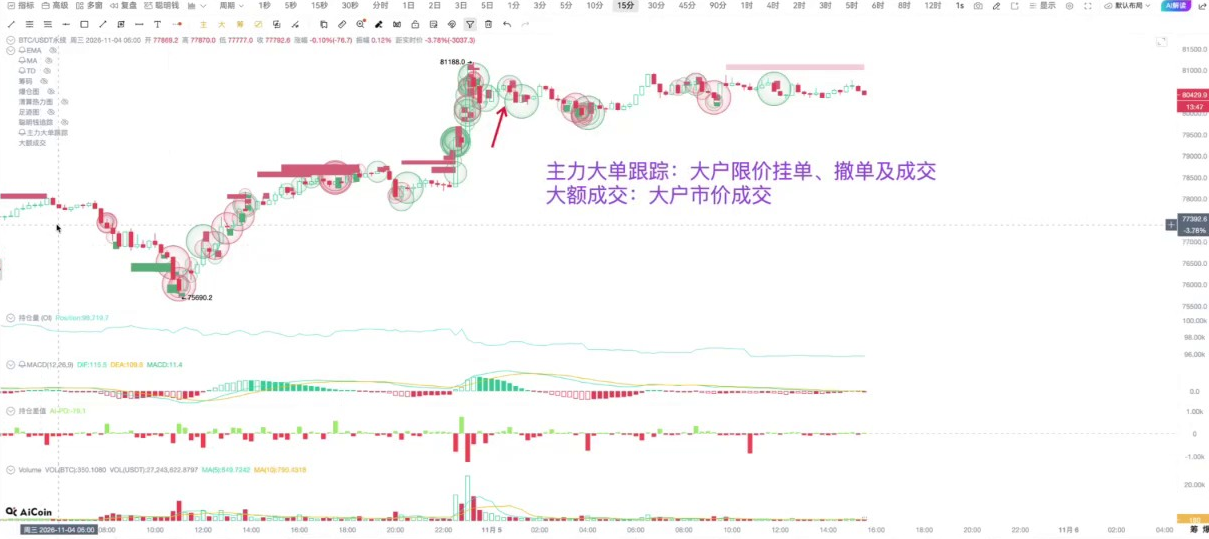
When looking at candlestick charts, I will open "Large Order Tracking" and "Large Transactions" simultaneously. Red and green rectangles highlight large limit sell and buy orders; clicking on them allows me to see the price, amount, how long they have been hanging, and whether they were executed or withdrawn later. Circles mark large market transactions, showing execution amount, slippage, and distribution of opposite orders. Putting these two indicators together helps clarify who is waiting for the price and who is taking action.
There are many orders in the order book that are quickly withdrawn after being placed, flashing back and forth on both sides. These types of orders might come from market-making behavior. I usually first filter them by amount and how long they have been posted, then check the order history. The amount threshold also needs to match the asset type. The same amount of money in BTC and a thinly traded small coin would have a significant difference in weight.
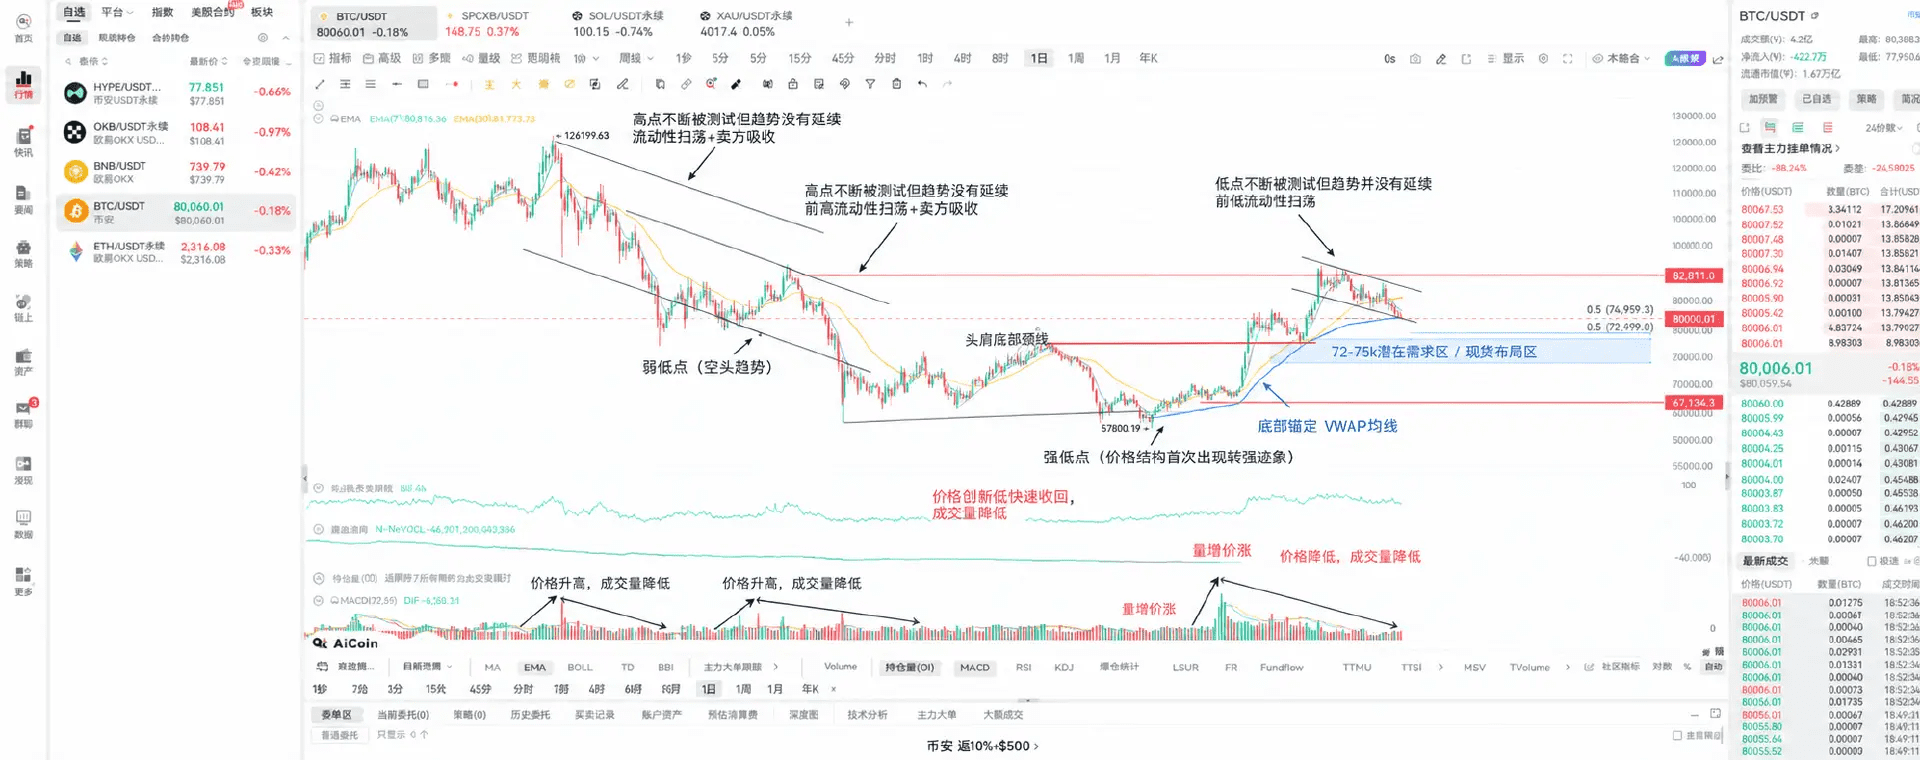
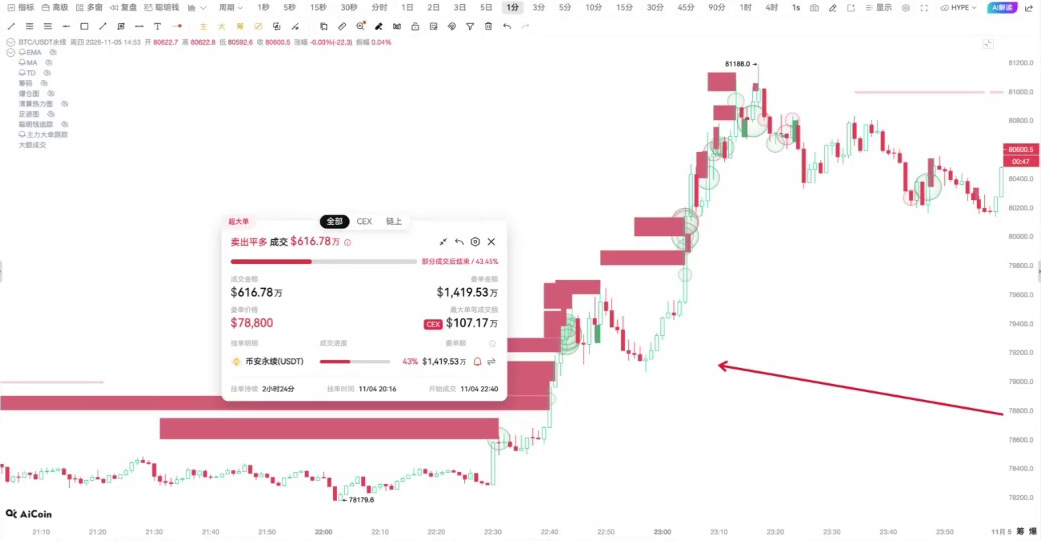
Take the $78,800 BTC chart for example; the popup shows that the sell order was initially about $14,195,300, but the actual execution was around $6,167,800, ending after partial execution. When the market approaches, I will check how much of this order is left, whether there are any following buy orders, and whether the price can hold. Another historical case around $81,100 had the previous high and large sell orders overlapping. Hitting that level was just the first step; the next is to see if the buying pressure can absorb the selling pressure and whether it can stay above when closing.
When gold returned to the 3,905 area, the buy orders at the bottom absorbed the selling pressure. Later, sell orders appeared above in succession, and the active buy orders kept coming, preventing the price from being pushed down again. During such times, I keep an eye on the closing and pullback. In the opposite direction, if a large buy order gets executed but fails to rebound past the transaction zone, that support area needs to be reassessed. If I already have positions, I can mark the large order zones on the opposite side that keep appearing and observe when the market approaches the vicinity.
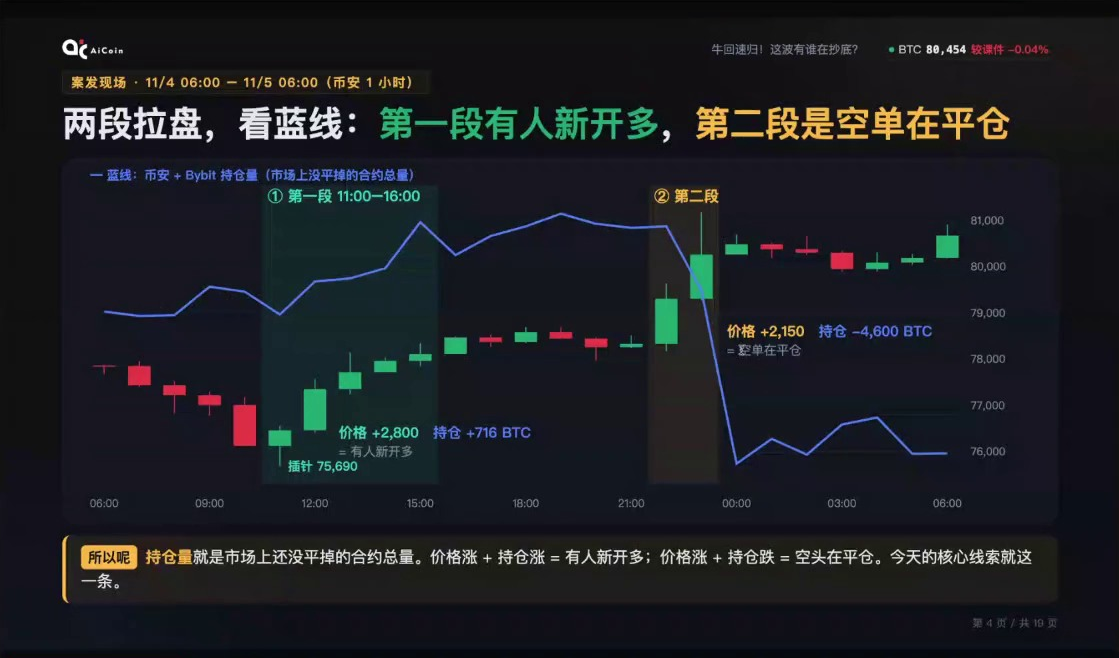
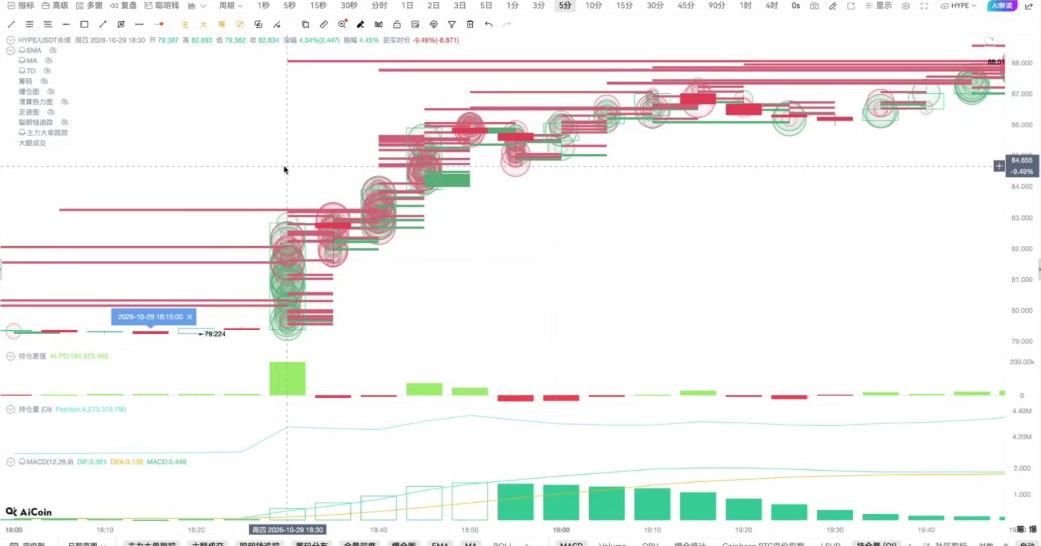
Looking at the HYPE from October 29. That period saw continuous active buying, and the open interest also increased, followed by large buy orders after a brief consolidation. Comparing this to a quick recovery spike on Binance BTC makes it easy to see the difference. At that time, BTC had an active sell, but the open interest was declining, suggesting positions were exiting. Open interest only tells me how much the number of open contracts has increased or decreased; I need to look at the direction and sustainability of active transactions separately.
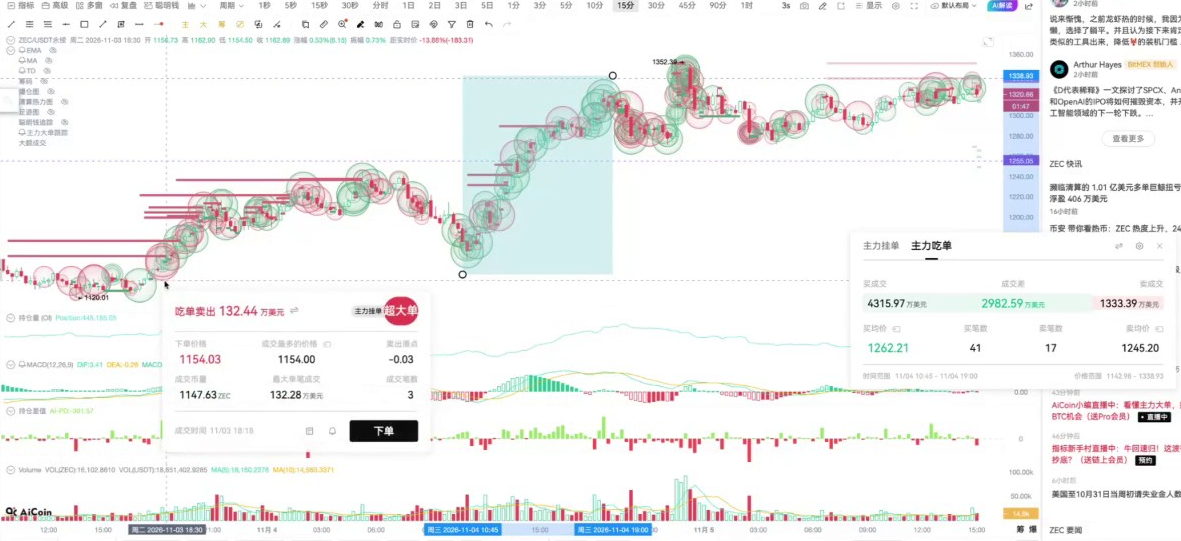
The ZEC chart is also suitable for putting three signals together. From 10:45 to 19:00 on November 4, the total active transactions filtered in the chart amounted to $43,159,700, including active buying of $29,825,900 across 41 transactions and active selling of $13,333,900 across 17 transactions. During that period of accelerated prices, the open interest also increased. Compared to just seeing one large bullish candlestick, these several data points can provide a clearer view of which transactions were advancing during that market condition.
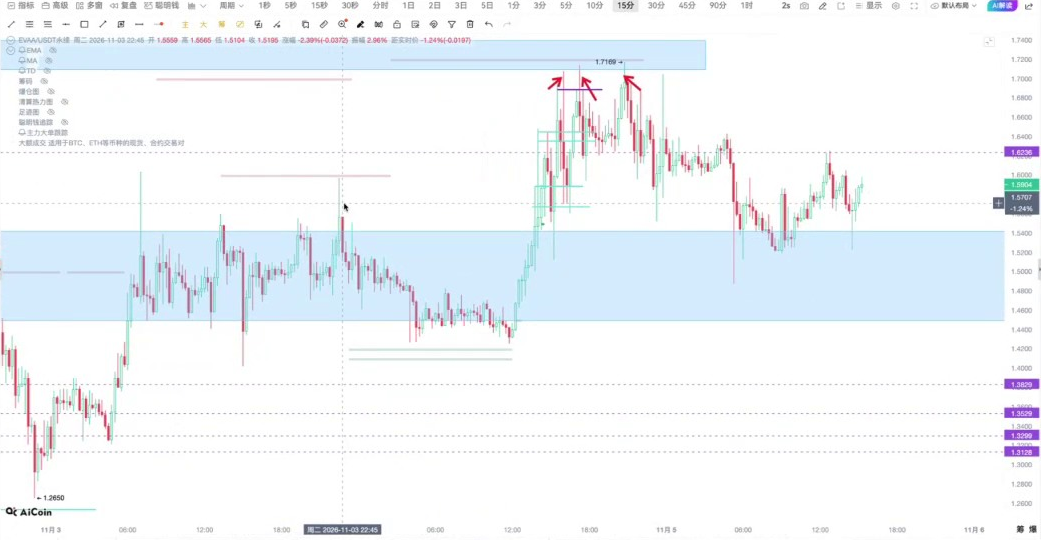
For thin order books of small coins, I pay more attention to where the orders are placed and how long they can hang. AIN can focus on sell orders near the previous high and observe pullbacks after closing above. There was an instance with EVAA when sell orders were placed above at around 1.60, and the price turned back after touching 1.597; later, this area also repeatedly spiked and retraced. The estimated liquidation zone near 1.71 can also be marked together, and then I can see if there are any real orders nearby. The short-term case of IRYS follows the same thinking: after the buy orders are executed, can it hold during the pullback? This is more useful than merely looking at open interest and price divergence.
Returning to BTC, I usually first mark the price levels where there are dense orders with long bars, then, as the price approaches, I check with circles whether active transactions are following. Next, I focus on three details: how much of the orders have been executed, whether the opposite buy and sell orders are still there, and whether the closing and pullback can hold. For highly liquid assets like BTC, ETH, ZEC, the two indicators can be considered together. For assets with thin order books, I will place more emphasis on orders that last longer and have associated transactions later.
Currently, there are live broadcasts every day; feel free to keep following AiCoin friends! Reserve in advance 👇
https://www.aicoin.com/zh-Hans/live/list?tab=upcoming
Join our community, let's discuss and grow stronger together!
Official Telegram community: https://t.me/aicoin_support
AiCoin Chinese Twitter: https://x.com/AiCoinzh
Hype rebate: https://app.hyperliquid.xyz/join/AICOIN88
Binance rebate: https://jump.do/zh-Hans/xlink-proxy?id=3 invitation code: aicoin668
Coinbase rebate: https://jump.do/xlink?checkProxy=true&proxyId=25 invitation code: Y8L23JL
免责声明:本文章仅代表作者个人观点,不代表本平台的立场和观点。本文章仅供信息分享,不构成对任何人的任何投资建议。用户与作者之间的任何争议,与本平台无关。如网页中刊载的文章或图片涉及侵权,请提供相关的权利证明和身份证明发送邮件到support@aicoin.com,本平台相关工作人员将会进行核查。