When income diverges from market value, L1 is becoming a monetary asset in the battle for existing capital.
Written by: Marc Arjoon
Translated by: Saoirse, Foresight News
No matter which time cycle traders focus on, the price trend of L1 tokens is dominated by the Bitcoin beta coefficient. This article conducts regression analysis on the monthly logarithmic price fluctuations of each L1 market capitalization using Bitcoin as the explanatory variable and introduces four on-chain indicators: native token revenue, active addresses, DEX trading volume, and stablecoin supply.
(Note: The Bitcoin beta coefficient refers to the average change in the price fluctuation of L1 tokens corresponding to a 1% change in Bitcoin's price, while controlling other on-chain variables.)
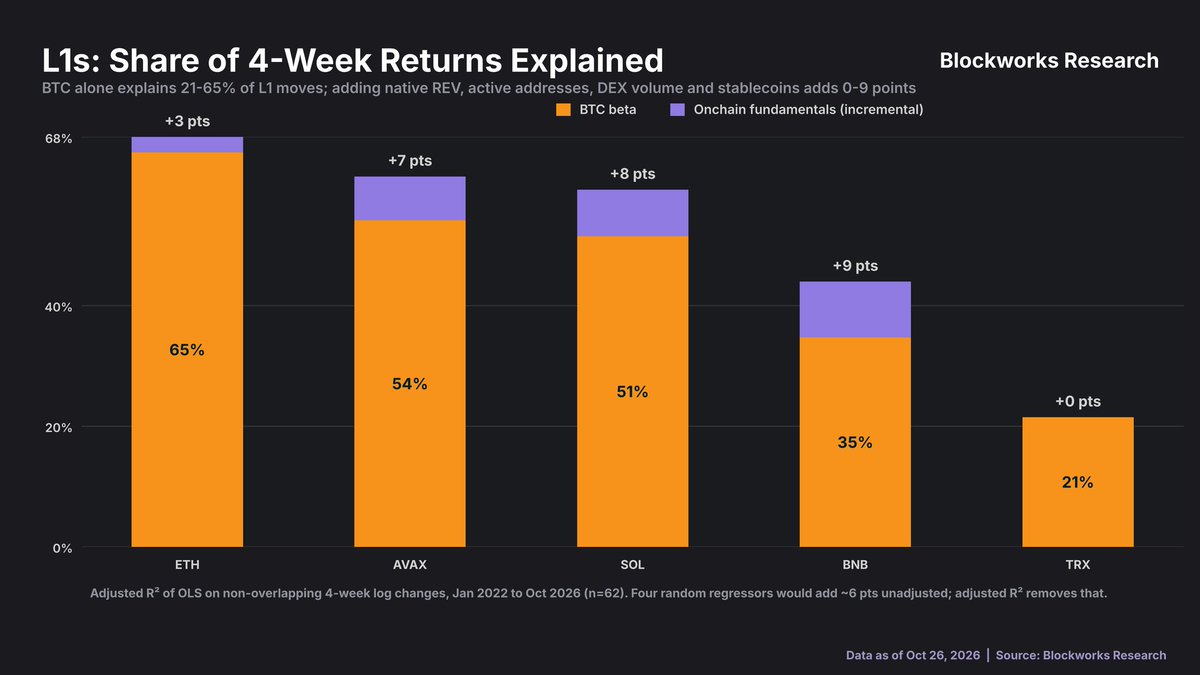
The Bitcoin beta itself can explain 21%–65% of the four-week return fluctuations for several L1 public chains like ETH, AVAX, SOL, BNB, and TRX, while on-chain fundamental factors such as new protocol revenue and active addresses contribute only an additional 0–9 percentage points of explanatory power.
The following will unfold detailed analyses. Dollar-denominated indicators tend to embellish fundamentals: Fees are settled in native tokens, and as tokens rise, the dollar value of the fees correspondingly increases; while TVL is largely just the market valuation of native tokens.
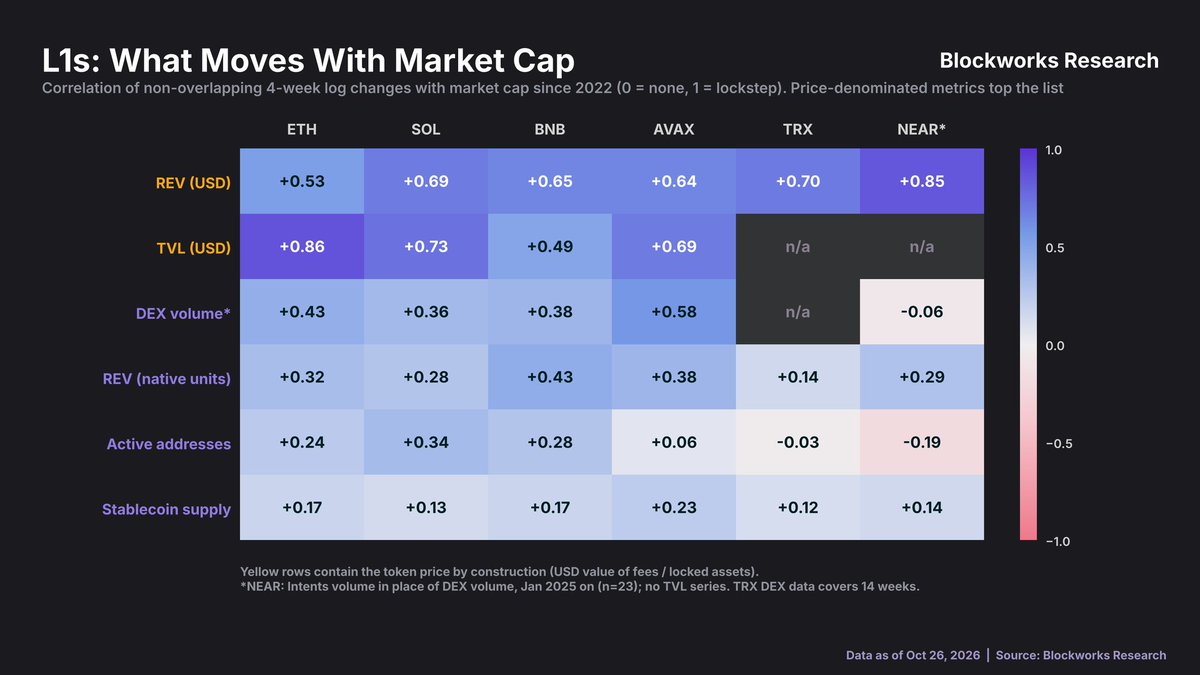
Since 2022, the correlation between the four-week logarithmic price fluctuations of various L1 public chains and market capitalization shows that the dollar-denominated protocol revenue, TVL, and market capitalization have the strongest correlation, while indicators like native token revenue, active addresses, and stablecoin supply have significantly lower correlation with market capitalization.
Ethereum best illustrates the disconnect between protocol revenue and value. During the week of the Dencun upgrade, Ethereum's rolling protocol revenue over the past 12 months was $3.3 billion; by August 2025, that revenue had fallen to $1.3 billion, a decrease of 60%, but the market capitalization trend was completely the opposite, climbing from $460 billion to $540 billion. This is the result of protocol design, not a collapse in market demand: the Blob fee mechanism and gas limit adjustments were intended to lower the unit price of L1 block space. The core driving force behind this round of increases in 2025 comes from the demand for spot ETFs and treasury funds from listed companies, which will be explained further below.
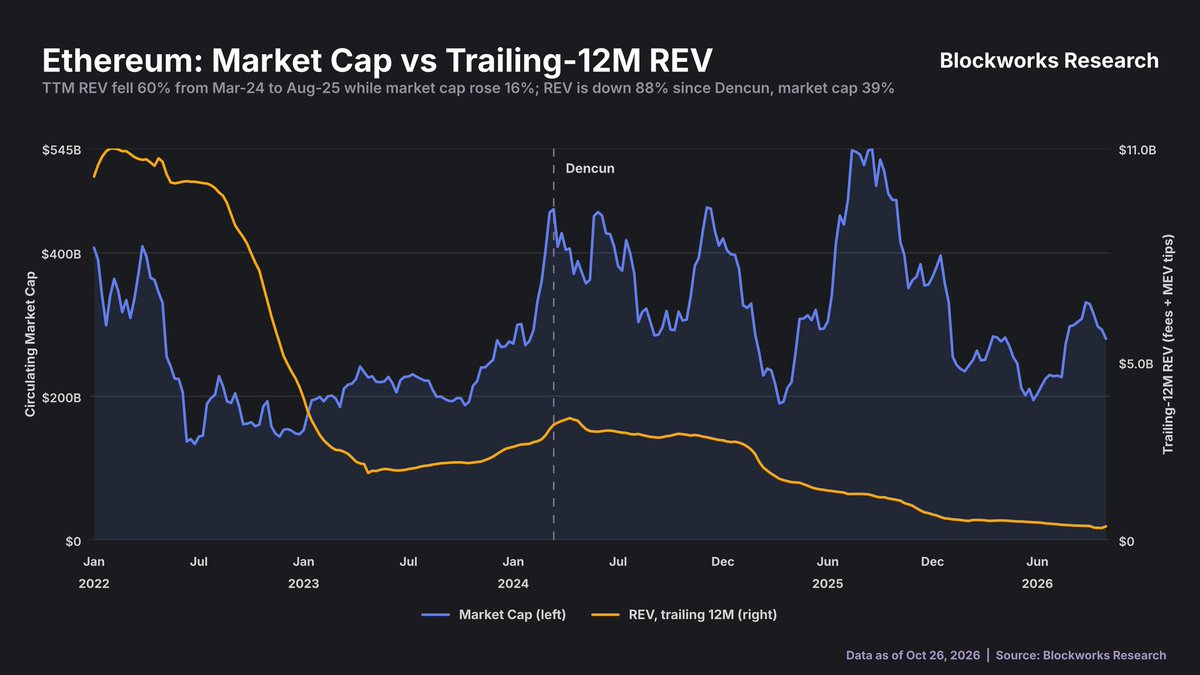
The market capitalization of Ethereum significantly diverges from its rolling protocol revenue trend over the past 12 months: from March 2024 to August 2025, TTM revenue declined by 60%, while market capitalization increased by 16%; since the Dencun upgrade, revenue has cumulatively dropped by 88%, but market capitalization has only fallen by 39%.
Solana is a typical case of synchronized changes in income and market capitalization. Since January 2023, its rolling protocol revenue and market capitalization both grew approximately 15 times and peaked in the same week, reaching $2.5 billion and $130 billion, respectively; thereafter, both indicators retreated to $400 million and $58 billion.
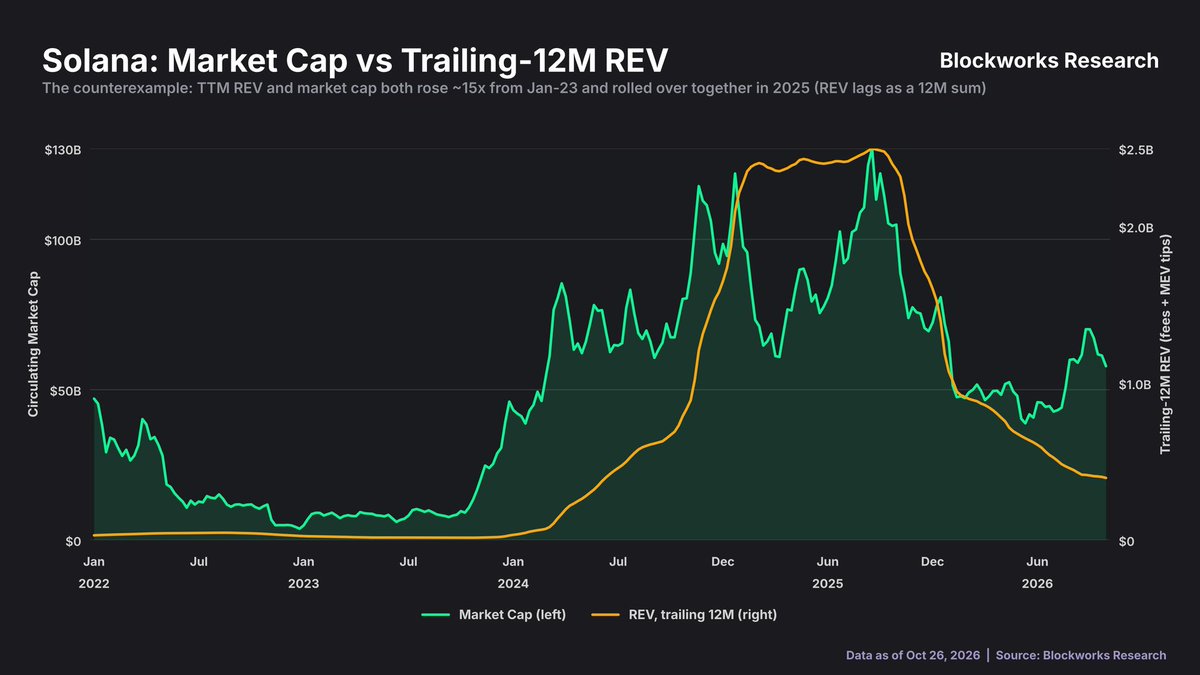
Solana stands in contrast to Ethereum: since January 2023, its rolling 12-month protocol revenue and market capitalization have both risen about 15 times and peaked together in 2025 (revenue is calculated as a 12-month rolling sum, with a slight time lag).
This article then examines active addresses and DEX trading volume. Over an extended period, active addresses and market capitalization generally change in the same direction, and this feature is particularly notable for Solana and TRON; however, at the weekly level, their correlation noticeably weakens, often showing significant divergence. Since January 2022, Ethereum's active addresses have grown by 26%, while its market capitalization has fallen by 34%; Solana's active addresses increased 17 times, yet its market capitalization has only risen 17%.
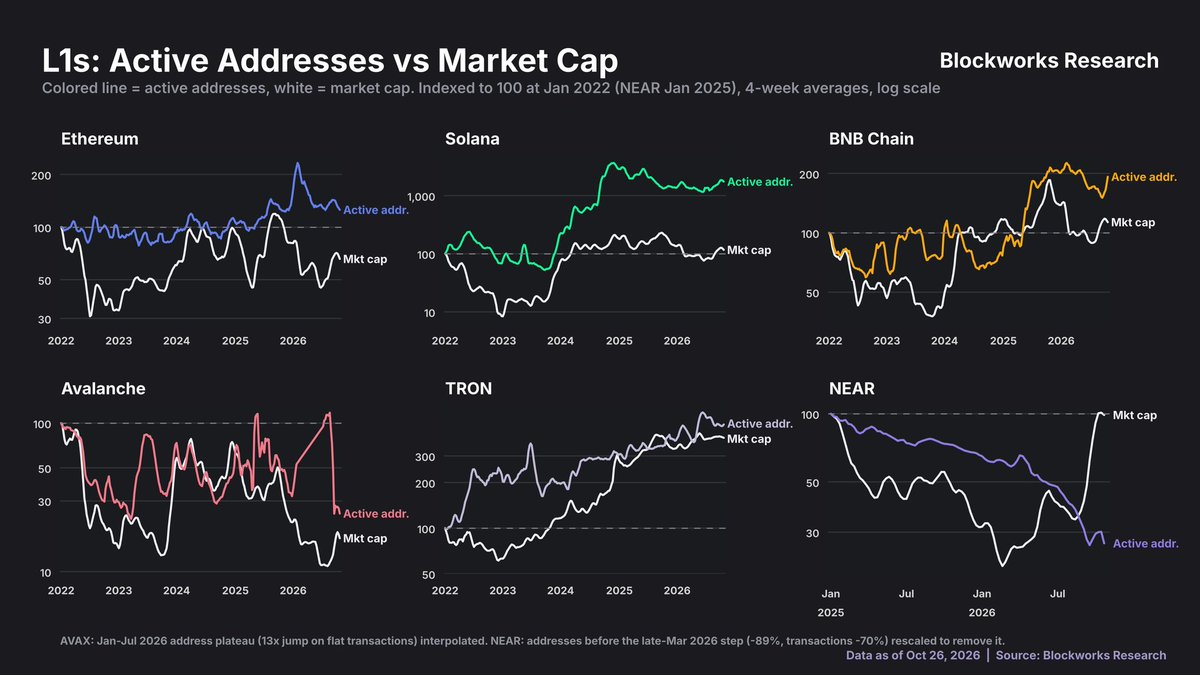
The weekly average active addresses of each L1 public chain (colored lines) and market capitalization (white line) show significant divergence, with no stable synchronized relationship between the two.
The correlation between DEX trading volume and market capitalization is higher than that of active addresses, particularly evident in Solana: both increased simultaneously from their low points in 2023 and peaked together. However, DEX trading volume is reported in dollars, so part of this correlation is naturally a result of rising token prices. As the proportion of tokenized assets in trading volume increases in the future, this relationship can be further examined for validity.
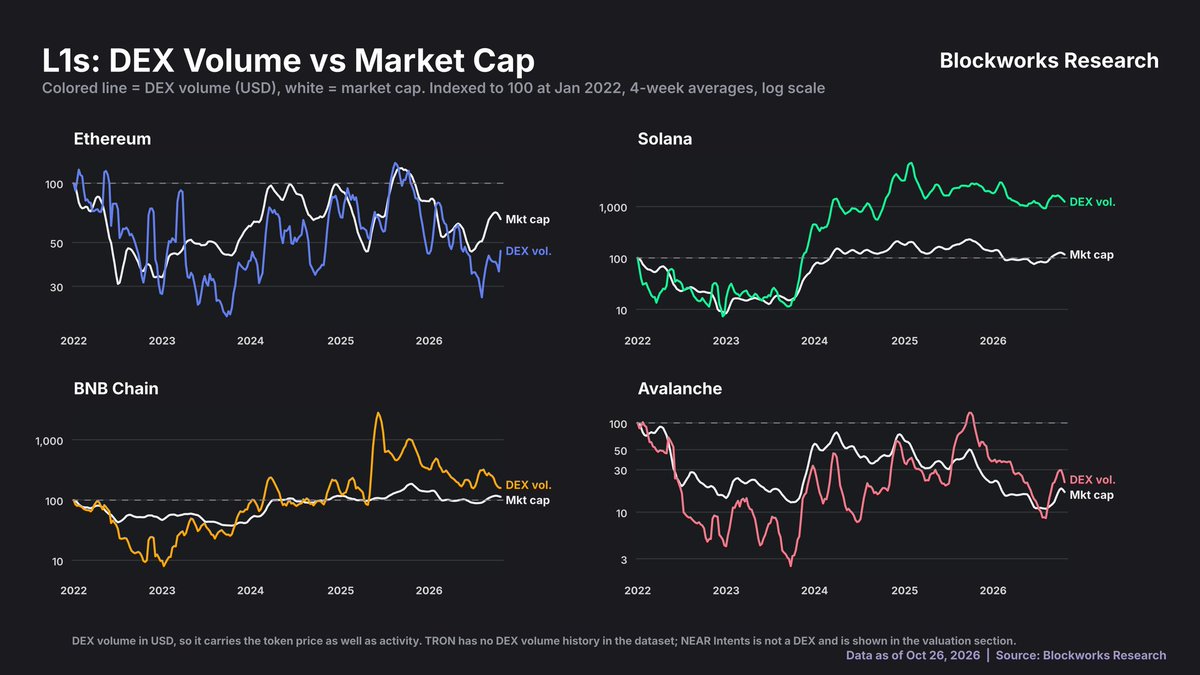
The DEX trading volume (colored lines) and market capitalization (white line) of each L1 public chain in dollar terms do not always move in sync, and dollar DEX trading volume itself is influenced by token prices.
The Metcalfe's Law is a classic framework for L1 valuation: network value is proportional to the square of the number of users, with an exponent of 2.
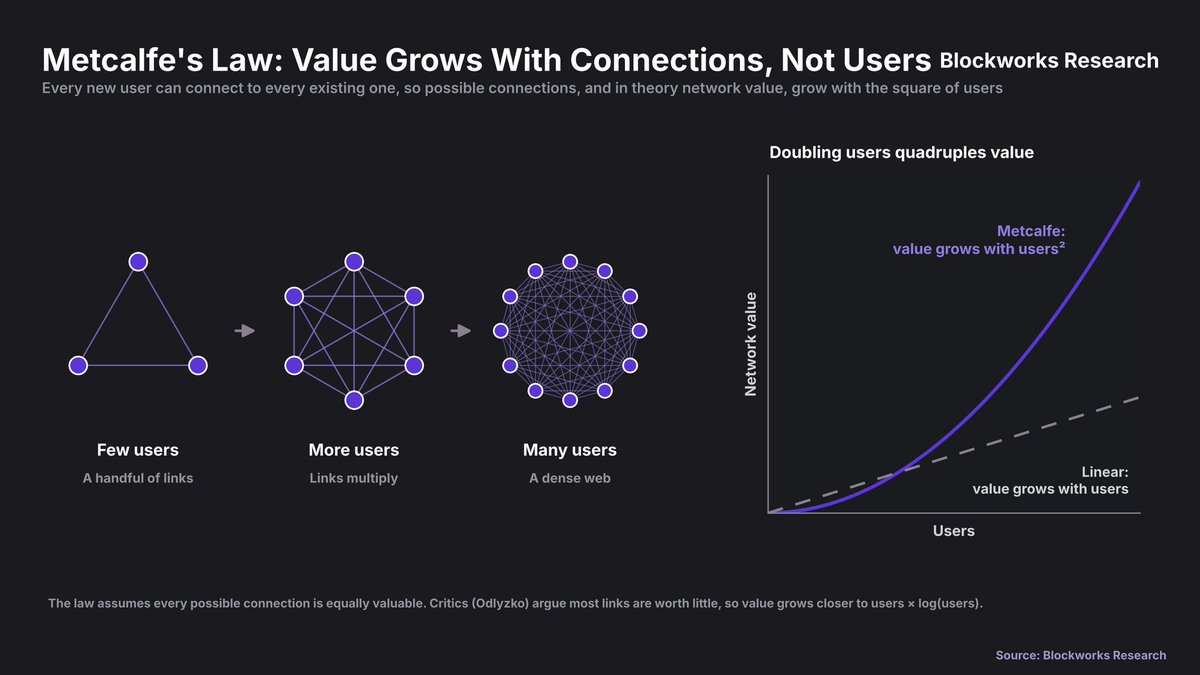
Metcalfe's Law posits that network value grows with the number of connections among users (the square of the number of users), but this theory assumes equal value for all connections; some opinions suggest the actual value is closer to the product of the number of users and the logarithm of the number of users.
Fitting active addresses to market capitalization, Ethereum's fit index is 0.56, while Solana and BNB are 0.62. This indicates that network value is more closely aligned with the square root relationship of active addresses, falling far short of a square relationship.
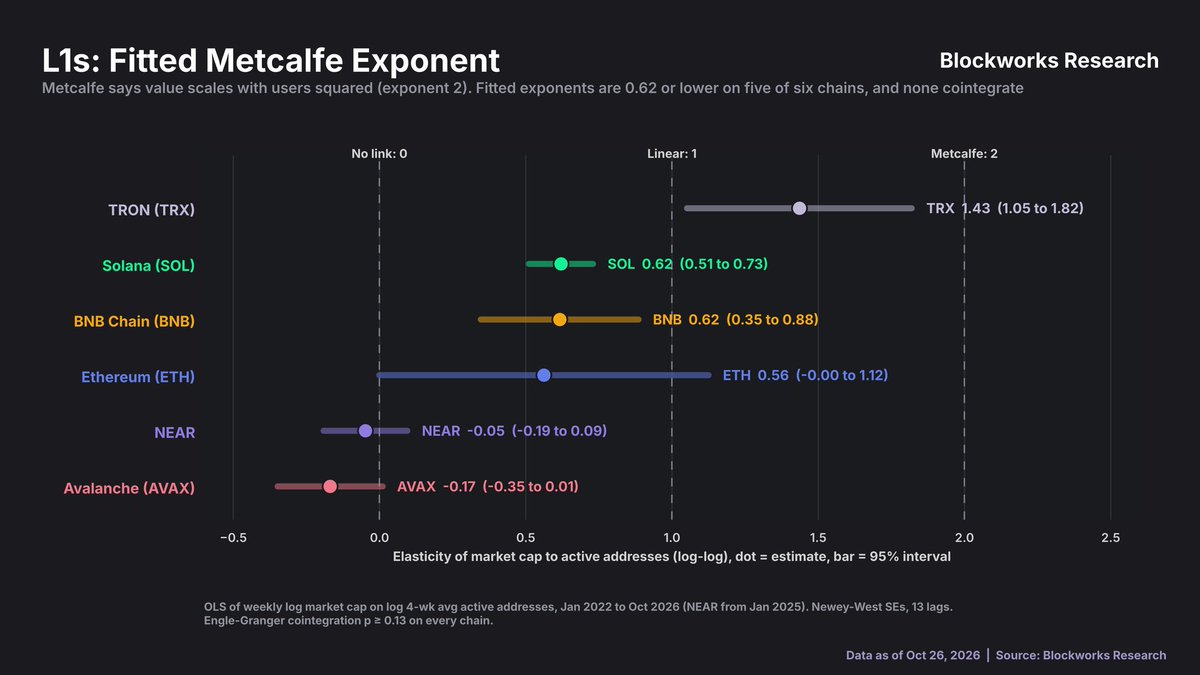
The Metcalfe indices fitted for the six major L1 public chains are mostly far below the theoretical value of 2, with five chains having indices at 0.62 or below, with some even being negative, indicating that the relationship between market capitalization and active addresses does not conform to Metcalfe's Law.
The crux of the issue lies not in the fit index but in the fact that the growth of active addresses will eventually slow. From January 2016 to now, Bitcoin's active addresses have only grown 1.3 times, while its market capitalization has increased 252 times. Ethereum has not deviated from this pattern: since February 2018, its active addresses have increased 2.6 times, and its market capitalization has increased 4.5 times, with active addresses explaining 84% of market capitalization fluctuations. Solana has a shorter operational timeline, making definitive conclusions difficult at this time, but this study still includes it in the observational sample.
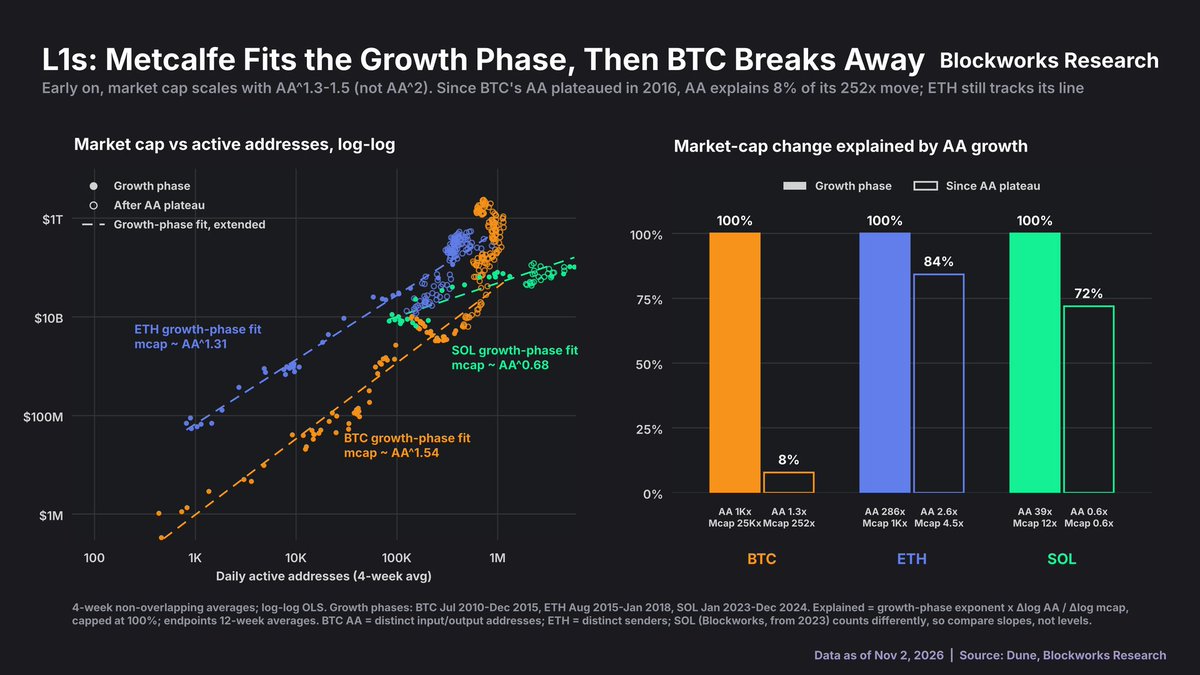
During the growth phase, the market capitalizations of BTC, ETH, and SOL scale with active addresses at around 1.3–1.5 (rather than the squared relationship proposed by Metcalfe’s theory); however, after Bitcoin's active addresses peaked, they could only explain 8% of its market capitalization fluctuations, while Ethereum and Solana still fit this relationship quite well.
Subsequently, this article tests six valuation multiples on these public chains: Metcalfe’s model, Odlyzko model (number of users × natural logarithm of number of users), NVT based on stablecoin transaction volume, market capitalization / DEX trading volume, market capitalization / protocol revenue, and market capitalization / stablecoin scale. A practical valuation model requires that the valuation multiple has mean-reverting properties, and that low readings can predict subsequent returns. However, test results show that not a single multiple reliably achieved mean-reversion. Only the market capitalization / protocol revenue indicator showed undervaluation signals that could predict performance over the next 13 weeks for Ethereum and TRON.
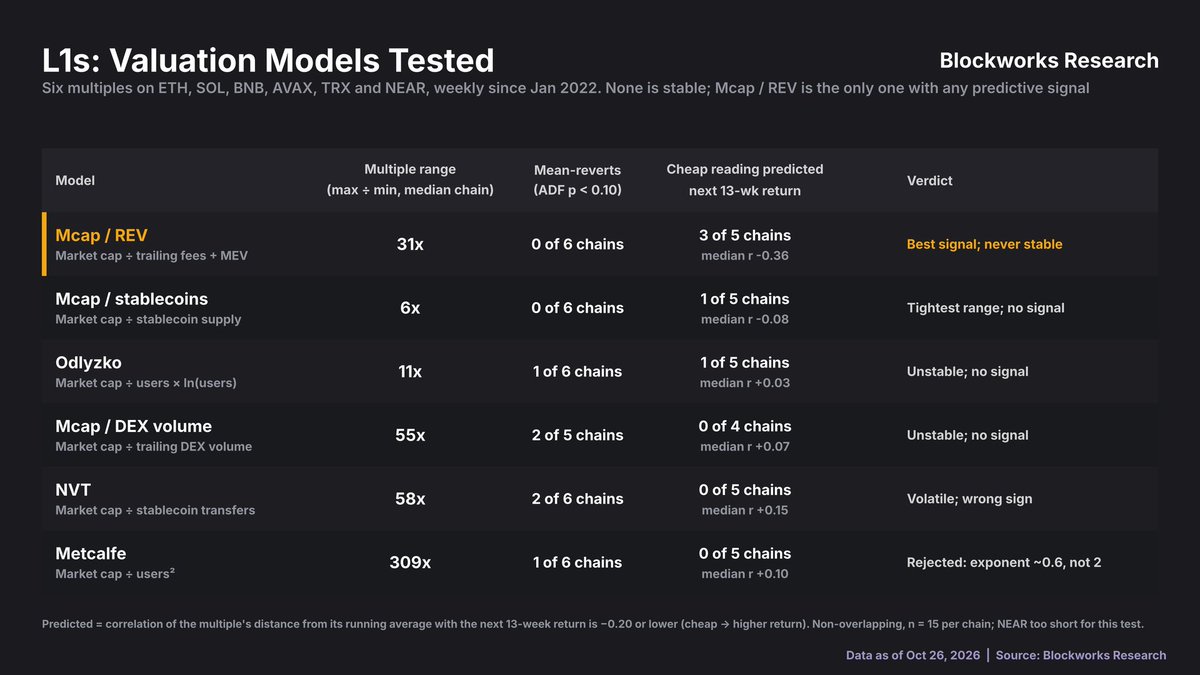
Testing six valuation indicators for six L1 public chains shows that none exhibit stable mean-reversion characteristics, with market capitalization / revenue (Mcap/REV) being the only one with some predictive signals, though it is highly volatile and unstable.
Next, examining the behavior characteristics of holders: no other L1 has a long-term accumulated chip base like Bitcoin. Including native staking, only 4% of SOL's circulating supply and 10% of ETH's has not transferred in over three years; this ratio for Bitcoin is as high as 42%.
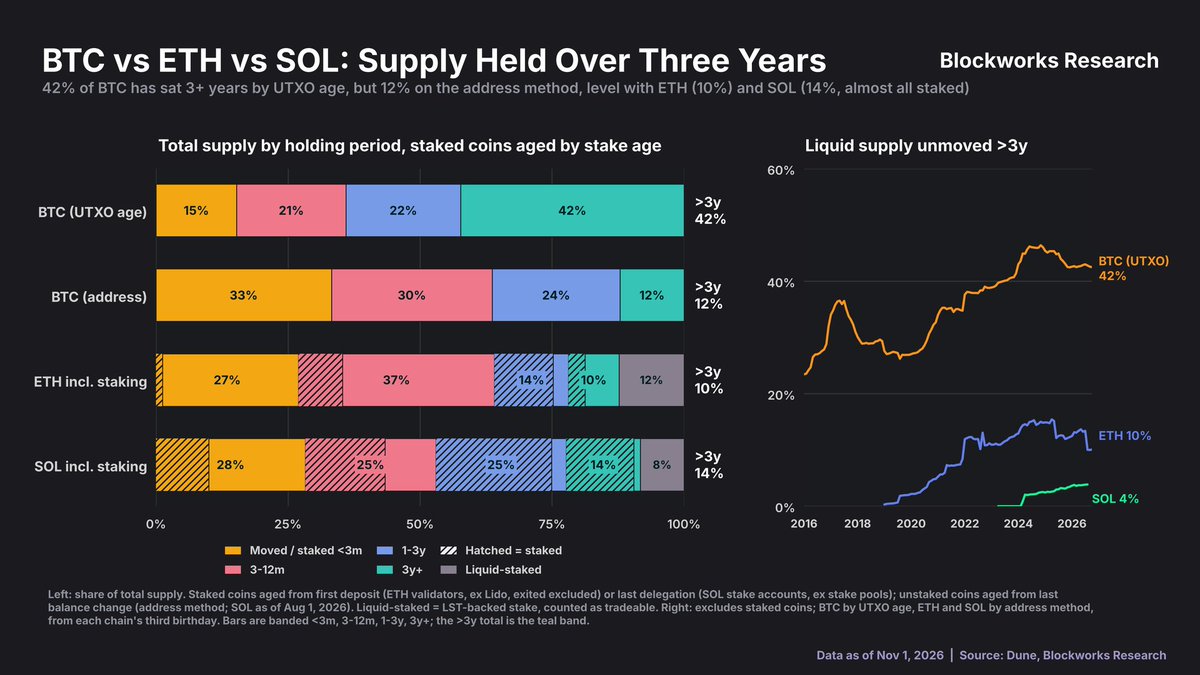
According to UTXO metrics, 42% of Bitcoin has not moved in over three years, but by address metric only 12%; the proportion of ETH (10%) and SOL (14%) not moved for more than three years is close to that of BTC by this metric, with most long-term SOL holdings being in staking.
At the same time, the top 100 non-staked addresses hold 49% of circulating SOL, while for ETH, the ratio is 27%, and for BTC, it is 17%. There are about 66,000 addresses holding at least $10,000 in SOL, 538,000 in Ethereum, and 3.67 million in Bitcoin (this gap may also reflect differences in market capitalization sizes across chains).
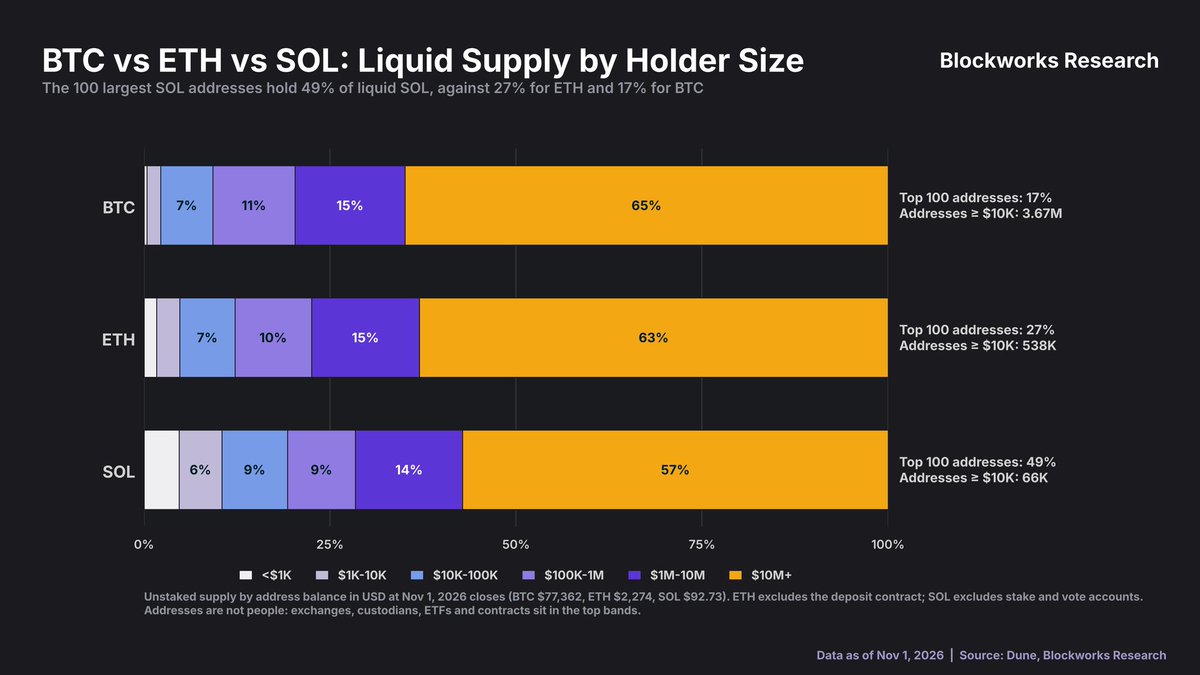
SOL has a significantly higher concentration of chips, with the top 100 addresses holding 49% of circulating chips, ETH at 27%, and BTC only 17%; all three have a large holding (over $10 million) accounting for a substantial portion of the circulating supply.
Focusing on Ethereum: Interestingly, its pricing logic corresponds to the capital base of similar public chains, rather than on-chain business activity levels. Among the L1 sample group, Ethereum accounts for 59% of the total market capitalization, 53% of stablecoin supply, 60% of stablecoin transfer scale, 70% of DeFi TVL, 75% of tokenized real-world assets (RWA), and 76% of lending-class TVL; however, its proportion of active addresses is only 5%, and its transaction volume accounts for about 1%.
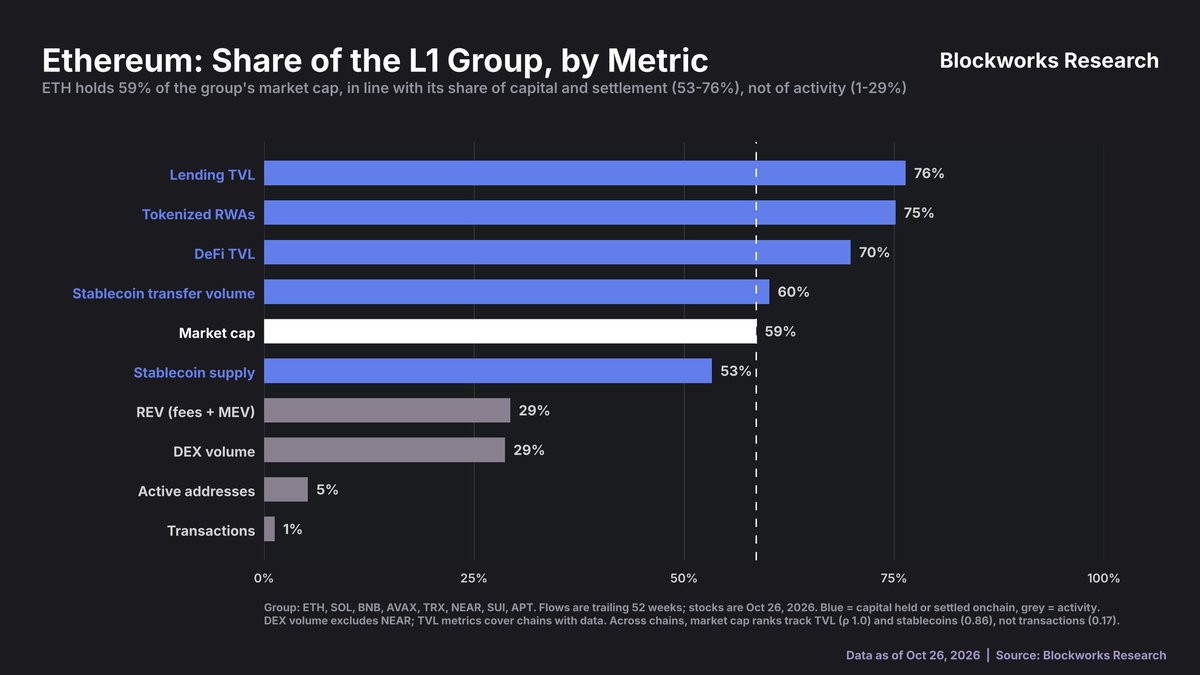
Ethereum occupies 59% of the total market capitalization in the L1 sector, and it also holds a high proportion in capital and settlement indicators like lending TVL, RWA, DeFi TVL, and stablecoins (53%-76%), but the proportion of on-chain activity indicators such as transactions, active addresses, income, and DEX trading volume is only 1%-29%, which is notably low.
Cross-chain comparisons show a similar pattern: by market capitalization ranking, the rankings of public chains are highly correlated with the TVL ranking (Spearman correlation coefficient 0.87) and moderately correlated with the stablecoin supply ranking (0.63); however, they show weak correlation with transaction volume (0.17) and active addresses (0.45).
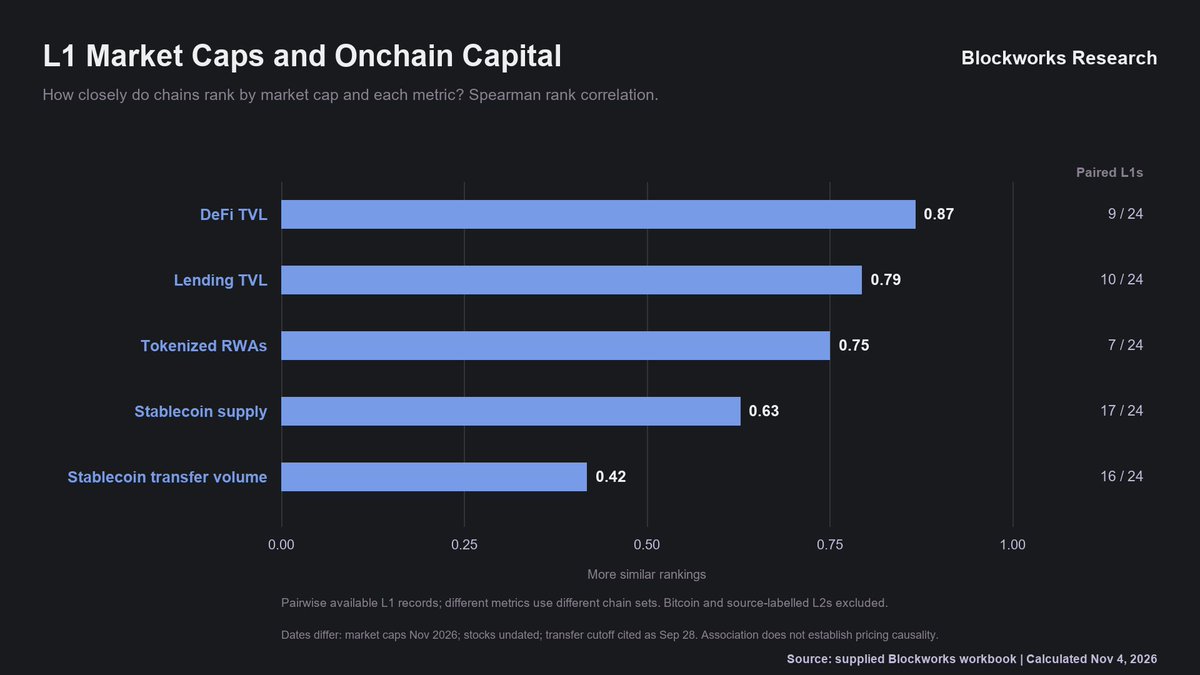
The correlation between the market capitalization ranking of L1 public chains and DeFi TVL is the highest (0.87), followed by lending TVL, tokenized RWA, and stablecoin stock; the correlation with stablecoin transfer volume is only 0.42, indicating that market capitalization rankings are better aligned with on-chain capital stock indicators, and significantly less so with transfer activity.
It is worth noting: within Ethereum's TVL, ETH no longer occupies the majority, and the self-circular bias of this indicator has thus been weakened.
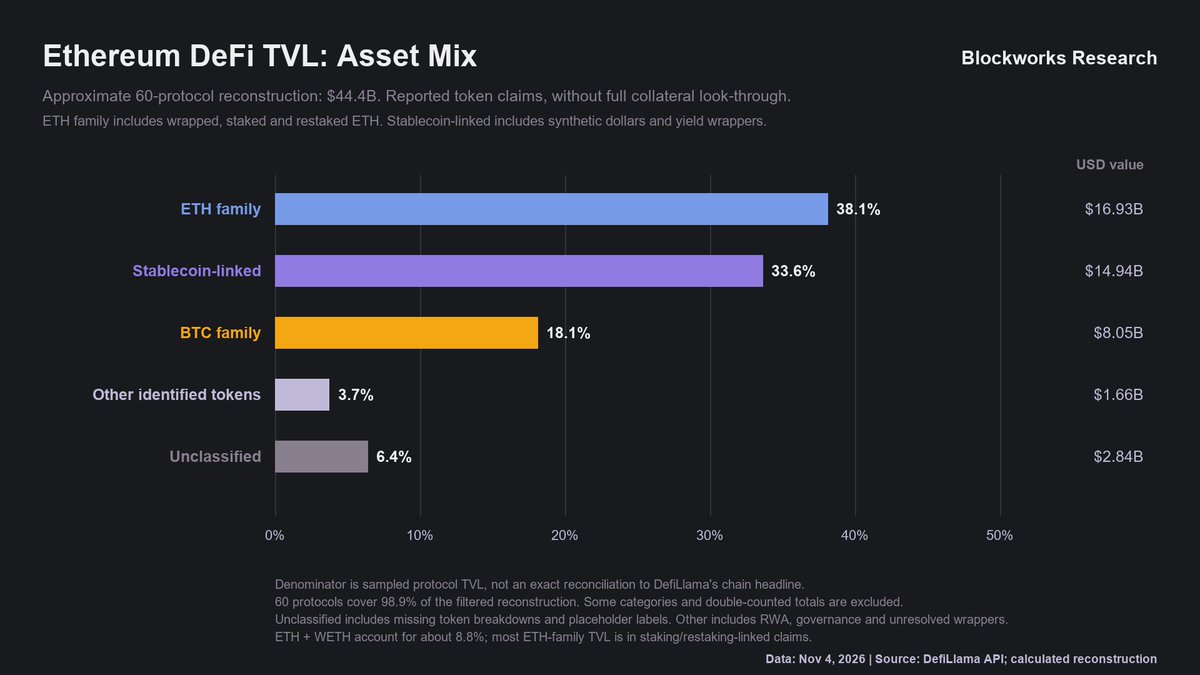
In Ethereum's DeFi with approximately $44.44 billion in TVL, ETH-related assets (including wrapped, staked, and restaked ETH) account for 38.1%, stablecoin-related assets 33.6%, and BTC-related assets 18.1%, with the three together exceeding 90%.
However, this is merely correlation at the ranking level, not a complete pricing model; but this conclusion corroborates the results of time-series regression, repeatedly verified across more than 40 public chains. Differences in holding entity structures also exist: the proportion of circulating volume represented by spot ETFs and listed company treasury holdings is 11.9% for ETH, roughly on par with BTC at 12.2%, but higher than SOL's 7.9%.
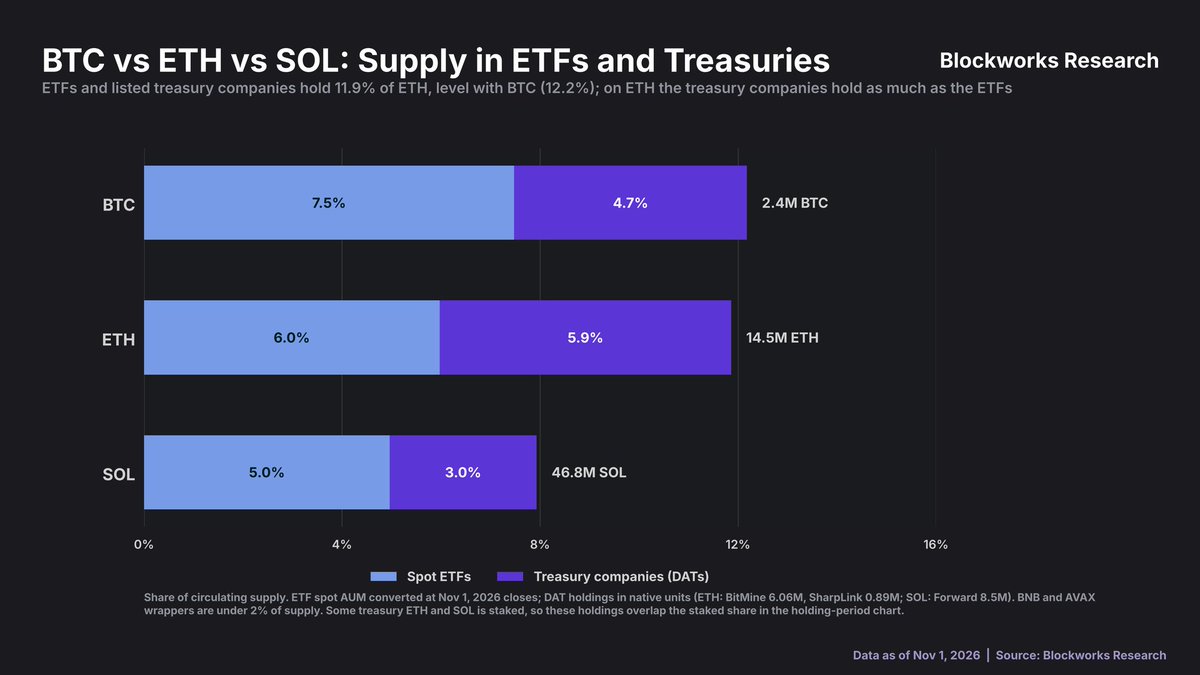
The combined holdings of spot ETFs and listed companies’ treasuries account for 12.2% of BTC's circulating volume, 11.9% of ETH (with ETH’s ETF and treasury holdings nearly equal), and only 8% for SOL.
Core conclusion: The key factor determining the valuation of L1 does not lie in how much on-chain transaction activity a chain carries, but in how much capital it can attract and retain. Bitcoin remains the dominant variable in short-term price fluctuations; from the current market perspective, the market does not regard L1 as a business target that continuously profits from fees, but rather sees it as a monetary asset competing for existing funds.
免责声明:本文章仅代表作者个人观点,不代表本平台的立场和观点。本文章仅供信息分享,不构成对任何人的任何投资建议。用户与作者之间的任何争议,与本平台无关。如网页中刊载的文章或图片涉及侵权,请提供相关的权利证明和身份证明发送邮件到support@aicoin.com,本平台相关工作人员将会进行核查。


