From a long-term fundamental perspective, the valuation of Layer 1 does not depend on how much on-chain activity it has processed, but rather on how much capital it attracts and retains.
Author: Marc Arjoon, CFA (@marcarjoon)
Translation: Deep Tide TechFlow
Original link: https://x.com/marcarjoon/status/2117996054582898998
Deep Tide Guide: The crypto industry has long debated the valuation anchors of public chains, questioning whether it is protocol fee revenue (REV), active address counts, DEX trading volumes, or whether the law of network effects can explain the market capitalization performance of public chains. Chartered Financial Analyst (CFA) Marc Arjoon provides detailed data testing through a multi-year time series regression analysis of mainstream Layer 1 assets.
Empirical research shows that, in the short term, the price fluctuations of all mainstream Layer 1s are still dominated by Bitcoin's Beta coefficient. However, in terms of long-term valuation, Ethereum has become thoroughly decoupled from its own protocol revenue, with on-chain valuation showing characteristics highly correlated with total locked value (TVL) and stablecoin supply, reflecting that the market currently prefers to see public chain tokens as liquid assets competing for liquidity rather than traditional discounted cash flow businesses.

Short-term Pricing Mechanism: Layer 1 Token Nature Dominated by Bitcoin Beta Coefficient
The brief conclusion is: within any investment cycle of concern to traders, the trading performance of Layer 1 tokens essentially depends on Bitcoin's Beta coefficient.
I performed regression analysis on the monthly logarithmic changes in the market capitalizations of various Layer 1s against Bitcoin, subsequently incorporating four on-chain time series data: real protocol revenue (REV) denominated in native tokens, active address counts, DEX trading volumes, and stablecoin supply.
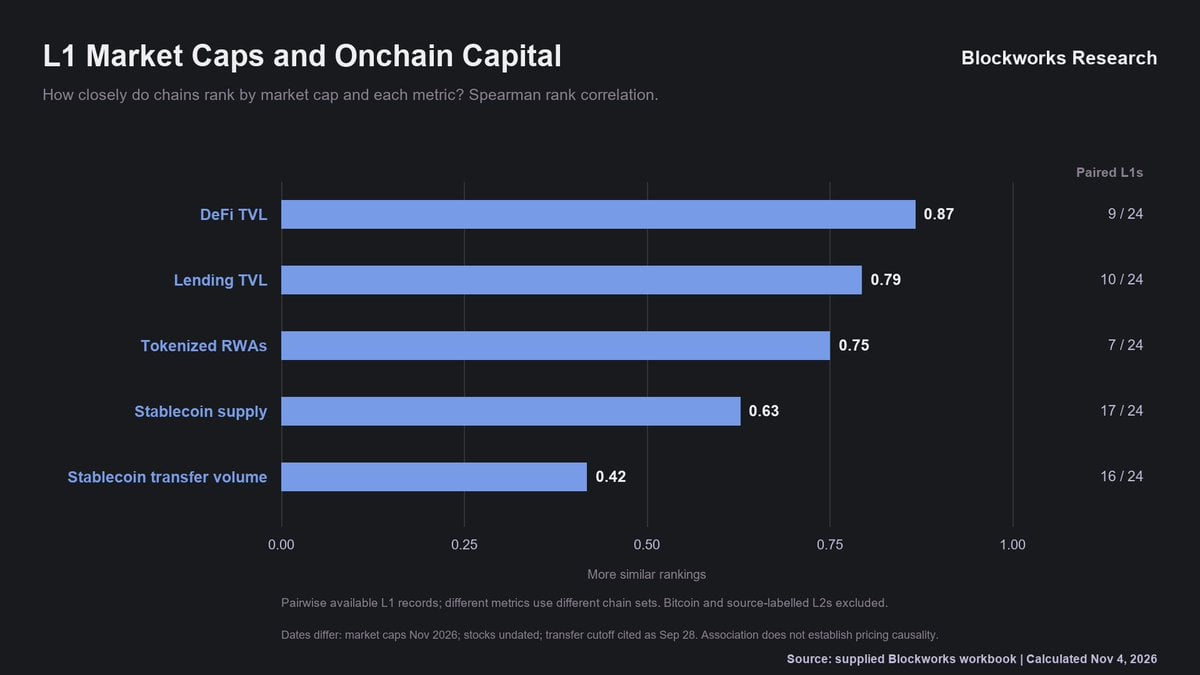
Figure: Regression Analysis of Market Capitalization Changes of Each L1 Against Bitcoin and On-chain Indicators
Dollar-Valued Illusion: Decoupling of Native Tokens and Real Protocol Revenue
Further analysis shows that dollar-valued indicators tend to beautify the fundamentals. This is because when token prices rise, fees paid in native tokens appear more substantial in dollar terms, and total locked value (TVL) largely reflects the market capitalization of native tokens.
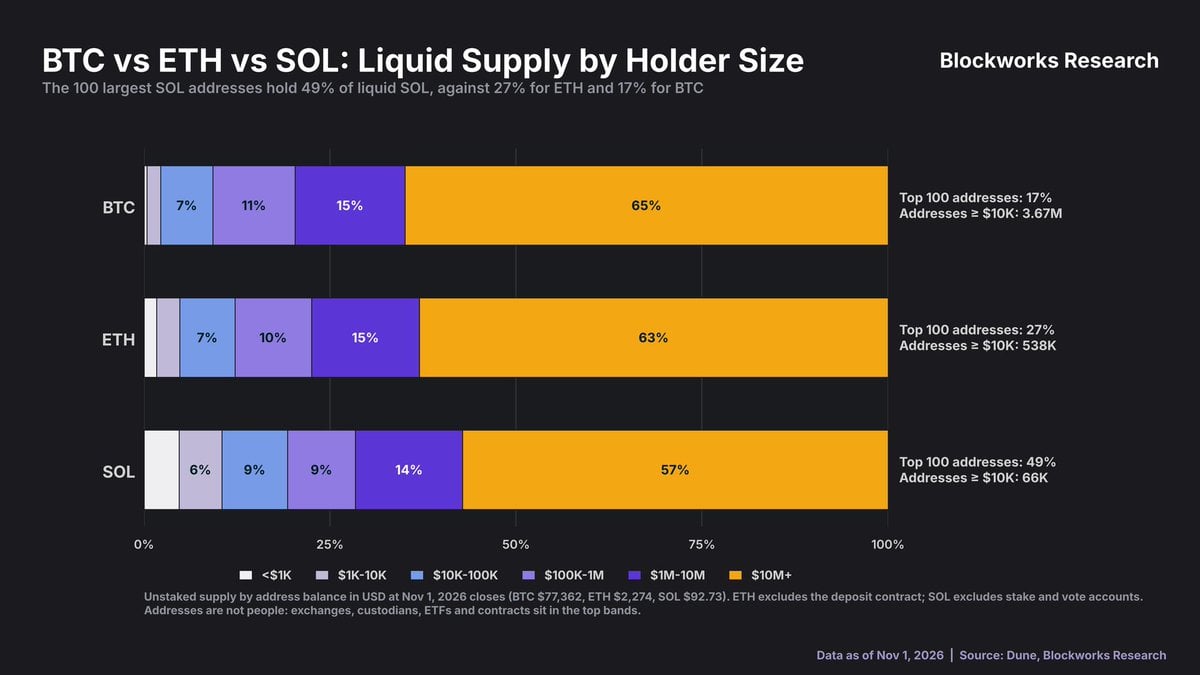
Figure: Comparison of Real Protocol Revenue in Native Tokens and Dollar Valuation
Decoupling of Ethereum's Revenue: Policy Design Rather Than Demand Collapse
Ethereum is the most obvious case of real protocol revenue (REV) decoupled from network market capitalization.
During the week of the Cancun upgrade (Dencun), Ethereum's cumulative real protocol revenue over the past 12 months was $, while by August 2025 it had dropped to $, a decrease of 60%.
Meanwhile, its market capitalization has risen against the trend, increasing from $ to $. This is a proactive policy design choice rather than a collapse of genuine demand. The introduction of Blob fees and raising gas limits were intended to lower the block space price of Layer 1.
Ethereum's price rebound in 2025 mainly relies on the demand driven by spot ETFs and corporate treasury allocations.
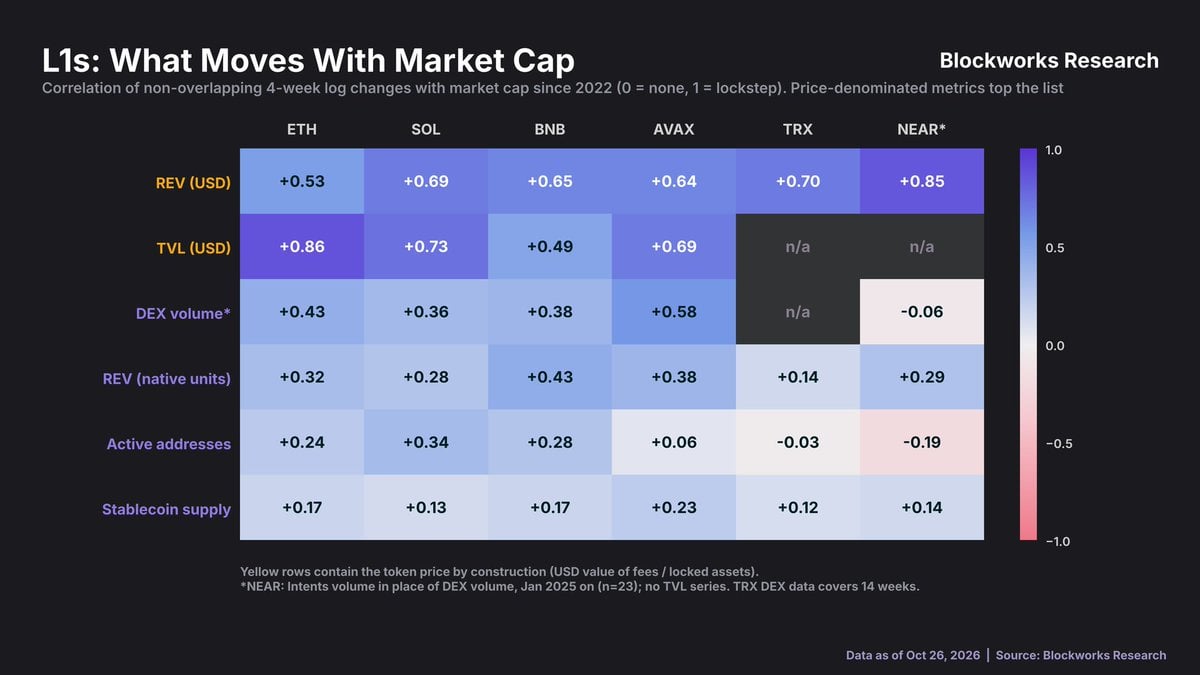
Figure: Decoupling Trend of Ethereum’s Protocol Revenue and Market Capitalization Over the Past 12 Months
Solana's Resonance Phenomenon: Synchronized Fluctuations of Protocol Revenue and Market Capitalization
Solana serves as a typical representation of synchronized fluctuations between protocol revenue and network market capitalization.
Since January 2023, Solana has seen its protocol revenue and market capitalization both grow by approximately 15 times over the past 12 months, peaking in the same week at $ and $ respectively.
Subsequently, both indicators experienced synchronized declines, currently down to $ and $.
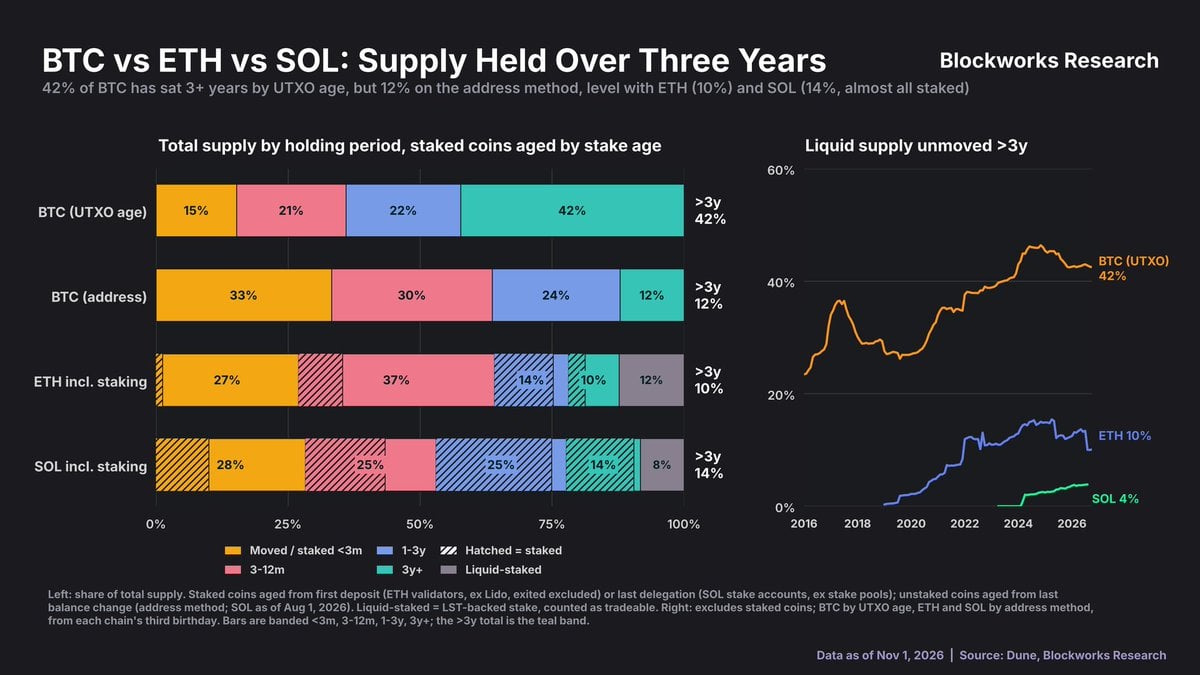
Figure: Synchronized Trend of Solana’s Protocol Revenue and Market Capitalization Over the Past 12 Months
Active Addresses and Trading Volume: Weak Correlation and Cyclical Divergence
Next, I examined the relationship between the number of active addresses and the trading volume on decentralized exchanges (DEX). Over a complete cycle, active addresses displayed a trend of drifting in the same direction as market capitalization, a phenomenon most clearly observed in Solana and TRON.
However, at the weekly level, this correlation significantly weakened, showing substantial divergence.
Since January 2022, Ethereum's number of active addresses has grown by 26%, but its market capitalization has declined by 34%; while Solana's active addresses increased 17-fold, its market capitalization rose only by 17%.
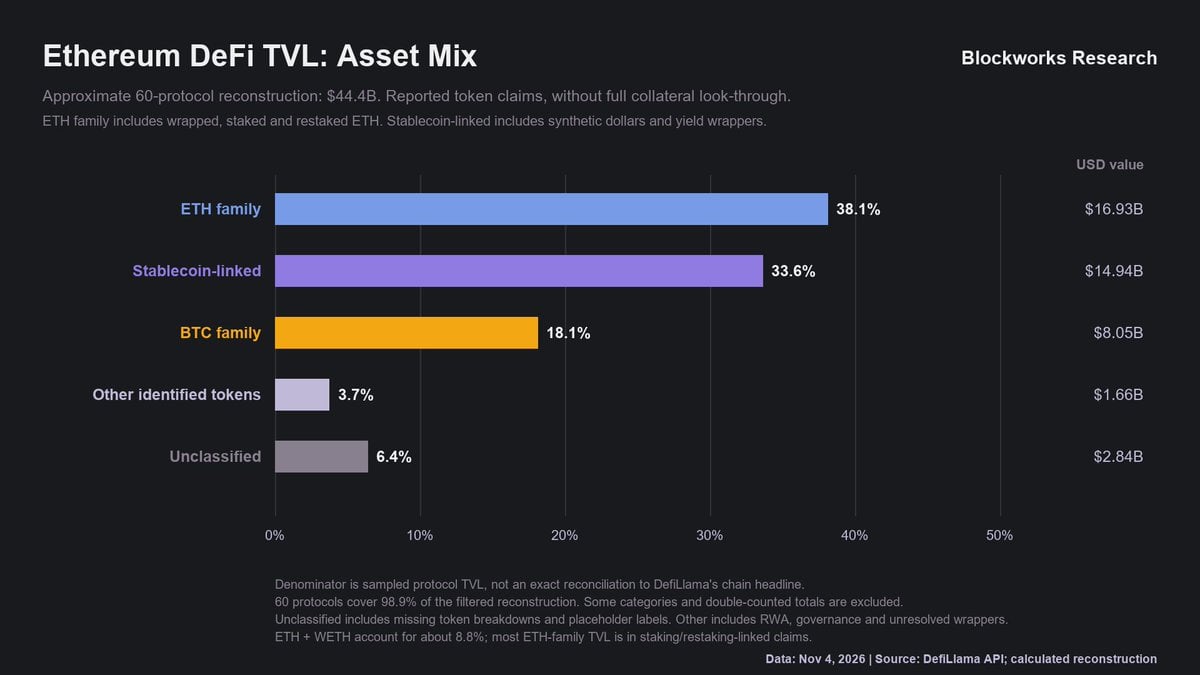
Figure: Comparative Cycle Trends of Active Addresses and Market Capitalization
DEX trading volume tracks market capitalization more closely than active addresses, especially on Solana, where both metrics began to rise from 2023's low point and peaked together.
However, it is essential to note that DEX trading volume is denominated in dollars; therefore, part of the fit is contributed by price fluctuations of the tokens themselves. As tokenized assets rise in trading volume share, we can further test whether this relationship remains valid.
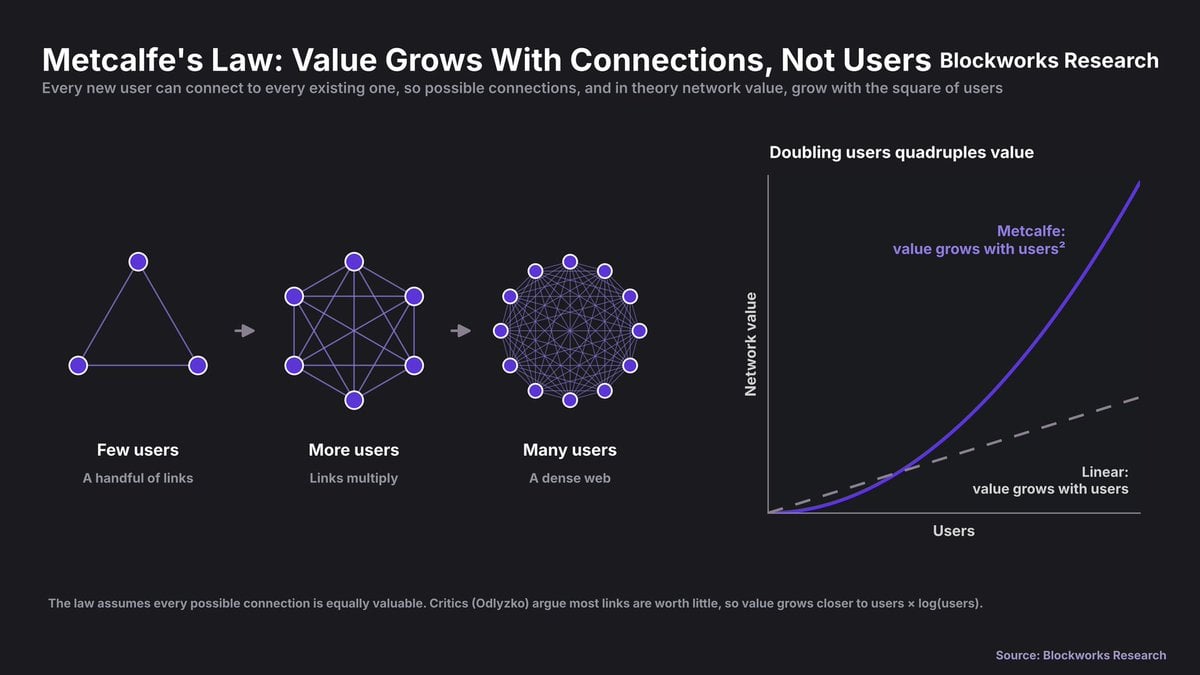
Figure: Tracking Trend of DEX Trading Volume and Market Capitalization
Measurement of Metcalfe’s Law: Network Value Approaching the Square Root of Address Count
Metcalfe’s Law provides a classic model for assessing these Layer 1s. This law states that network value is proportional to the square of the number of users (exponent 2).
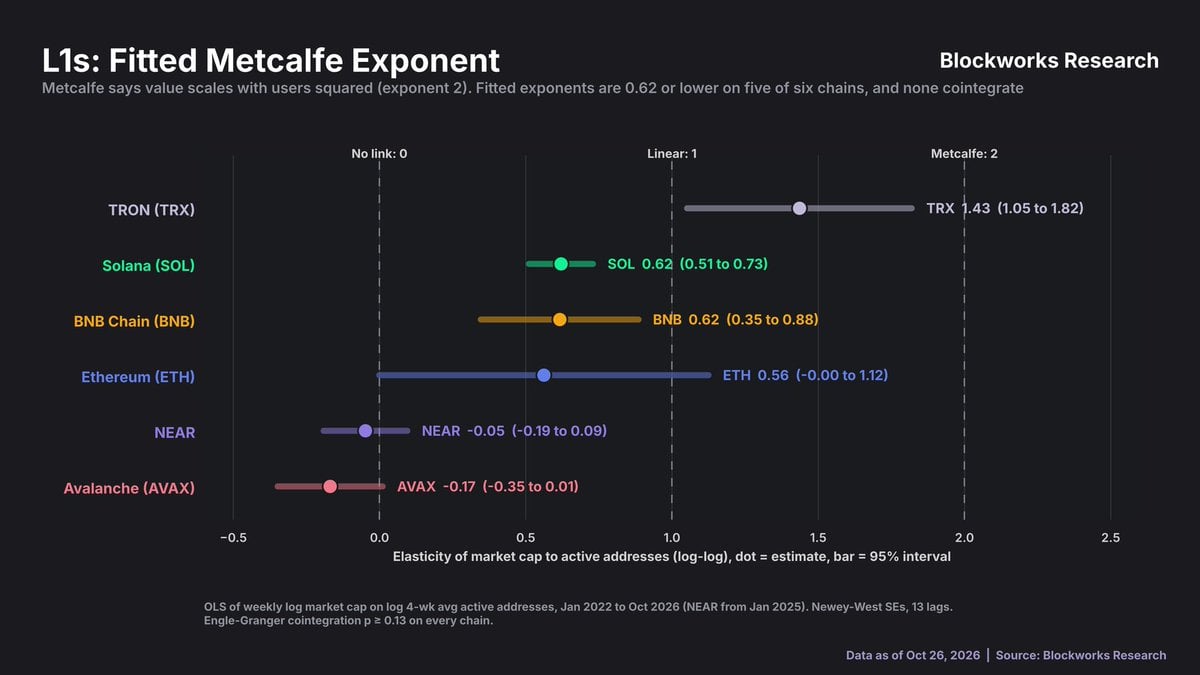
Figure: Fitting of Network Value Under Metcalfe’s Law
Fitting market capitalization against active address counts yielded elasticity indices of 0.56 for Ethereum and 0.62 for Solana and BNB. Thus, the actual rate of value expansion is more aligned with the square root of address counts rather than with their square.
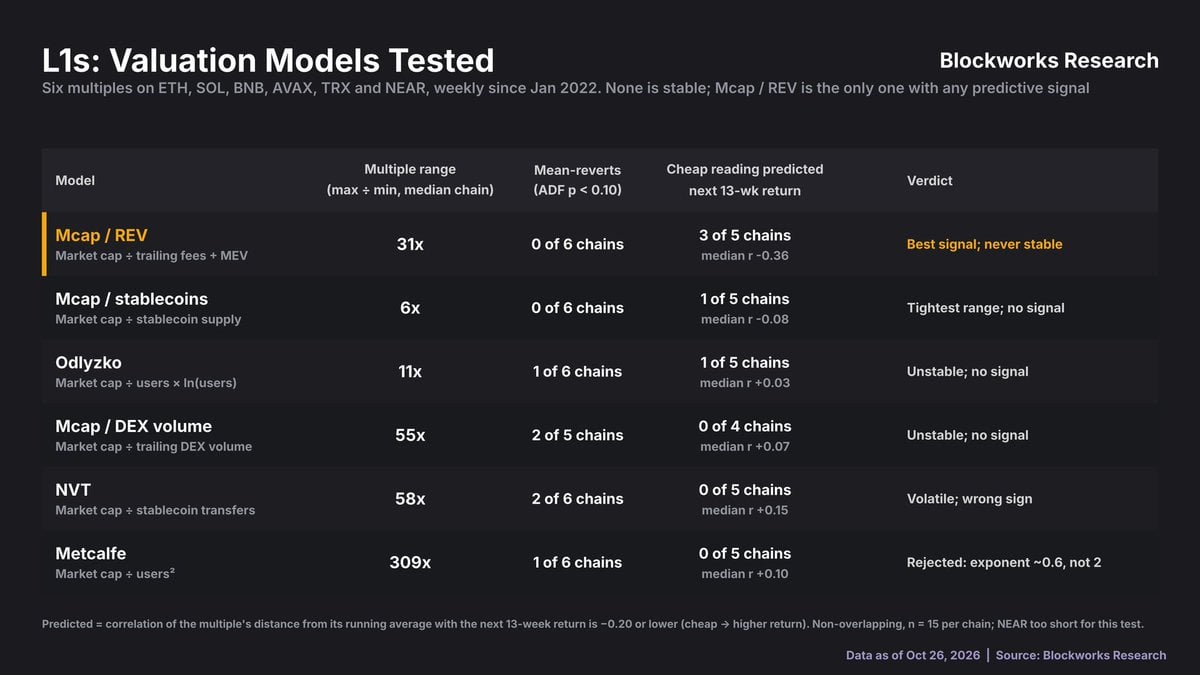
Figure: Fitting of Elasticity Coefficient of Market Capitalization Against Active Address Counts
The core issue is that the growth rate of active addresses will gradually slow down with network development, rather than being merely a matter of exponent size.
Since January 2016, Bitcoin's active addresses have only grown by 1.3 times, while its market capitalization has increased by 252 times. Ethereum has not deviated from this pattern: since February 2018, its active addresses have increased by 2.6 times, and its market capitalization by 4.5 times, with changes in active addresses explaining 84% of market capitalization fluctuations. Solana's current cycle time is shorter, but overall still aligns with a similar trajectory.
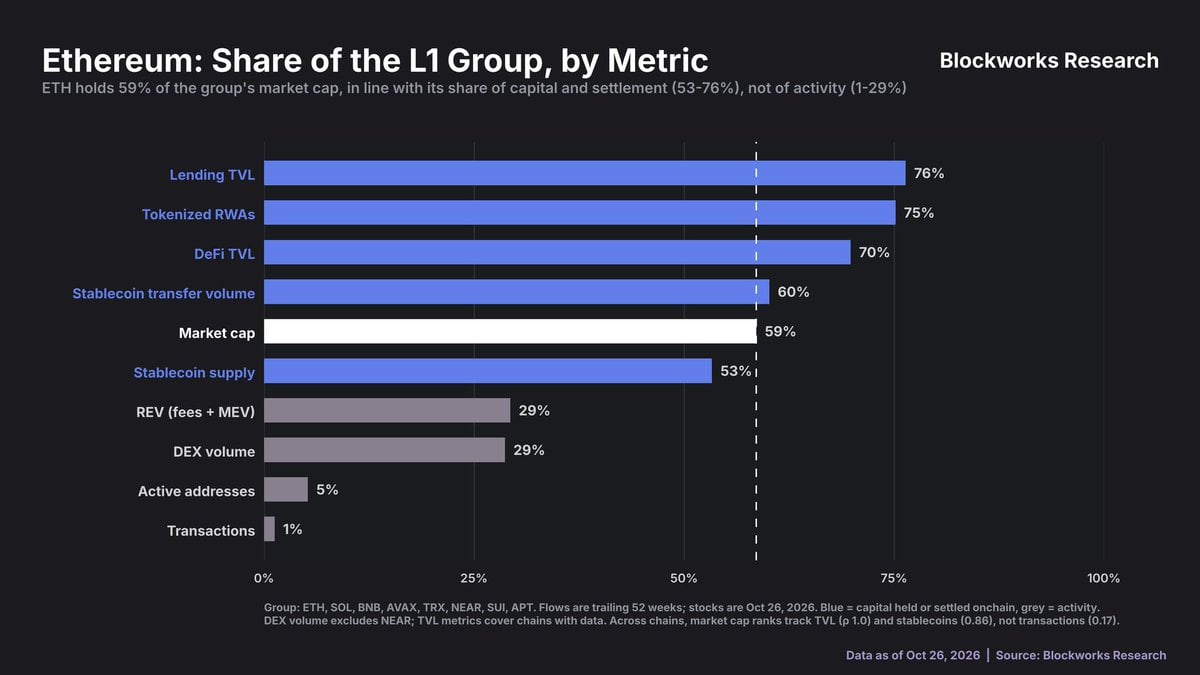
Figure: Long-Term Comparison of Active Address Growth Rate and Market Capitalization Multiples
Public Chain Valuation Multipliers Examination: Failure of Mean Reversion and Revenue Predictive Power
Subsequently, I tested six types of valuation multipliers across these chains: Metcalfe's multiplier, Odlyzko multiplier (users count times natural logarithm), NVT based on stablecoin transaction volumes, market capitalization to DEX trading volume, market capitalization to protocol revenue (Mcap/REV), and market capitalization to total stablecoin supply.
A practical valuation model requires that its multipliers can reliably mean-revert and effectively predict future revenues when undervalued.
However, testing showed that no multiplier exhibited stable mean-reversion characteristics. The market capitalization to protocol revenue (Mcap/REV) is the only metric that can predict positive returns over the next 13 weeks when undervalued across multiple public chains (Ethereum and TRON).
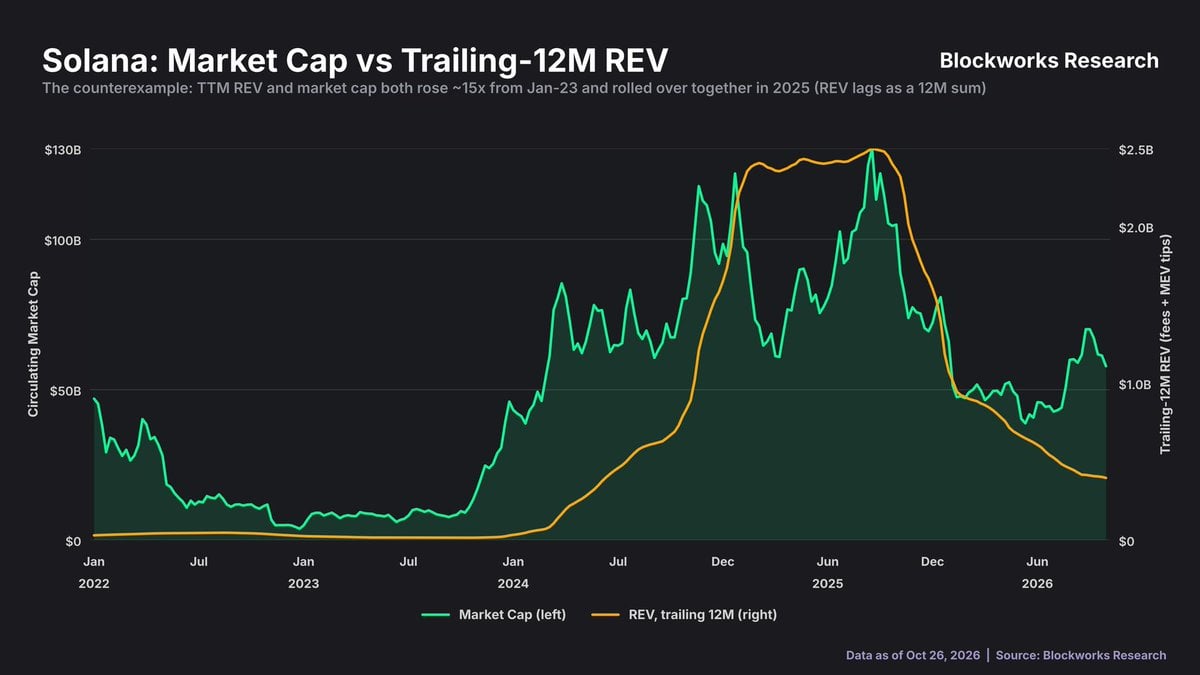
Figure: Comparative Predictive Effect of Six Common Public Chain Valuation Multipliers
Holder Structure Differences: Retained Capital and Long-term Holding Base
From the perspective of holder behavior, no Layer 1 has a long-term holder base as robust as Bitcoin.
Even including native staking, only 4% of Solana's supply and 10% of Ethereum's supply have remained stagnant for over three years, while the corresponding long-term inactive proportion for Bitcoin is as high as 42%.
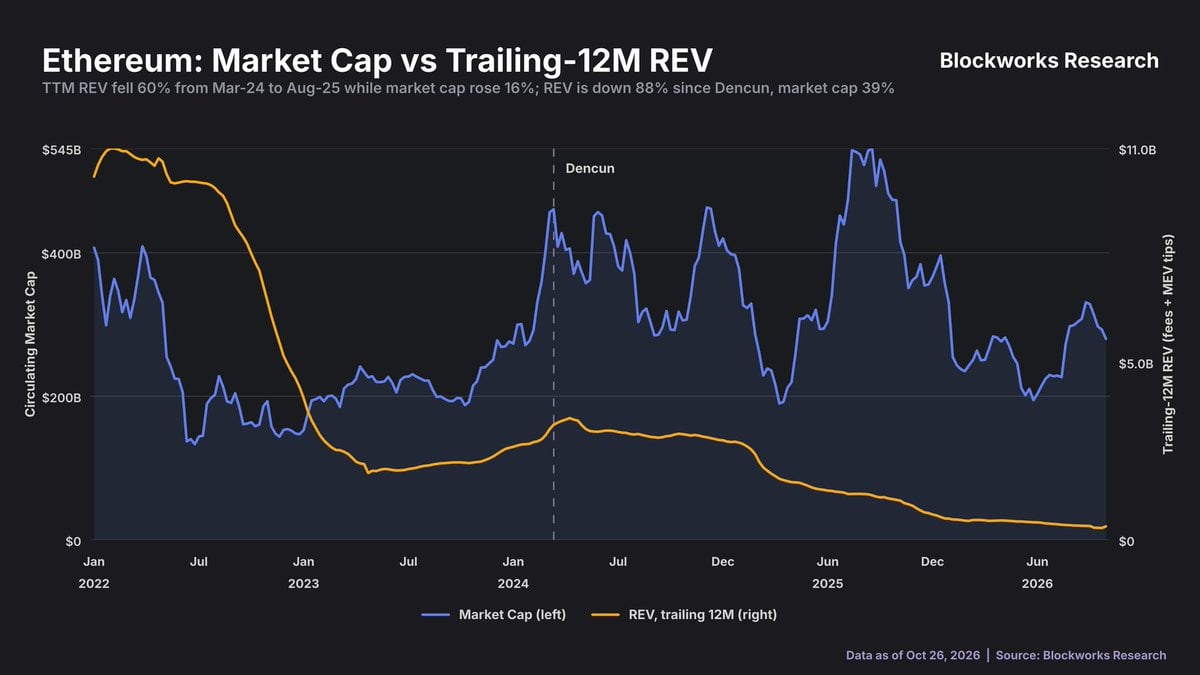
Figure: Comparison of Proportions of Token Supply Held for Over 3 Years
At the same time, the top 100 non-staked Solana addresses control 49% of circulating SOL, while the top 100 Ethereum addresses hold 27%, and Bitcoin 17%.
The number of addresses holding values of $100,000 and above is about 66,000 for Solana, while Ethereum has 538,000, and Bitcoin has 3.67 million (this possibly reflects the differences in total market capitalization among the assets).
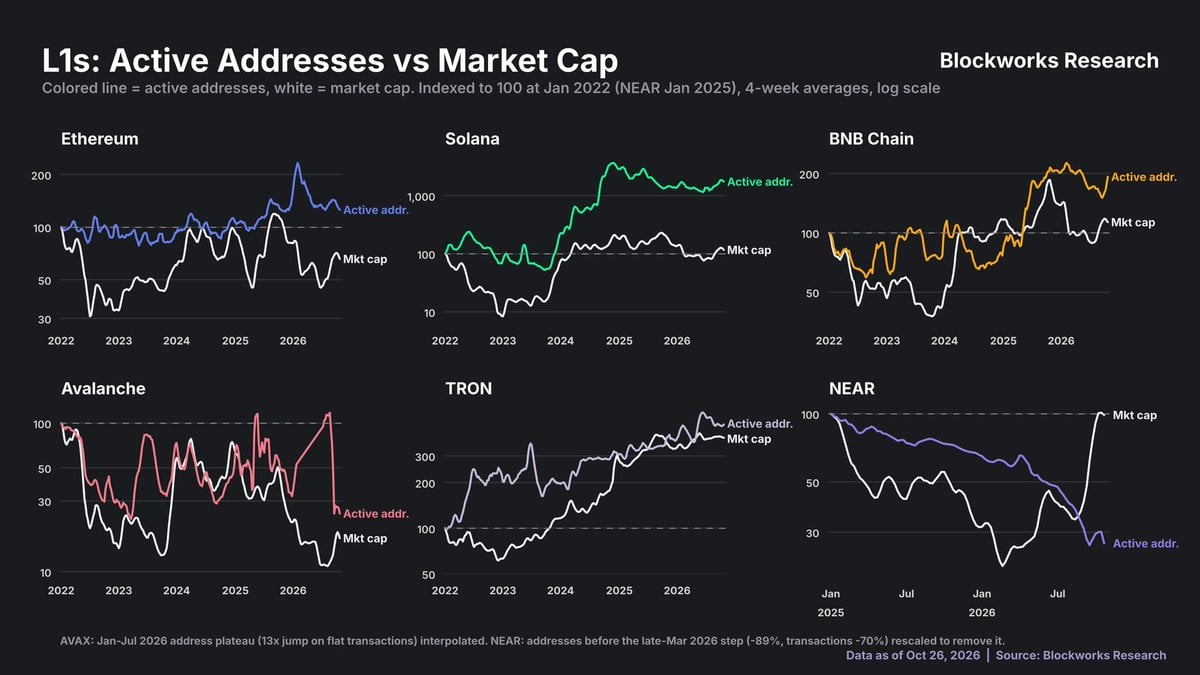
Figure: Concentration of Non-Staked Liquid Tokens and Distribution of Large Holding Addresses
Ethereum's Real Pricing Anchor: Peer Capital Volume Rather Than On-chain Interactions
Focusing on Ethereum, an interesting phenomenon is that its pricing mechanism is relative to the capital volumes of its competitors rather than based solely on on-chain activity.
In the comparison group of mainstream public chains, Ethereum holds 59% of the total market capitalization share, 53% of the stablecoin supply, 60% of stablecoin transaction volume, 70% of DeFi TVL, 75% of tokenized real-world assets (RWA), and 76% of lending protocol TVL.
In contrast, Ethereum's shares in active addresses and on-chain transaction counts are much smaller, accounting for only 5% and approximately 1%, respectively.
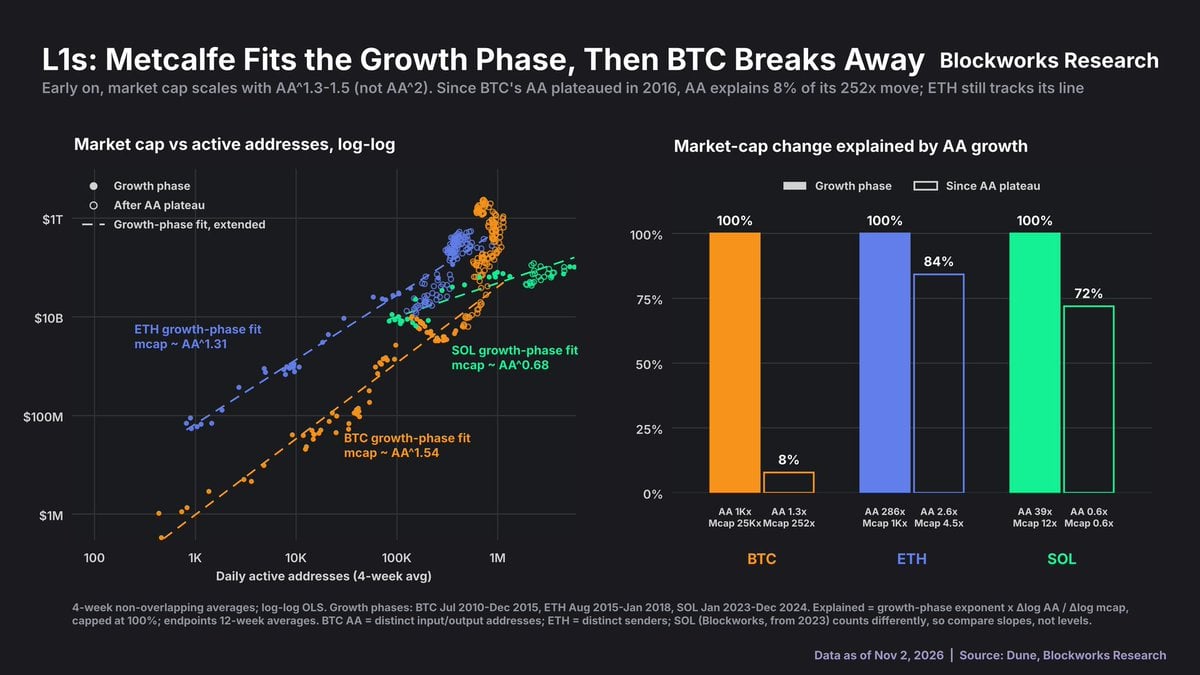
Figure: Comparison of Ethereum’s Capital Retention Share Among Peer Public Chains and Activity Share
Overall Chain Correlation Examination: Total Lockup and Stablecoins Driving Market Capitalization Rankings
This pattern generally holds across different public chains. When ranked by market capitalization, the rankings of public chains highly conform to their positions in total locked value (TVL) (Spearman rank correlation coefficient of 0.87), and they also show a strong correlation to the rankings of stablecoin supply (0.63).
However, the correlation coefficient of market capitalization rankings to on-chain transaction counts is only 0.17, and to active address counts, only 0.45, showing extremely weak associations.
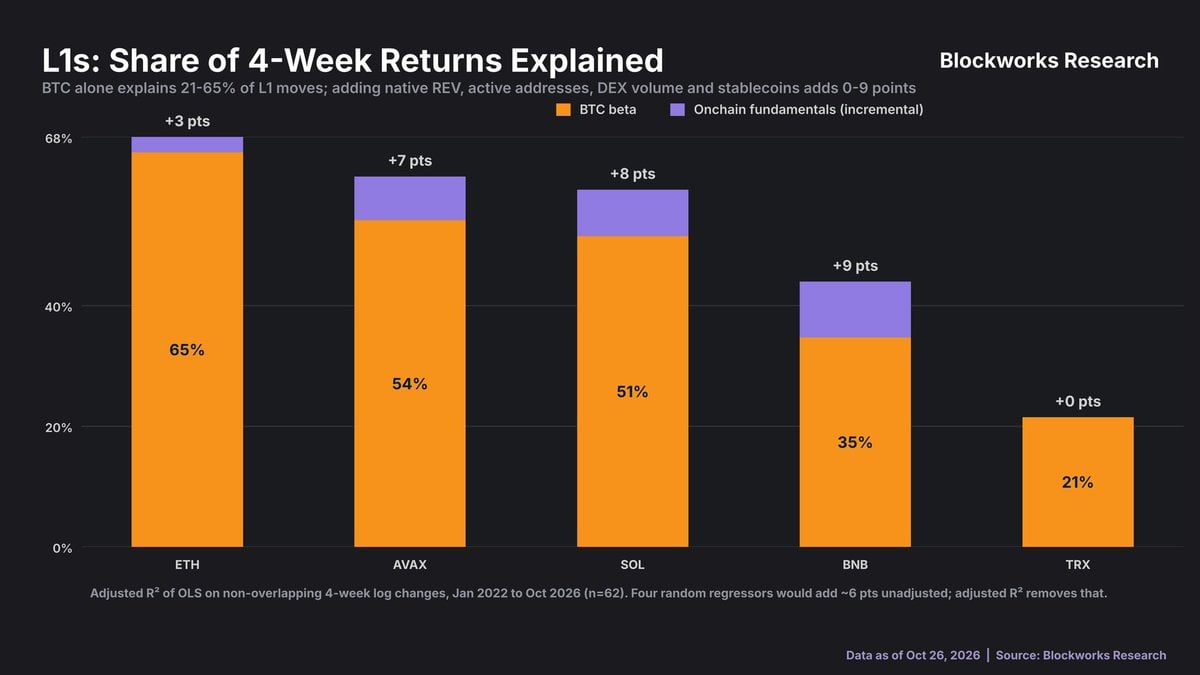
Figure: Rank Correlation Analysis of Market Capitalization With TVL, Stablecoin Supply, and Transaction Activity
It is noteworthy that the current composition of TVL on Ethereum no longer has ETH itself occupying a dominant proportion, greatly reducing the autocorrelation of this metric and increasing its reference value.
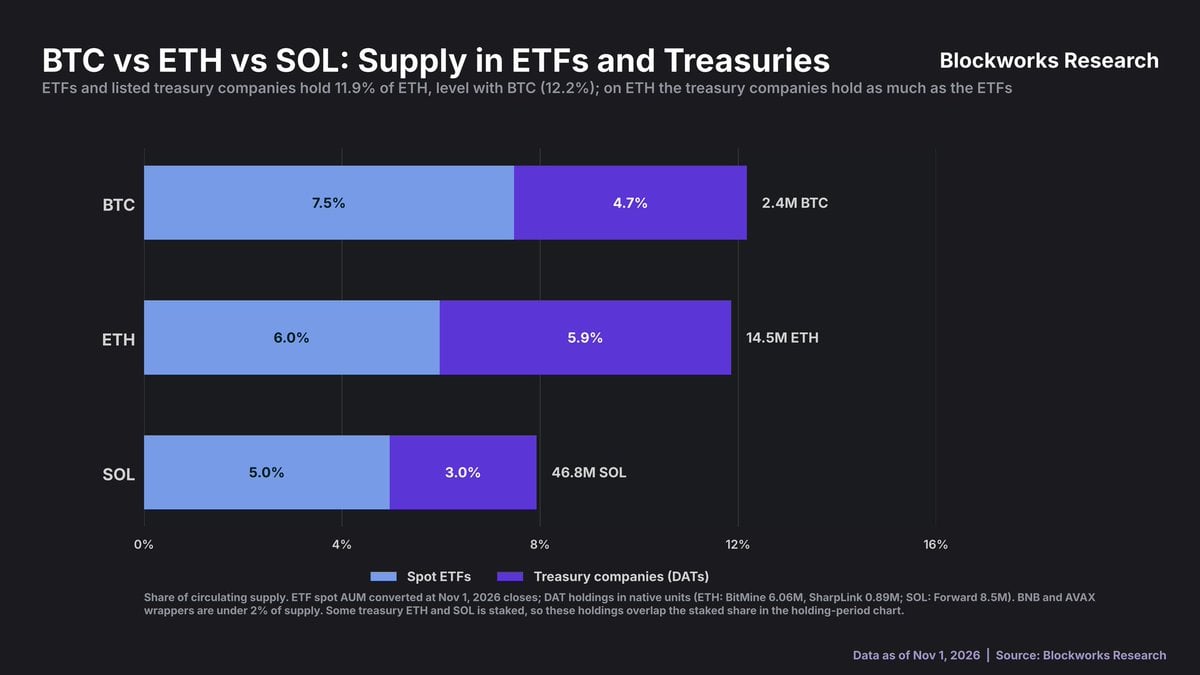
Figure: Evolution of Asset Composition in Ethereum's Total Locked Value
Although this is simply a horizontal ranking rather than a complete causal model, it aligns closely with the results of time series regression (even after running on a sample of over 40 public chains).
Another notable difference lies in the structure of the holders. Currently, spot ETFs and corporate treasuries hold 11.9% of Ethereum's total supply, roughly equal to Bitcoin's 12.2%, and significantly higher than Solana's 7.9%.
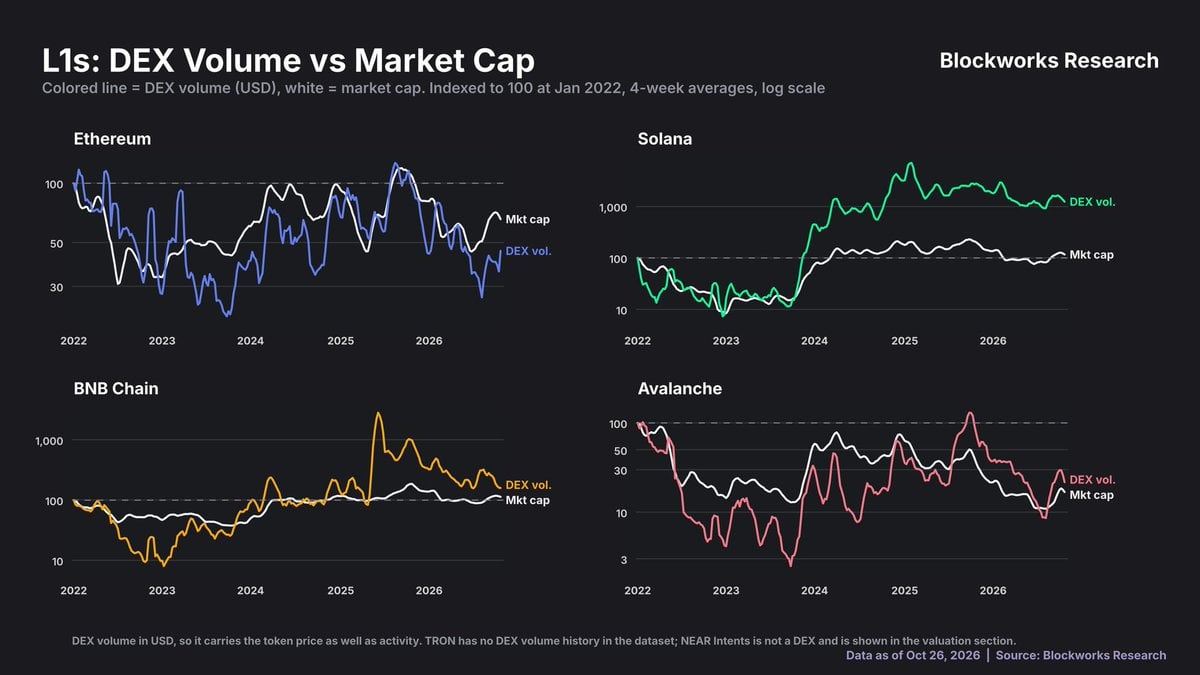
Figure: Ownership Proportion of Spot ETFs and Corporate Treasuries in Each Token's Supply
Final Reflection on Public Chain Valuation: The Monetary Asset Attribute of Competing for Capital Retention
The ultimate core insight is that the valuation drivers of Layer 1 depend less on how much on-chain interaction the network processes and more on how much capital it can attract and retain.
Bitcoin remains the dominant force driving short-term price fluctuations. At least for now, when the market prices Layer 1 assets, it sees them less as companies that profit from fee cash flows and more as monetary assets competing for capital retention and liquidity shares.
免责声明:本文章仅代表作者个人观点,不代表本平台的立场和观点。本文章仅供信息分享,不构成对任何人的任何投资建议。用户与作者之间的任何争议,与本平台无关。如网页中刊载的文章或图片涉及侵权,请提供相关的权利证明和身份证明发送邮件到support@aicoin.com,本平台相关工作人员将会进行核查。


