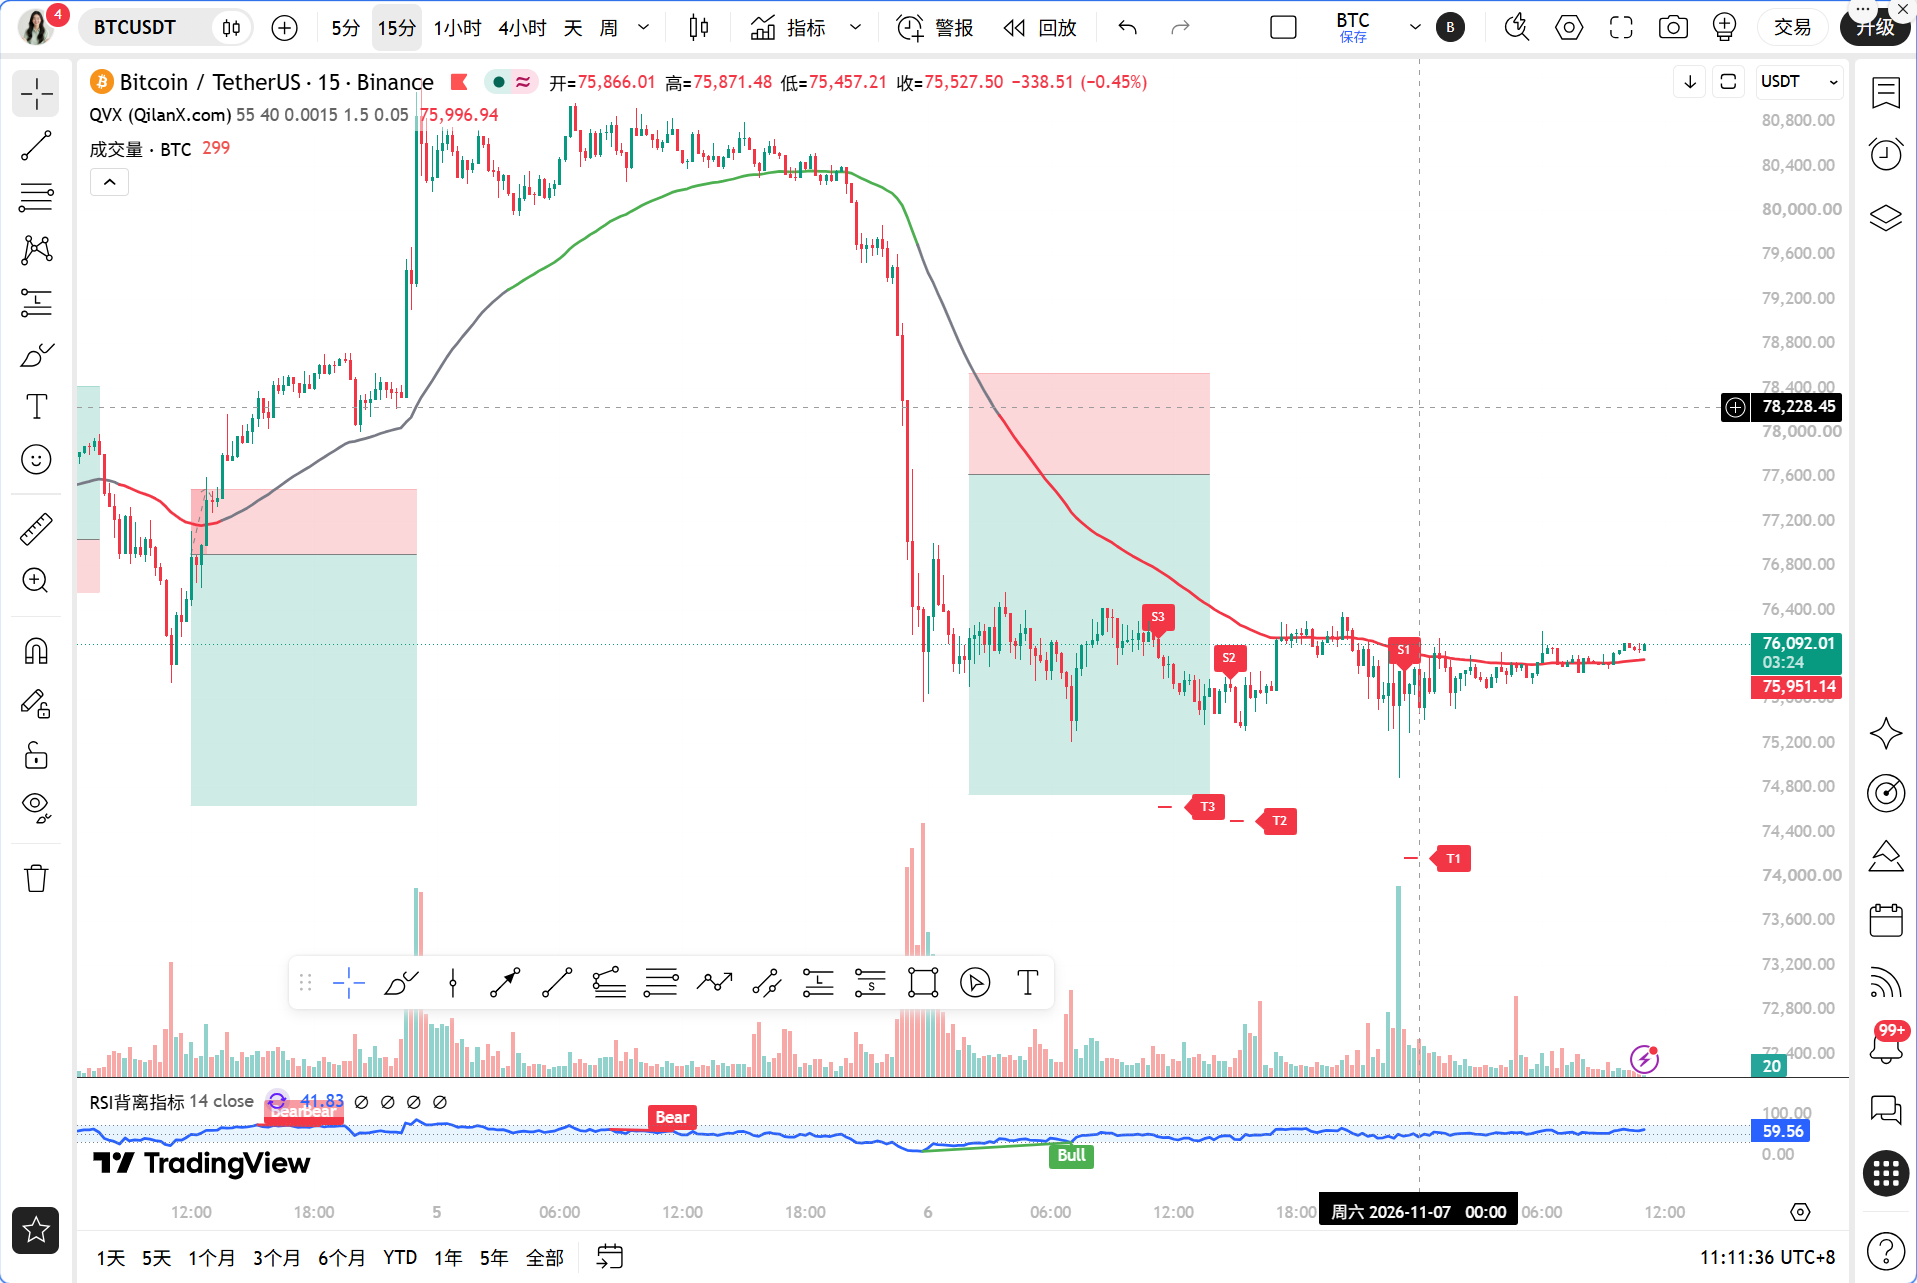
Dear teammates, today there are two messages that must be stated upfront. The first is that the U.S. non-farm payrolls for October added 165,000 jobs, far exceeding market expectations. The U.S. dollar index recorded its largest single-day gain in five months, and the probability of a rate hike in December jumped to 80%. This is a classic case of "good data being bad news," causing risk assets to come under pressure, and BTC naturally finds it hard to stand alone. The second message is that Waters is running for the chair of the Financial Services Committee and plans to strengthen regulation of the crypto industry, combined with the U.S. Treasury cutting off MEXC’s links to the U.S. financial system, expectations of stricter regulation are heating up. On one hand, there is macro pressure from tightening liquidity, and on the other hand, micro disturbances from compliance risks, with BTC currently standing at the sensitive position of 76,000, where both bulls and bears have no retreat. The Qinglan Crypto Classroom will use the TPV system today to analyze this situation step by step.
Current price and time
Current time is November 07, 11:11. The latest price of BTC is 76092 USDT. The 24-hour price change is -0.21%. The fluctuations seem minor, but there was already a drop below 75,000 during the day, indicating that the lower levels are not impenetrable. BTC's market share is 59.21%, with capital still concentrating on Bitcoin, and altcoins are under more obvious pressure. The Fear and Greed Index is at 25, indicating extreme fear; this emotional position is already quite cold, but cold does not equal a bottom; technical confirmations are needed.
Multi-cycle status overview
First, let's look at the daily chart. MA5=77196.38, MA10=77409.46, MA30=80425.76, the moving averages show a standard bearish arrangement with prices operating below all moving averages. In terms of MACD, DIF=-1475.94, DEA=-1167.18, and the histogram value is -308.75, both fast and slow lines are below the zero axis and have not crossed, indicating that bearish momentum is still being released. RSI=35.91, close to oversold but has not yet entered the extreme area below 30, overall the daily chart is still characterized by a bearish trend with low-level oscillation.
Now let's look at the 4-hour chart. MA5=75967.55, MA10=75985.21, MA30=77537.47, the short moving averages have begun to flatten and show signs of convergence, with prices repeatedly contesting near MA5 and MA10, but MA30 remains high up and creates resistance. The MACD's DIF=-659.38, DEA=-433.47, and histogram=-225.91, still in a negative state without crossovers. The most noteworthy point here is that RSI=23.39, which is deeply oversold, indicating a demand for technical repair at the 4-hour level, but oversold can become more oversold; one cannot simply rely on RSI to catch a bottom.
The 1-hour chart is the key observation level for today. MA5=75985.17, MA10=75933.58, MA30=75924.08, the three short moving averages are almost sticking together, and the price at 76092 is slightly above them, suggesting signs of stabilization in the short term. The MACD offers DIF=-198.98, DEA=-311.52, histogram=112.54, and the histogram value has turned positive, which is a positive signal for momentum recovery at the 1-hour level. RSI=56.41, in a neutral to bullish zone. However, the critical watershed EMA55=76806.52, the current price of 76092 is still 0.93% away from it, and the price remains below EMA55; according to the TPV rules, this is still a bearish trend area.
On the 15-minute level. MA5=76070.36, MA10=76013.07, MA30=75947.61, the moving averages are in bullish arrangement, and prices are above the moving averages. The MACD's DIF=49.81, DEA=39.08, histogram=10.73, with red bars continuing above the zero axis. RSI=61.52, showing strength. The 15-minute timeframe is the only one clearly tilted towards the bull today, indicating that the short-line rebound structure remains, but it is just a rebound, not a reversal.
TPV signal verification
We will check the three buy conditions of the Qinglan TPV system one by one. The first condition is that the price must stabilize above the 1-hour EMA55, requiring that the closing price of two consecutive 1-hour candlesticks be greater than EMA55. The current EMA55=76806.52, price 76092; in the past 8 1-hour candlesticks, the number of instances where the closing price was above EMA55 is 0/8, with crossings being 0 times; this condition is completely unsatisfied. The second condition is establishing support, the 1-hour level currently exhibits signs of convergence among short moving averages and a bullish formation of 15 minutes, but there has yet to be a clear long lower shadow or confirmed bottoming pattern. The third condition is that the downward momentum is exhausted, the 1-hour MACD histogram has turned positive consecutively, and the RSI has risen from the lows to 56.41, which partially satisfies the condition. Out of the three conditions, only one and a half are satisfied, so the buy signal does not hold.
Now let's look at the conditions for short selling. The first condition is that the price is under pressure below the 1-hour EMA55, and two consecutive 1-hour candlesticks' closing prices must be less than EMA55; this condition is satisfied, as the price has been operating below EMA55 for some time. The second condition is encountering resistance; the 1-hour level has not exhibited clear long upper shadows or topping patterns, and the 4-hour MA30=77537.47 is a higher pressure point above. The third condition indicates weakness in the rebound; the 1-hour MACD histogram is positive, and RSI at 56.41 has not retreated from above 70, so this condition is not satisfied. Out of the three short conditions, only one and a half are satisfied, which similarly does not establish a standard shorting signal.
The oscillation assisting data is also critical. In the past 8 1-hour candlesticks, closing prices above EMA55 occurred 0/8 times, with 0 crossings noted; the current price is 0.93% away from EMA55, which does not meet the 0.3% oscillation threshold. The system determines that the current conditions do not conform to oscillation, indicating a possible unilateral trend. Considering that the price continues to operate below EMA55, this unilateral trend is bearish; however, the 1-hour momentum is repairing, which belongs to the rebound phase within the bearish trend, not a clean short sell point, nor a confirmed long entry point.
On-chain/Funds
Looking at sentiment, the Fear and Greed Index is at 25, indicating extreme fear. Historically, this area often corresponds to stage bottom regions, but price behavior confirmation is necessary. From the funds perspective, the Coinbase Bitcoin premium index has been negative for 44 days, and buy orders in the U.S. market have remained weak, which is one of the core factors suppressing the height of BTC rebounds. The mining company Core Scientific sold 816 BTC, with only 32 remaining as it shifts to an AI data center, which increases supply pressure and reflects the harsh choices miners are facing under the current computational economy. On a positive side, a whale that has been silent for a year purchased 3,009 BTC worth $228 million, and after a five-month gap, another whale has added 8,775 ETH, indicating a willingness to accumulate at lows. However, it’s important to note that Fidelity transferred 27,000 ETH worth $60.27 million to Galaxy Digital in a single day; such large transfers may be for custody or market-making arrangements, requiring observation to see if they create real selling pressure. Overall, the funding situation is characterized by "institutional buy orders weakening, whales accumulating at lows, and supply side pressures" resulting in a struggle that is unlikely to create a unilateral force in the short term.
Key attack and defense levels
The first upward resistance level is at 1-hour EMA55=76806.52, which is the dividing line between bullish and bearish in the TPV system; the price must close above this level for two consecutive 1-hour candlesticks before discussing a trend conversion. The second resistance level is at 4-hour MA30=77537.47; above that is a dense area formed by the daily MA5=77196.38 and MA10=77409.46. The first downward support level is at the 75,000 integer level, which is the critical support mentioned in the news and has already been tested once during the day. The second support level is the short moving average support band formed by 4-hour MA5=75967.55 and MA10=75985.21, with the current price above this band. If 75,000 fails to hold, we should look at lower psychological levels; it’s not advisable to preset too deep in the short term.
Trading thoughts
Direction judgment: currently in the rebound repair phase of a bearish trend on the 1-hour level; the trend has not reversed, do not chase long, nor short during the momentum repair period. Focus primarily on following the trend after a key level breakout.
Long strategy: wait for the price to close above EMA55=76806.52 with two consecutive 1-hour candlesticks, and for the 1-hour to show a bottoming pattern or volume stagnation confirmation, with the MACD histogram maintaining continuity in red bars, only then can a light position be considered. Reference opening at the 76,850 to 77,000 range when the price does not break EMA55, with a stop-loss set below 76,000, which is a break below the current short moving average support band signaling exit; target levels look first at 77,537, and second around 78,000.
Short strategy: if the price rebounds to around EMA55=76806.52 and fails to sustain for two consecutive 1-hour candlesticks, and if a long upper shadow or topping formation appears, and the 1-hour MACD histogram shortens from red to green, consider entering a short position. Reference entry in the 76,600 to 76,800 range when under pressure, with a stop-loss set above 77,200; target levels look first at 75,967, and second at 75,000.
The current price of 76,092 is above the short moving average support band but below EMA55, placing it in the middle ground where neither side has high-probability entry conditions. Qinglan's advice is to patiently wait for the price to provide clear signals, not to guess the direction but to act on confirmation.
Risk Warning
Non-farm payrolls exceeding expectations have raised the probability of a rate hike to 80%. The combination of tightening macro liquidity and expectations of stricter regulation may trigger further selling and leveraged liquidations if the 75,000 support fails; strict stop-loss rules and position control are essential.
Follow the Qinglan Crypto Classroom to seize more trading opportunities! Welcome to visit the official website www.qinglan.org
📊 Qinglan TPV trading strategy backtest reference
🕒 Last backtesting time 11-07 07:00:02
Total analysis: 4940 Backtest: 4930 Accuracy: 76.3% (3763/4930)
免责声明:本文章仅代表作者个人观点,不代表本平台的立场和观点。本文章仅供信息分享,不构成对任何人的任何投资建议。用户与作者之间的任何争议,与本平台无关。如网页中刊载的文章或图片涉及侵权,请提供相关的权利证明和身份证明发送邮件到support@aicoin.com,本平台相关工作人员将会进行核查。